

Recommandé
Recommandé
Contenu connexe
Similaire à GDB tutorial
Similaire à GDB tutorial (20)
Dernier
Dernier (20)
GDB tutorial
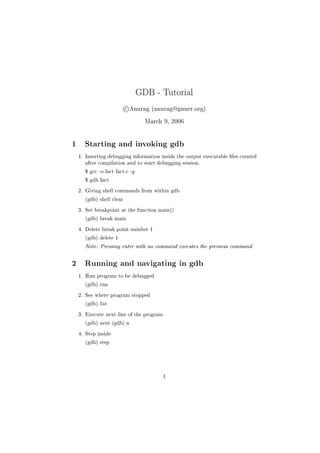
- 1. GDB - Tutorial c Anurag (anurag@gnuer.org) March 9, 2006 1 Starting and invoking gdb 1. Inserting debugging information inside the output executable
- 2. les created after compilation and to start debugging session. $ gcc -o fact fact.c -g $ gdb fact 2. Giving shell commands from within gdb (gdb) shell clear 3. Set breakpoint at the function main() (gdb) break main 4. Delete break point number 1 (gdb) delete 1 Note: Pressing enter with no command executes the previous command 2 Running and navigating in gdb 1. Run program to be debugged (gdb) run 2. See where program stopped (gdb) list 3. Execute next line of the program (gdb) next (gdb) n 4. Step inside (gdb) step 1
- 3. 5. Print stack trace (gdb) where (gdb) frame 0 (gdb) frame 1 6. Return back from function (gdb) return 7. Continue execution until the next break point. (gdb) continue 3 Retrieving values of variables 1. Display the value of a variable "i" (gdb) display i 2. Set hardware/software watch point for variable "i" (gdb) watch i 3. Print the value of variable "i" (gdb) print i 4. Print the address of variable "i" (gdb) print &i 5. Reassign a value to n (gdb) set variable n=6 (gdb) continue 6. Call fact() function with dierent parameters. (gdb) call fact(4) 7. Display the data type of a variable: (gdb) ptype i (gdb) whatis i 4 Segmentation faults 1. Segmentation faults Here we compile and execute a program with results in a segmentation fault. The snapshot of memory is saved in a
- 4. le called core $ gcc -o demo demo.c -g 2
- 5. $ gdb demo core (gdb) disassembly note: sethi = an assembly instruction A Made with L TEX 3