OncoPrime - Neuro
•
1 j'aime•368 vues

Our Phenotypic drug screening panel's latest addition with Patient derived Gliomas / Astrocytomas / Oligodendromas

Recommandé
Recommandé
Contenu connexe
Tendances
Tendances (20)
Similaire à OncoPrime - Neuro
Similaire à OncoPrime - Neuro (20)
Dernier
Dernier (20)
OncoPrime - Neuro
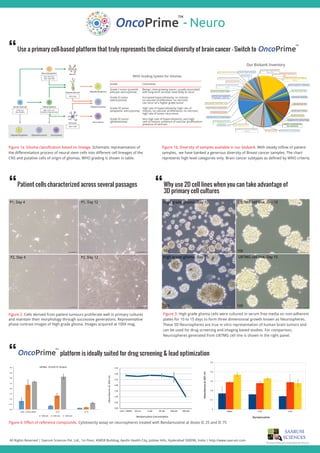
- 1. Onco - NeuroPrime TM All Rights Reserved | Saarum Sciences Pvt. Ltd., 1st Floor, AIMSR Building, Apollo Health City, Jubilee Hills, Hyderabad 500096, India | http://www.saarum.com SAARUM SCIENCES Phenotypic Platforms for Drug & Biomarker Discovery Figure 3. High grade glioma cells were cultured in serum free media on non-adherent plates for 10 to 15 days to form three dimensional growth known as Neurospheres. These 3D Neurospheres are true in vitro representation of human brain tumors and can be used for drug screening and imaging based studies. For comparison, Neurospheres generated from U87MG cell line is shown in the right panel. Bendamustine Concentration 0 0.1 0.2 0.3 0.4 0.5 DMSO IC25 IC75 Absorbanceat450nm Bendamustine cells + DMSO 0.8 um 4 uM 20 uM 100 uM 500 uM 0.00 0.50 1.00 1.50 2.00 2.50 3.00 3.50 mn054taecnabrosbA 0.00 0.50 1.00 1.50 2.00 2.50 3.00 3.50 4.00 OncoPrime TM Use a primary cell-based platform that truly represents the clinical diversity of brain cancer - Switch to “ Patient cells characterized across several passages “ Why use 2D cell lines when you can take advantage of 3D primary cell cultures“ OncoPrime TM platform is ideally suited for drug screening & lead optimization “ U87MG - IC25/IC75 Titration Cells + 0.225% DMSO IC 25 IC 75 1000 cells 2500 cells 5000 cells P1, Day 4 P1, Day 12 P2, Day 4 P2, Day 12 U87MG cell line, Day 10 U87MG cell line, Day 15 High grade glioma, Day 10 High grade glioma, Day 15 10X 10X 10X 10X Figure 4. Effect of reference compounds. Cytotoxicity assay on neurospheres treated with Bendamustine at doses IC 25 and IC 75 Figure 2. Cells derived from patient tumours proliferate well in primary cultures and maintain their morphology through successive generations. Representative phase contrast images of High grade glioma. Images acquired at 100X mag. Figure 1b. Diversity of samples available in our biobank. With steady inflow of patient samples, we have banked a generous diversity of Breast cancer samples. The chart represents high level categories only. Brain cancer subtypes as defined by WHO criteria. Figure 1a. Glioma classification based on lineage. Schematic representation of the differentiation process of neural stem cells into different cell lineages of the CNS and putative cells of origin of gliomas. WHO grading is shown in table. ASTROCYTOMA OF BRAIN ADENOCARCINOMA, METASTATIC, NOS LOW-GRADE FIBROMYXOID SARCOMA GLIOBLASTOMA MULTIFORME OF BRAIN NON-HODGKIN'S LYMPHOMA GLIOBLASTOMA NOS PITUITARY ADENOMA MENINGIOMA NOS NEOPLASM OF BRAIN GANGLIOGLIOMA GEMISTOCYTIC ASTROCYTOMA CEREBRAL ARTERIOVENOUS MALFORMATION TRIGEMINAL SCHWANNOMATUBERCULOSIS PRIMITIVE NEUROECTODERMAL TUMOR TRICHILEMMAL CYSTEPIDERMOID CYST OLIGODENDROGLIOMA, ANAPLASTIC MENINGOTHELIAL MENINGIOMA CRANIOPHARYNGIOMA TRANSITIONAL MENINGIOMA CARCINOMA, METASTATIC, NOS DIFFUSE NON-HODGKIN'S LYMPHOMA, LARGE CELL PILOCYTIC ASTROCYTOMA ANAPLASTIC ASTROCYTOMA OF BRAIN EPENDYMOMA NOS ANGIOMATOUS MENINGIOMA INFLAMMATORY DISORDER HEMATOMA Our Biobank Inventory Grade Grade I tumor (juvenile pilocytic astrocytoma) Grade II tumor (astrocytoma) Grade III tumor (anaplastic astrocytoma) Grade IV tumor (glioblastoma) Comments Benign, slow-growing tumor; usually associated with long-term survival; least likely to recur Increased hypercellularity; no mitosis; no vascular proliferation; no necrosis; can recur as a higher-grade tumor High rate of hypercellularity; high rate of mitosis; no vascular proliferation; no necrosis; high rate of tumor recurrence Very high rate of hypercellularity; very high rate of mitosis; presence of vascular proliferation; presence of necrosis WHO Grading System for Gliomas
- 2. Onco - NeuroPrime TM All Rights Reserved | Saarum Sciences Pvt. Ltd., 1st Floor, AIMSR Building, Apollo Health City, Jubilee Hills, Hyderabad 500096, India | http://www.saarum.com SAARUM SCIENCES Phenotypic Platforms for Drug & Biomarker Discovery PCR and sequencing: IDH1, PTEN, TP53, NF1, EGFR, CDK4, INK4A-ARF, MGMT, TIMP3, PDGFRA, 1p/19q deletion, B-Raf Amplification by qPCR EGFR, CDK4 and PDGFRA Promoter methylation: EGFR, INK4A-ARF, MGMT, TIMP3 genes Table 1. These patient samples were used for Glioma characterization Age Gender Clinical History Diagnosis 38yr Female Right Frontol SOL High Grade Glioma 49yr Male Right Frontol SOL Anaplastic Oligodendroglioma WHO Gr-III 32yr Male Right Frontal Lesion Anaplastic Astrocytoma WHO Gr-III Figure 7. Immunofluorescence staining for beta III Tubulin (left panel) with DAPI and GFAP (right panel) with DAPI of primary cells (High Grade Glioma) in culture. Arrow shows an astrocyte cell surrounded by possibly diferrentiated astrocytes. Figure 9. Glioma Panel - Cell Viability Assay. U87MG cell line (left) and Primary Glioma cells in culture (right) were treated with Bendamustine for 72 h at dose range 500 uM, 50 uM, 5 uM and 0.5 uM Figure 8. Nested PCR for EGFR / EGFR VIII U87 MG cell line shows EGFR expression at ~1 KB Figure 6. Glioma Panel –Senescence-ß-gal Assay. Top row - fibroblast cells used as positive control. Bottom row - oligo dendro glioma and high grade glioma cells as indicated. Arrows - show less than 5 % positive staining in primary cells as compared to ~95% positive staining in fibroblast controls GFAP-Green +DAPI 60X 60X beta III Tubulin +DAPI 60X 60X A comprehensive array of phenotypic characterizations... “• Expression microarrays mRNA and miRNA identification • Activation states of cellular kinases and other enzymes • Phenotypic measurements like cellular toxicity • Real Time PCR to quantify gene expression • FACS cell sorting to isolate cell populations of interest • FISH analysis with specific probes High grade glioma Oligo dendro glioma OncoPrime TM OncoPrime TM Applications of the platform “ Advantages of the platform “ Senescence assay to monitor neuronal death “ Identification of nerve cell type specific markers “ • Biomarker identification and validation • Target identification and validation • NME / NBE / NCE screening • Drug repurposing • Biosimilar / Biobetter characterization • Drug mechanism of action elucidation • Accurately reflect the disease phenotype and diversity • Better characterization and easy to adopt • Cost effective and shorten time to end points • Accelerated Preclinical Development • Novel disease models such as EMT and MET • 3D spheroid cultures to better mimic in vivo conditions 78.05 % 98.68 % 2.88 % 89.22 % 3.22 % 5.09 % 86.61 % 5.02 % 0.20 % 82.74 % 98.67 % 87.03 % 4.24 % 0.11 % 4.46 % 89.85 % 2.08 % 3.94 % Figure 5. High grade glioma (left panel) and oligo dendro glioma (right panel) in primary culture have a diploid amount of genomic DNA. A high percentage of cells are found to arrested at the G0/G1 phase at the time of sampling. 100X 100X Fibroblast Fibroblast Fibroblast Oligo dendro glioma Oligo dendro glioma High grade glioma 0 20 40 60 80 100 120 0.1 1 10 100 1000 %Viability Log Conc -20 0 20 40 60 80 100 120 140 160 0.1 1 10 100 1000 %Vuability Log Conc U87MG Glioma Lane Sample 1 100 bp ladder 2 1st round PCR product 3 2nd round PCR product 4 GAPDH 5 1 KB ladder 6 No template control EGFR 1 2 3 4 5 6