Different records give different curves: comparing deep sea and land-based palaeobiodiversity
•Download as PPT, PDF•
1 like•390 views


Recommended
Recommended
More Related Content
What's hot
What's hot (20)
Viewers also liked
Viewers also liked (19)
Similar to Different records give different curves: comparing deep sea and land-based palaeobiodiversity
Similar to Different records give different curves: comparing deep sea and land-based palaeobiodiversity (20)
More from Graeme Lloyd
More from Graeme Lloyd (14)
Recently uploaded
Recently uploaded (20)
Different records give different curves: comparing deep sea and land-based palaeobiodiversity
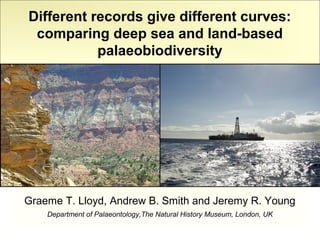
- 1. Different records give different curves: comparing deep sea and land-based palaeobiodiversity Graeme T. Lloyd, Andrew B. Smith and Jeremy R. Young Department of Palaeontology,The Natural History Museum, London, UK
- 2. Macrostratigraphic record Raw palaeodiversity Sampling opportunity Sedimentary Habitat record availability Rock record Biological driver driver Geotectonic history
- 3. Macrostratigraphic record Raw palaeodiversity Sampling opportunity Rock bias hypothesis Sedimentary Habitat record availability Rock record Biological driver driver Geotectonic history
- 4. Macrostratigraphic record Raw palaeodiversity Sampling opportunity Common cause hypothesis Sedimentary Habitat record availability Rock record Biological driver driver Geotectonic history
- 5. Macrostratigraphic record Raw palaeodiversity Which pathway drives the fossil record? Problem so far is that we have been looking at how different taxonomic groups are affected in the same rock record - where both rock and fossil records are created by the same set of drivers
- 6. coccolithophorids To understand which pathway drives the fossil record We need to look how the evolutionary history of a single widespread marine group (coccolithophorids) is recorded by 2 contrasting rock records (deep sea v. land based) Deep sea Land
- 7. coccolithophorids Predictions Common cause - correlation between sampled diversity and rock record in only one of the environments (land) Rock record bias - both environments will show strong link between sampled diversity and rock record Deep sea Land
- 8. Databases Deep sea Land 205 sites, 14405 samples, 462 sections, 5563+ samples, 46538 occurrence records 22745 occurrence records
- 9. Rock records Deep sea Land Rock record Number of cores recovering Number of localities with rock of given age published nannofossil taxonomic lists Time (Ma) Time (Ma)
- 10. Species diversity in fossil records Deep sea Land Raw species diversity Number of species Number of species Time (Ma) Time (Ma)
- 11. Species diversity versus rock record (1): raw data Deep sea Land Log (Nsites) Log (Nsites) Log (species richness) Log (species richness)
- 12. Species diversity versus rock record (1): first differences Deep sea Land Log (Nsites) Log (Nsites) Log (species richness) Log (species richness)
- 13. Estimating True Diversity Deep sea Land Two diversity curves - so which (if either) is correct? Use 4 techniques to try to find the true underlying diversity: • Rarefaction • Modeling • Alpha diversity estimates • Shareholder quorum With two rock records can cross-validate methods!
- 14. Estimating True Diversity: 1, Rarefaction Deep sea Land 109 samples per bin 106 samples per bin Species diversity (max) Species diversity (max) Time (Ma) Time (Ma) Blue = empirical pattern Black = diversity at equal subsampling
- 15. Estimating True Diversity: 2, Modeling Deep sea Land Diversity modeled as invariant Species diversity Species diversity Time (Ma) Time (Ma) Blue = empirical pattern Red = model prediction assuming diversity is invariant and shaped by rock abundance
- 16. Estimating True Diversity: 2, Modeling Deep sea Land Residuals from modeled diversity Time (Ma) Time (Ma)
- 17. Estimating True Diversity: 3, Alpha Diversity Deep sea Land Mean number of species recorded per site Species Species Time (Ma) Time (Ma) Time (Ma)
- 18. Estimating True Diversity: 4, Shareholder Quorum Deep sea Land Shareholder quorum richness at q = .40 Species Species Time (Ma) Time (Ma)
- 19. Summary Deep sea Land • The recorded history of coccolithophorid diversity over last 150 Ma changes dramatically according to whether data is drawn from land-based or deep-sea rock records • Coccolithophorid diversity correlates strongly to the shape of the rock record it is recovered from • Subsampling, modeling and estimates of mean alpha diversity all point to a third, much more uniform, diversity over time irrespective of which record is used
- 20. coccolithophorids Predictions Common cause - little or no correlation between diversity and rock record in the deep sea Rock record bias - both environments will show strong link between diversity and rock record Deep sea Land
- 21. Macrostratigraphic record Palaeodiversity Sampling opportunity Rock bias dominates Sedimentary Habitat record availability Rock record Biological driver driver Geotectonic history