Prediction, Explanation and the Business Analytics Toolkit
•
1 j'aime•1,311 vues

Slides used in Galit Shmueli's keynote address at the 2014 NASSCOM Big Data & Analytics Conference, Hyderabad, India. http://www.nasscom.in/bigdata/

Recommandé
Contenu connexe
Tendances
Tendances (20)
En vedette
En vedette (20)
Similaire à Prediction, Explanation and the Business Analytics Toolkit
Similaire à Prediction, Explanation and the Business Analytics Toolkit (20)
Plus de Galit Shmueli
Plus de Galit Shmueli (20)
Dernier
Dernier (20)
Prediction, Explanation and the Business Analytics Toolkit
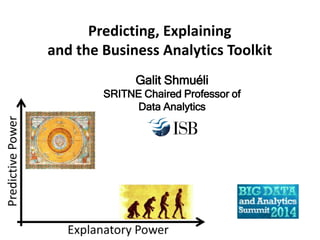
- 1. Galit Shmuéli SRITNE Chaired Professor of Data Analytics Predicting, Explaining and the Business Analytics Toolkit
- 2. Business Intelligence Traditional: Describe the past State-of-the-Art: Describe the present Business Analytics Predictive Analytics: Predict future of individual records Explanatory Analytics: Explain cause-effect of “average record” (overall effect)
- 3. Today’s Talk 1. Predictive Analytics: The process & applications 2. Prediction is not explanation 3. The Explanatory Analytics toolkit
- 4. Will the customer pay? What causes non-payment?
- 6. Past Present Future Case Studies Overall Behaviour “Presonalized” Behaviour
- 7. The Predictive Analytics Process Determine Outcome and Predictors Measurement Draw sample, Split into training/holdout Data Data Mining algorithms & Evaluation Models Predict New Records; Get More Data; Re-Evaluate Actions What to Predict? Why? Implications? Problem Identification:
- 9. Problem Identification Outcome: redemption Predictors: customer, shop & product info Measurement From similar past campaign (redeemers and non-redeemers) Data Predictive Algorithms Expected gain per offer sent Models & Evaluation Example 1: Personalized Offer Who to target? Which coupon? What medium? Send Offers (or not!) More Data & Re-Evaluation Actions
- 10. Problem Identification Outcome: performance Predictors: employee & training info Measurement From past training efforts (successes and failures) Data Which employees to train? Example 2: Employee Training Send employees for training (or not!) More Data & Re-Evaluation Actions Predictive Algorithms Expected gain per employee Models & Evaluation
- 11. Problem Identification Measurement Outcome: renewal Predictors: customer & membership info Data Past renewal campaigns (successes and failures) Which members most likely not to renew? Example 3: Customer Churn Send renewal incentive (or not!) More Data & Re-Evaluation Actions Predictive Algorithms Expected gain per person Models & Evaluation
- 12. Example 4: Product-level demand forecasting Problem Identification Actions Update Orders, Pricing, Promo Get More Data, Re-Evaluate Historic info Data Forecasting; Expected gain Models & Eval Measurement Outcome: month-ahead weekly forecasts of #units purchased, per item Predictors: past demand for this & related items, special events, economic outlook, social media Item-level weekly demand forecasts
- 13. Problem Identification Outcome: pay/not Predictors: customer, product, transaction info Measurement Past deliveries (payments and non-payments) Data Predict payment probability Example 5: COD Prediction Reconfirm with suspect deliveries More Data & Update Model Actions Predictive Algorithms Expected gain per delivery Models & Evaluation
- 14. Predictive Analytics: It’s all about correlation, not causation Algorithms search for correlation between the outcome and inputs Different algorithms search for different types of structure – lots of predictive algorithms! Every time they turn on the seatbelt sign it gets bumpy!
- 17. The Causal Explanation Process Determine Outcome and Causes Measurement Assign records to treatment(s) Collect data on inputs+output Data Statistical models & Evaluation of uncertainty Models & Eval Make Decisions; Implement Changes Get More Data and Re-Evaluate Actions Which Inputs Cause the Output? How? Implications? Inputs under our control, inputs uncontrollable Problem Identification:
- 18. What causes average customer to redeem? Example 1: Personalized Offer Change coupon design/type Collect new data (gender) Actions Problem Identification: Tailor training Prepare employees Incentivize learning Actions Example 2: Employee Training What causes average employee to succeed? Problem Identification:
- 19. Improve service Change target market Actions What causes average member not to renew? Example 3: Customer Churn Problem Identification: Create flexible designs Open new locations Actions Example 4: Demand Forecasting What causes high/low demand? Problem Identification:
- 20. Modify payment policy Change website design Train delivery staff Actions What causes average transaction to result in non-payment? Example 5: Cash-On-Delivery Prediction Problem Identification:
- 21. Toolkit for Determining Causality
- 22. Gold Standard: Controlled, Randomized Experiment
- 23. Beyond A/B Testing: Multiple factors and Interactions between factors
- 24. Causal Explanation with Observational Data (not a controlled experiment) Self Selection
- 26. Turns out: online and offline users differ on “awareness” Awareness of electronic services provided by Government of India
- 27. Performance Evaluation: % Using Agent Naïve Comparison: Online system → Less agents After correcting for self-selection: Online system → More agents for “unaware” users! Aware Unaware
- 30. Asia Analytics Lab @ ISB facebook.com/groups/asiaanalytics