
Recommandé
Recommandé
Contenu connexe
Plus de guest20ee0
Dernier
Dernier (20)
Tmd092208.Updatedoc
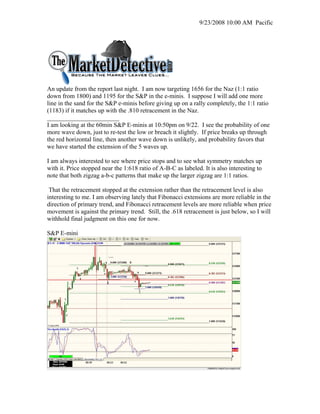
- 1. 9/23/2008 10:00 AM Pacific An update from the report last night. I am now targeting 1656 for the Naz (1:1 ratio down from 1800) and 1195 for the S&P in the e-minis. I suppose I will add one more line in the sand for the S&P e-minis before giving up on a rally completely, the 1:1 ratio (1183) if it matches up with the .810 retracement in the Naz. _______________________ I am looking at the 60min S&P E-minis at 10:50pm on 9/22. I see the probability of one more wave down, just to re-test the low or breach it slightly. If price breaks up through the red horizontal line, then another wave down is unlikely, and probability favors that we have started the extension of the 5 waves up. I am always interested to see where price stops and to see what symmetry matches up with it. Price stopped near the 1:618 ratio of A-B-C as labeled. It is also interesting to note that both zigzag a-b-c patterns that make up the larger zigzag are 1:1 ratios. That the retracement stopped at the extension rather than the retracement level is also interesting to me. I am observing lately that Fibonacci extensions are more reliable in the direction of primary trend, and Fibonacci retracement levels are more reliable when price movement is against the primary trend. Still, the .618 retracement is just below, so I will withhold final judgment on this one for now. S&P E-mini
- 2. 9/23/2008 10:00 AM Pacific The S&P E-minis are showing greater relative strength than the Naz e-minis. We just breached the .500 retracement level in the S&P while in the Naz we are already through the .618 level. Notice that the 1:1 ratio is just below, and seems to be aligned with the S&P revisiting its low. The Naz is also very close to the .810 retracement level which has been a common retracement level in the NASDAQ during this bear market. I have also drawn a red horizontal line that if breached to the upside before another wave down is completed, means that further downside is unlikely. NASDAQ e-mini So in both charts I am looking for a touch of the 1.00 lines just below current price. Just below that is .618 for S&P and .810 for the NASDAQ e-minis as a second level of support. If these levels are breached, then I will no longer favor another 5 waves up. If we get the rally, and I do favor a rally tomorrow whether we go one more wave down first, or continue from here, the major resistance zones to break through on the way up in the Naz are 1750, then 1800. In the S&P they are 1250 then 1292-1300. The market detective provides personal market opinion based on sound technical analysis and research. However, no warranty is given or implied as to its true reliability. The market detective will make errors and mistakes. The market detective is not an investment adviser and is not making recommendations to buy, sell, or place orders relating to the futures contracts, ETFs, or stocks that he writes about. The responsibility for decisions made from information contained in this service are solely that of the individual subscriber. The individual must fully research and make his/her own decisions before acting on any information provided by the market detective. The market detective assumes no responsibility for subscriber investment or trading results.