1. 2014 - 1 - Page 1
Name: ____________________________________________
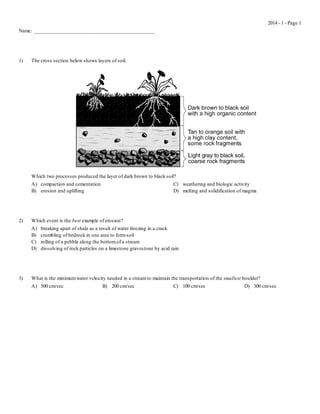
1) The cross section below shows layers of soil.
Which two processes produced the layer of dark brown to black soil?
A) compaction and cementation C) weathering and biologic activity
B) erosion and uplifting D) melting and solidification of magma
2) Which event is the best example of erosion?
A) breaking apart of shale as a result of water freezing in a crack
B) crumbling of bedrock in one area to form soil
C) rolling of a pebble along the bottom of a stream
D) dissolving of rock particles on a limestone gravestone by acid rain
3) What is the minimum water velocity needed in a stream to maintain the transportation of the smallest boulder?
A) 500 cm/sec B) 200 cm/sec C) 100 cm/sec D) 300 cm/sec
2. 2014 - 1 - Page 2
Questions 4 and 5 refer to the following:
The diagram below shows a meandering stream. Letters A, B, C, and D indicate locations on the streambed.
4) What are the largest particles that the stream shown can transport when its velocity is 200 centimeters per second?
A) pebbles B) sand C) silt D) cobbles
5) A decrease in the velocity of the stream shown will most likely cause an increase in
A) abrasion of the stream channel C) the size of the particles carried by the stream
B) deposition within the stream channel D) the amount of sediment carried by the stream
6) Complete the table below by listing three agents of erosion and identifying one characteristic surface feature formed by each
agent of erosion.
3. 2014 - 1 - Page 3
7) The map below shows a meandering stream as it enters a lake. Points A through D represent locations in the stream.
On the diagram below, draw a cross-sectional view of the general shape of the stream bottom between points A and B in the
given stream map. The water surface line has already been drawn.
8) State the relationship between stream velocity and the size of the sediment the stream can carry.
9) Deposition is affected by particle density. On the grid below, draw a line to show the relationship between particle density and
settling rate.
4. 2014 - 1 - Page 4
Questions 10 and 11 refer to the following:
In the water cycle diagram below, the arrows numbered 1 through 4 represent various processes.
10) Which numbered arrow in the diagram best represents the process of transpiration?
A) 1 B) 2 C) 3 D) 4
11) The clouds shown in the diagram have formed primarily because moist air
A) rises, expands, and warms C) sinks, compresses, and warms
B) rises, expands, and cools D) sinks, compresses, and cools
12) Which set of surface soil conditions on a hillside would result in the most infiltration of rainfall?
A) steep slope, unsaturated soil, no vegetation C) steep slope, saturated soil, vegetation
B) gentle slope, unsaturated soil, vegetation D) gentle slope, saturated soil, no vegetation
13) Describe how the size and shape of most pebbles change when the pebbles are transported in a stream over a great distance.
5. 2014 - 1 - Page 5
Questions 14 and 15 refer to the following:
Diagrams A, B, and C below represent three different river valleys.
14) Which bar graph best represents the relative gradients of the main rivers shown in diagrams A, B, and C?
A) C)
B) D)
15) Most sediments found on the floodplain shown in diagram A are likely to be
A) rounded and weathered from bedrock upstream C) angular and weathered from underlying bedrock
B) rounded and weathered from underlying bedrock D) angular and weathered from bedrock upstream
6. 2014 - 1 - Page 6
16) The columns A, B, C, and D shown below contain equal volumes of sediment.
When an equal volume of water is added to each column, the greatest rate of infiltration will occur in which column?
A) A B) B C) C D) D
17) The four streams shown on the topographic maps have the same volume between X and Y. The distance from X to Y is also the
same. All the maps are drawn to the same scale and have the same contour interval. Which map shows the stream with the
greatest velocity between points X and Y?
A) C)
B) D)
7. 2014 - 1 - Page 7
18) The diagram below shows tubes A and B partly filled with equal volumes of round plastic beads of uniform size. The beads in
tube A are smaller than the beads in tube B. Water was placed in tube A until the pore spaces were filled. The drain valve was
then opened, and the amount of time for the water to drain from the tube was recorded. The amount of water that remained
around the beads was then calculated and recorded. Data table 1 shows the measurements recorded using tube A.
If the same procedure was followed with tube B, which data table shows the measurements most likely recorded?
A) C)
B) D)