The Abortion pills for sale in Qatar@Doha [+27737758557] []Deira Dubai Kuwait
Hispanic Purchasing Power Ht
1. MARKET BRIEF
May 2004
U.S. Hispanic Purchasing Power:
1978-2010
U.S. Hispanic purchasing power has surged to nearly $700 billion and is projected to reach as
much as $1 trillion by 2010, according to new estimates by HispanTelligence®.
The rate of growth is nearly three times the overall national rate of the past decade and will
propel the aggregate disposable income of the nation’s largest minority group to $699.78 billion
in 2004, according to a HispanTelligence® analysis of data recently released by the U.S. Bureau
of Economic Analysis.
The rising affluence of the nation’s 38.8 million Hispanics is coming at a blistering pace. U.S.
Hispanic purchasing power has been increasing at a compound annual growth rate of 5.6 percent
since 1978, more than twice as fast as the 2.31 percent rate for total U.S. purchasing power
during the same period.
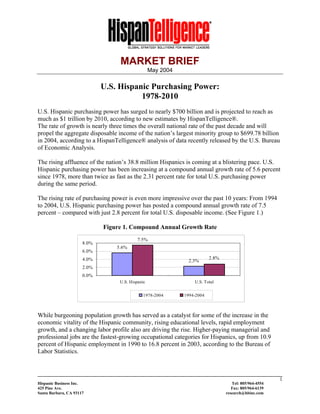
The rising rate of purchasing power is even more impressive over the past 10 years: From 1994
to 2004, U.S. Hispanic purchasing power has posted a compound annual growth rate of 7.5
percent – compared with just 2.8 percent for total U.S. disposable income. (See Figure 1.)
Figure 1. Compound Annual Growth Rate
7.5%
8.0%
5.6%
6.0%
4.0% 2.8%
2.3%
2.0%
0.0%
U.S. Hispanic U.S. Total
1978-2004 1994-2004
While burgeoning population growth has served as a catalyst for some of the increase in the
economic vitality of the Hispanic community, rising educational levels, rapid employment
growth, and a changing labor profile also are driving the rise. Higher-paying managerial and
professional jobs are the fastest-growing occupational categories for Hispanics, up from 10.9
percent of Hispanic employment in 1990 to 16.8 percent in 2003, according to the Bureau of
Labor Statistics.
1
Hispanic Business Inc. Tel: 805/964-4554
425 Pine Ave. Fax: 805/964-6139
Santa Barbara, CA 93117 research@hbinc.com
2. MARKET BRIEF
May 2004
Meanwhile, Hispanic employment has shown strong growth, increasing more than 13.8 percent
from January 2000 to March 2004, compared with overall U.S. employment growth that
fluctuated around 2 percent. The Hispanic jobless rate also has fallen: By the end of 2003, the
jobless rate was only 1.2 percentage points higher than the U.S. average – down from 4.1
percentage points in both 1982 and 1992.
Purchasing Power Projections
The outlook for continued growth in U.S. Hispanic purchasing power remains strong, and
HispanTelligence® has developed two projections based on several variables through 2010. (See
Figure 2.)
A conservative projection, Scenario 1, assumes a continued linear climb in U.S. disposable
income and the continued current earned-income differential between Hispanics and the total
U.S. population. Other factors, such as the number of Hispanic households with income, also
were held constant. Using these assumptions, U.S. Hispanic purchasing power would reach
$727.4 billion by 2010, up 17.5 percent from this scenario’s projected $619.2 billion for 2004.
The compound annual growth rate for Scenario 1 projections is 3.28 percent.
A more realistic projection, however, may be to account for a rate of change in the determinants
of Hispanic purchasing power. In Scenario 2, HispanTelligence® accounted for a narrowing of
the income gap between U.S. Hispanics and the total U.S. population, and an increase in the
number of Hispanic households with income.
Based on Census Bureau data, HispanTelligence® estimates that the rate at which U.S. Hispanic
household income is “catching up” to that of the total U.S. population is 1.28 percent annually,
increasing projections for U.S. Hispanic purchasing power growth considerably.
HispanTelligence® also estimated the rate of increase in Hispanic households reporting income
over the past decade, and while the rate is less than 1 percent, its additive effect on estimating
purchasing power is significant.
Based on Scenario 2 projections, HispanTelligence® expects U.S. Hispanic purchasing power
will surge nearly 51 percent to $1.055 trillion by 2010 – a rate that outpaces overall U.S.
disposable income growth by more than 36 percentage points. The compound annual growth rate
for Scenario 2 projections is 4.6 percent.
2
Hispanic Business Inc. Tel: 805/964-4554
425 Pine Ave. Fax: 805/964-6139
Santa Barbara, CA 93117 research@hbinc.com
3. MARKET BRIEF
May 2004
Figure 2. U.S. Hispanic Purchasing Power ($B): 2004 – 2010
1200
1000
800
600
400
200
0
2004 2005 2006 2007 2008 2009 2010
Scenario 1 Scenario 2
Table 1. U.S. Hispanic Purchasing Power Projections
2004 2005 2006 2007 2008 2009 2010
U.S. Total $8,208.64 $8,618.72 $8,823.76 $9,028.80 $9,233.84 $9,438.88 $9,643.92
Scenario 1 $619.2 $650.1 $665.6 $681.0 $696.5 $711.9 $727.4
% of Total 7.5% 7.5% 7.5% 7.5% 7.5% 7.5% 7.5%
Scenario 2 $699.8 $767.8 $820.5 $875.5 $932.9 $992.7 $1,055.0
% of Total 8.5% 8.9% 9.3% 9.7% 10.1% 10.5% 10.9%
The spending power of U.S. Hispanics currently accounts for 7.5 percent of total U.S. disposable
income and is estimated to remain unchanged through 2010 under Scenario 1. However, because
Scenario 2 accounts for the closing of the income gap and the increase in the number of Hispanic
households with an income, Hispanic disposable income as a percentage of total U.S. disposable
income is expected to increase. Under Scenario 2, Hispanic purchasing power currently accounts
for 8.5 percent and is expected to reach almost 11 percent of total U.S. disposable income by
2010 (See Table 1).
3
Hispanic Business Inc. Tel: 805/964-4554
425 Pine Ave. Fax: 805/964-6139
Santa Barbara, CA 93117 research@hbinc.com
4. MARKET BRIEF
May 2004
Historically, total U.S. purchasing power increased by more than 70 percent during the 1980s,
picking up pace in the 1990s to grow more than 84 percent. While the growth rate of Hispanic
purchasing power is expected to slow slightly over the next few years, the 2010 projection is still
predicted to reflect an increase of more than 80 percent over 2001. (See Table 2.)
Table 2. Historical Purchasing Power: ($B): Scenario 2
Year Value Year Value Year Value
1981 $174.68 1991 $306.17 2001 $584.61
1982 173.17 1992 343.02 2002 626.56
1983 203.92 1993 346.71 2003 668.51
1984 223.22 1994 365.96 2004 699.78
1985 235.26 1995 361.26 2005 767.75
1986 251.58 1996 391.95 2006 820.50
1987 265.23 1997 415.37 2007 875.55
1988 283.64 1998 464.87 2008 932.95
1989 290.72 1999 499.26 2009 992.75
1990 297.59 2000 564.28 2010 1,054.99
Growth 70.37% Growth 84.30% Growth 80.46%
CAG* 6.10% CAG* 7.03% CAG* 6.78%
The upward projections for Hispanic spending power continue a trend that began in the mid-
1980s. (See Figure 3.) A significant increase in purchasing power that occurred after 2000 can be
attributed to Census Bureau data that established the U.S. Hispanic population as the largest
minority group in the United States.
Figure 3. U.S. Hispanic Purchasing Power ($B): 1981 - 2010
$1,200
$1,000
$800
$600
$400
$200
$0
1980 1985 1990 1995 2000 2005 2010
4
Hispanic Business Inc. Tel: 805/964-4554
425 Pine Ave. Fax: 805/964-6139
Santa Barbara, CA 93117 research@hbinc.com
5. MARKET BRIEF
May 2004
Regional Purchasing Power Estimates
HispanTelligence® also has estimated U.S. Hispanic purchasing power in several key states with
significant Hispanic populations. (See Figure 4.) Purchasing power is the highest in California at
$157.6 billion, accounting for more than 22 percent of all U.S. Hispanic purchasing power;
Texas ranks second with $84.8 billion.
Together, California and Texas account for more than 34 percent of all Hispanic purchasing
power and nearly half of the entire U.S. Hispanic population resides in one of these two states.
(See Table 3.) Additionally, employment rates for Hispanics in California and Texas are
generally higher than in other states such as New York or Florida. Recent Bureau of Labor
Statistics data show 64.3 percent of California-based Hispanics, and 62.6 percent of Texas-based
Hispanics are employed; comparatively, 60.7 percent of Hispanics in Florida, and 56.5 percent of
Hispanics in New York are employed.
Figure 4. U.S. Hispanic Purchasing Power ($B) by State, 2004
180
$157.58
160
140
120
100
$84.80
80
60
$30.70 $28.51
40
$17.30 $13.49
20
0
California Texas New York Florida Colorado Illinois
5
Hispanic Business Inc. Tel: 805/964-4554
425 Pine Ave. Fax: 805/964-6139
Santa Barbara, CA 93117 research@hbinc.com
6. MARKET BRIEF
May 2004
Table 3. Distribution of Hispanic Population and Purchasing Power by State, 2004
Pct. of Hispanic Pct. of
Purchasing Power Hispanic Population
CA 22.5 30.8
TX 12.1 18.9
NY 4.4 7.9
FL 4.1 7.8
CO 2.5 2.1
IL 1.9 4.3
On a regional basis, Hispanics in California saw their disposable income grow the fastest over
the past six years than those in other states. Disposable income for California Hispanics has
grown at a compounded annual rate of 9.1 percent, compared to 8.16 percent for Illinois, and
7.63 percent and 6.71 percent for Colorado and Texas, respectively. (See Table 4.) The increase
in spending power in these states can be primarily attributed to population growth, although
evidence suggests Hispanics in these areas are also experiencing occupational mobility into
higher-paying sectors.
Table 4. U.S. Hispanic Purchasing Power by State, 1998-2004
1998 1999 2000 2001 2002 2003 2004 CAG
California $93.3 $103.7 $121.5 $133.9 $142.3 $149.9 $157.6 9.1%
Texas 57.5 59.2 73.9 73.8 76.8 81.1 84.8 6.7
NY 24.8 23.8 27.1 27.3 28.2 29.5 30.7 3.6
Florida 20.1 20.4 23.3 24.5 26.1 27.2 28.5 6.0
Colorado 11.1 11.9 13.0 14.8 15.3 16.4 17.3 7.6
Illinois 8.4 9.3 10.4 11.9 12.5 12.9 13.5 8.2
6
Hispanic Business Inc. Tel: 805/964-4554
425 Pine Ave. Fax: 805/964-6139
Santa Barbara, CA 93117 research@hbinc.com
7. MARKET BRIEF
May 2004
A regional review of purchasing power also highlights disparities. (See Table 5.) Hispanics in
and around Illinois report the highest average household income ($53,185), and the smallest
difference in earned income with the general state population. On average, Hispanics in the
Illinois region earn 93 cents to every dollar earned by non-Hispanics. Hispanics in California and
its surrounding areas report the second-highest average household income ($47,475), and a
moderate income disparity of 73 cents to every dollar. Hispanics in the New York area report the
lowest average household income ($40,015), and the worst income disparity of 65 cents to every
dollar.
Table 5. Average Hispanic Household Income
and Income Disparity Factors
Hispanic Average State Average
Household Income Household Income Disparity
Regions Income Factor
California $47,475 $64,783 0.733
Texas 40,015 54,690 0.732
NY 41,590 64,344 0.646
Florida 45,417 55,393 0.820
Colorado 41,433 56,557 0.733
Illinois 53,185 57,205 0.930
7
Hispanic Business Inc. Tel: 805/964-4554
425 Pine Ave. Fax: 805/964-6139
Santa Barbara, CA 93117 research@hbinc.com