Contenu connexe
Similaire à Iit E09 Q3 6 Ess(영문) (20)
Iit E09 Q3 6 Ess(영문)
- 1. IIT LIB-related Study Program 09-10 (September 2009)
Chapter 6 Trends in the Electric Power and Power Storage
Fields
This report is the first1 prepared by IIT on the electric power and power storage field,
which has the potential to grow into an important application for secondary cells in
the medium and long term. We have been hearing from all parts of the industry in the
last year or two about the potential for a secondary cell market to form in this field,
but there is a definite feeling of concept first2. The “electric power and power storage
field” can be further divided into a number of categories and applications. First, each
of the sub-categories must be examined to verify whether it technically and
essentially requires secondary cells. In this report, we gather information of all sorts,
limited to the Japanese market, and report the results of our qualitative analysis. The
Chapter 12 of this program (the March 2010 report) will investigate the secondary
cell market generated by the Smart Grid and Microgrid3 that are being considered
for introduction in Europe and North America. It will also report the results of our
quantitative forecast of the future market, including Japan.
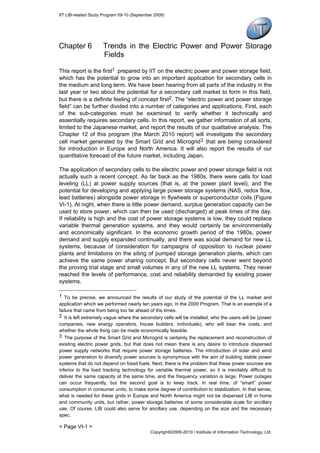
The application of secondary cells to the electric power and power storage field is not
actually such a recent concept. As far back as the 1980s, there were calls for load
leveling (LL) at power supply sources (that is, at the power plant level), and the
potential for developing and applying large power storage systems (NAS, redox flow,
lead batteries) alongside power storage in flywheels or superconductor coils (Figure
VI-1). At night, when there is little power demand, surplus generation capacity can be
used to store power, which can then be used (discharged) at peak times of the day.
If reliability is high and the cost of power storage systems is low, they could replace
variable thermal generation systems, and they would certainly be environmentally
and economically significant. In the economic growth period of the 1980s, power
demand and supply expanded continually, and there was social demand for new LL
systems, because of consideration for campaigns of opposition to nuclear power
plants and limitations on the siting of pumped storage generation plants, which can
achieve the same power sharing concept. But secondary cells never went beyond
the proving trial stage and small volumes in any of the new LL systems. They never
reached the levels of performance, cost and reliability demanded by existing power
systems.
1 To be precise, we announced the results of our study of the potential of the LL market and
application which we performed nearly ten years ago, in the 2000 Program. That is an example of a
failure that came from being too far ahead of the times.
2 It is left extremely vague where the secondary cells will be installed, who the users will be (power
companies, new energy operators, house builders, individuals), who will bear the costs, and
whether the whole thing can be made economically feasible.
3 The purpose of the Smart Grid and Microgrid is certainly the replacement and reconstruction of
existing electric power grids, but that does not mean there is any desire to introduce dispersed
power supply networks that require power storage batteries. The introduction of solar and wind
power generation to diversify power sources is synonymous with the aim of building stable power
systems that do not depend on fossil fuels. Next, there is the problem that these power sources are
inferior to the load tracking technology for variable thermal power, so it is inevitably difficult to
deliver the same capacity at the same time, and the frequency variation is large. Power outages
can occur frequently, but the second goal is to keep track, in real time, of “smart” power
consumption in consumer units, to make some degree of contribution to stabilization. In that sense,
what is needed for these grids in Europe and North America might not be dispersed LIB in home
and community units, but rather, power storage batteries of some considerable scale for ancillary
use. Of course, LIB could also serve for ancillary use, depending on the size and the necessary
spec.
< Page VI-1 >
Copyright©2009-2010 / Institute of Information Technology, Ltd.
- 2. IIT LIB-related Study Program 09-10 (September 2009)
The next time the use of secondary cells in the electric power field gathered
momentum was in 2005 and beyond. In all cases, they are related to the introduction
of new energy4, such as solar and wind power generation, intended to achieve a
low-carbon society. The first type is exemplified by “Development of Power Storage
System Technology to Facilitate Grid Linkage”, a common infrastructure research
program initiated by NEDO in 2007. It is a power storage system for neatly
connecting large-scale mega-solar plants and wind farms to the upstream end of
power grids. It uses secondary cells to rectify (stabilize the output of) solar and wind
power generation, which has highly variable output, so that it can be absorbed on the
grid side. NAS batteries and Gigacell (large NiMH batteries from Kawasaki Heavy
Industries) are suitable as the secondary cells, but the volume of such demand is
very limited.
Figure VI-1 Demand for Secondary Cells in the Electric Power and Power
Storage Fields (Japan)
The second is the installation of power storage batteries to accommodate the impact
of large-scale installation of solar cell generation, as called for by the Cool Earth
Promotion Program put forward in 2008 by the Fukuda administration, and by the
targets of the Fukuda Vision. Surplus power from solar cell generation systems
installed in homes can be sold to power compnies, which is called reverse power
flow, but that kind of flow in densely-populated regions could cause problems of
voltage spikes in the power grid. In electric utilities grids, the amount of power
supplied through the grid balances the amount of demand from homes, businesses
and elsewhere, and that balance makes it possible to maintain the frequency of the
power within a certain range. Specifically, variable thermal power generation and
other means are used to match fluctuations in demand. The problem is that if a large
solar cell generation capacity is installed in household units, these add power
supplies of basically unpredictable (weather dependant) output as a factor in the
system. Regardless of whether there is reverse power flow, the installation of large
4 In this report, we use the terms renewable energy and new energy in the following senses, in line
with general definitions. Renewable energy: Electrical energy that is generated using hydropower,
geothermal heat, temperature difference, wind power or sunlight, without requiring fossil or nuclear
fuels. New energy: Electrical energy that is generated using wind power or sunlight.
< Page VI-2 >
Copyright©2009-2010 / Institute of Information Technology, Ltd.
- 3. IIT LIB-related Study Program 09-10 (September 2009)
amounts of solar power could destabilize the frequency. The installation of power
storage batteries is one way to solve the problems of voltage and frequency. From
2008 to 2009, the Ministry of Economy, Trade and Industry set up many committees,
such as the “Research Group on Low-carbon Power Supply Systems” and the
“Research Group on Low-carbon Power Supply Systems, Sub-committee on Grid
Stabilization Measures and Cost Allocation for the Large-scale Introduction of New
Energy”, to examine many related issues and countermeasures. The former
completed its final report 5 in July 2009, concluding that the most economical
solution would be to “install power storage batteries on the grid side while
implementing power distribution measures”. It calculates that the power storage
batteries necessary as a countermeasure on the grid side by FY20306 would cost
JPY3.59 trillion. Installing large power storage batteries on the grid side would mean
NAS batteries and Gigacell, rather than LIB. It is not clear whether this conclusion
completely refutes the installation of power storage batteries, i.e. LIB, in homes.
Nevertheless, to overcome the problems of voltage and frequency, there is
absolutely no necessity of spending trillions of Yen to install power storage batteries
on the grid side or the home side. Little is said of this publicly7, but the amount
of surplus solar generation that would cause voltage spikes and frequency
fluctuations could simply be discarded as heat. Once the solar panels have been
installed, the sunlight costs nothing, so the portion that cannot be fully used can just
be discarded. On the question of “whether it technically and essentially requires
secondary cells” that was mentioned at the start of this chapter, “practically
speaking, there is no need for secondary cells” as a countermeasure against
voltage and frequency fluctuations.
So, will the demand for secondary cells, and particularly LIB demand8, in the electric
power and power storage fields be zero? The answer is still that “there is latent
demand for use in homes and collective housing”. In line with the above, “ideally,
secondary cells would be necessary”. There are a few possible patterns for “when to
charge and what power to charge with” and “when to discharge” (see Figure VI-2 for
specific examples), but dividing them broadly by purpose, introduction of the
following two types of LIB is likely. There is also latent LIB demand for use in the kind
of system proposed in Figure VI-18 in this chapter.
[1] LIB for LL use: Charge using midnight power (JPY9/kWh) and discharge in the hours of general
lighting rates (JPY23/kWh, daytime or early night hours, weather conditions when solar cell
generation is insufficient).
5 Report download site http://www.meti.go.jp/report/data/g90727ej.html
6 The target for introduction of solar cell generation is 28GW in 2020, and it has been calculated
that 13GW of that can be introduced without any grid-related countermeasures. The Federation of
Electric Power Companies announced in May 2008 that up to 5GW of wind power generation and
10GW of solar cell generation could be introduced without any grid countermeasures. However, we
have looked and been unable to find any clear basis for the calculation, and it does not appear to
take issues such as uneven regional distribution into account, so that can be regarded as a very
rough value. In any case, the capacity that can be installed without countermeasures will not be
exceeded before around 2015, so it seems likely that related demand for secondary cells will
emerge around that time.
7 As ecology, in the forms of reducing greenhouse gas emissions and building a low-carbon
society, has been raised as a banner issue, it is probably morally unacceptable to just throw away
power generated by photovoltaic cells, even if it was generated in error.
8 Of course, there is also demand for LIB for ancillary services, for peak cutting (use of LL
batteries at times of peak demand for lower contracted grid capacity and save costs), and for
backups (UPS) for disasters and power outages, but that also appears to be limited.
< Page VI-3 >
Copyright©2009-2010 / Institute of Information Technology, Ltd.
- 4. IIT LIB-related Study Program 09-10 (September 2009)
[2] LIB for PV use: Charge using surplus power from solar cell generation (zero charging cost) and
discharge in the hours of general lighting rates (JPY23/kWh, times and weather conditions when
solar cell generation is insufficient).
The price of surplus power from solar cell generation (=LIB charging cost) can be
regarded as zero. The cost of solar cell generation is the system installation cost/
total amount of power generated, and is currently put at around JPY46/kWh. In this
context, “surplus” means power that cannot be sold via reverse power flow, and can
only be discarded if it cannot be used up, so it is free. In general, the power used for
reverse power flow in patterns F, J, K and L in Figure VI-2 is called “surplus power”,
but here we use the term to mean power that cannot be used for reverse power flow
and can only be discarded.
While the purchase price of reverse power flow is set at the high level of JPY48/kWh,
surplus power from solar generation will be sold whenever possible, so it will never
be used to charge LIB batteries, unless in regions with no main power or in
independent power sources. But, as described above, there are certain to be
problems when large amounts of solar generation are installed on the power grid, so
eventually the purchase price for reverse power flow will be reduced and the volume
will be restricted. In that case, there is nothing to lose by using surplus power, which
would be discarded, to charge “cheap LIB”. If the power would be thrown away and
cannot be sold, it is better to save on the use of power at the general lighting rate of
JPY23kW/h, as in [2], to help pay back the cost.
Also, while it is possible to sell unlimited power through reverse power flow, it would
certainly be worth considering using LL LIB to cover daytime power demand, and sell
as much as possible of the solar power, rather than using it for home consumption9
(patterns J and K in Figure VI-2).
The allowable cost for PV LIB in [2] can be calculated in simple terms. That kind of
LIB can also contribute to LL in the power grid as a whole, so it would be worthwhile
for power companies, national government and local authorities to provide purchase
subsidies, but that is not taken into account in this calculation. With the assumptions
and equations below, the maximum value of (X) is JPY71.4/Wh, so the installation
cost comes to approximately JPY357,000. That is a reasonable figure, considering
the timing of that demand, which will emerge after the high purchase price for solar
cell generation comes to an end in 2020.
[2] Calculation of allowable cost for PV LIB
(PV LIB installation cost k JPY) = (Cost saving by LIB use k JPY)
5 kWh x (X) JPY/Wh = (5 kWh x 85% x 3650 x 23 JPY/kWh) / 1000
(Assumptions) LIB with initial capacity 5kWh
LIB system price for capacity (A) JPY/Wh
Lifespan 3,650 cycles (with 70% capacity retention), used for 10 years
The average capacity usable within a cycle is 85% of the initial capacity
General lighting power price is JPY23/kWh
9 Even without using LIB, it saves money to sell all power from solar generation and use power
bought at general lighting rates for home consumption, but under the terms of the power
companies’ power supply contracts, “only surplus power can be sold”.
< Page VI-4 >
Copyright©2009-2010 / Institute of Information Technology, Ltd.
- 5. IIT LIB-related Study Program 09-10 (September 2009)
Figure VI-2 Opportunities for LIB Charging and Discharging in the Home
Let us add supplementary remarks on the content of Figure IV-2. Power
consumption in an ordinary Japanese home is around 0.5kW in the midnight range
(11pm to 7am) (pattern A) and around 1.5kW in the day and night ranges (7am to
11pm) (pattern C). The rated generation capacity of home PV systems is around
3kW. In the case of pattern D, the PV generation alone is not enough to cover power
demand even in daytime, and power is also bought from the grid. In pattern E, PV
generation = power demand, so there is no electricity purchase, and in pattern F,
power can be sold through reverse power flow. Even if a LIB was installed in this
home, it would not be wise to use surplus power to charge the LIB in cases F and L,
if it could be sold instead. The high purchase price of JPY48/kWh is locked in for ten
years. It would be necessary to use power from solar cell generation to charge the
LIB when reverse power flow is not possible (pattern M), or when the amount is
restricted (pattern N). In the case of pattern N, there is the potential of using the LIB
for time shifting, storing the power until the time when it can be used for reverse
power flow. If the power stored in the LIB was used for home consumption in that
case, it would be used when the amount of PV generation was inadequate (patterns
O and P) or late at night (pattern Q). However, the LIB cannot be charged if the sun
< Page VI-5 >
Copyright©2009-2010 / Institute of Information Technology, Ltd.
- 6. IIT LIB-related Study Program 09-10 (September 2009)
does not shine all through the day. In that case, the LIB could be charged with
midnight power (pattern B), as described below, saving costs in patterns O and P.
LL LIBs can save costs by charging on cheap midnight power (pattern B) and
discharging in daytime and night periods when general lighting rates apply,
conforming to pattern B even without installing a PV system. However, in contrast to
charging from solar cell generation, it costs money to charge the LIB that way, so the
allowable cost calculation for LL LIBs in [1] is that much harsher than that for PV
LIBs, as shown below. (Y) comes to JPY43.4/Wh and the installation cost is
JPY217,000.
[1] Calculation of allowable cost for LL LIB
(LL LIB installation cost k JPY) = (Cost saving by LIB use k JPY)
5 kWh x (Y) JPY/Wh = (5 kWh x 85% x 3650 x (23-9) JPY/kWh) / 1000
(Assumptions) LIB with initial capacity 5kWh
LIB system price for capacity (A) JPY/Wh
Lifespan 3,650 cycles (with 70% capacity retention), used for 10 years
The average capacity usable within a cycle is 85% of the initial
capacity
General lighting power price is JPY23/kWh and midnight power
price is JPY9/kWh
In a house with a PV system, the cost of buying electricity can be reduced by
discharging the LL LIB, as in patterns H, I, J and K, even if the PV generation is not
used to charge the LIB. But it is not clear whether using LL LIB with reverse power
flow to sell electricity, as in patterns J and K, is permitted.
Panasonic and Sanyo are already planning pack products10 using 18650 cells for
home LIB. It is not clear whether they will be for LL use, PV use, or both. PV LIB
systems have higher allowable costs, but demand is unlikely to emerge before 2020,
while the FIT measure for solar generation is in effect. On the other hand, LL
systems could be installed now on a standalone basis, but the allowable cost would
be tough to meet. IIT would like to address the issue of when demand will emerge as
a topic for future analysis. It is, however, certain that the moves of PV system
suppliers and house manufacturers will be more important in this field than the
moves of LIB manufacturers. Even FC system suppliers are considering developing
products with bundled LIBs. It will be very interesting to watch the future moves of
Sanyo and Panasonic, to see whether they will sell LIBs in sets with their own PV
systems, sell them as detached house systems through Panahome or Sanyo Home,
or sell them as DC houses.
We will comment on trends in Japan’s power grid systems in the main section of this
chapter. It is certain that new energy will be closely related to the use of secondary
cells in Japan’s electric power field, but the peculiar character of Japan’s power
situation is a major reason why the introduction of secondary cells does not simply
go ahead. In Japan’s power grid systems, a group of giant electric facilities basically
manage and regulate generation, and supply power in one direction. Voltage and
10 If the LIB pack is no more than 5-10kWh, there would be no need to develop high-capacity cells
such as 50-100Ah. It would be exactly right to configure the packs with 18650 cells using the latest
design and mass production technologies, as used in cells for portable use. The drawback is that
Sanyo and Panasonic are not highly competitive in 18650 cells. Naturally, SDI and LGC have the
edge in performance, quality and cost.
< Page VI-6 >
Copyright©2009-2010 / Institute of Information Technology, Ltd.
- 7. IIT LIB-related Study Program 09-10 (September 2009)
frequency fluctuations, momentary power outages and prolonged power cuts are all
rare, and it is very difficult to blend that perfected system with reverse power flow
and the introduction of new energy. Maintenance of power quality is the highest
concern, and from the perspective of the power companies, the addition of mega
solar and wind farms without power storage batteries, and other unstable energy
resources, is a nuisance, as is the presence of reverse power flow, which is unstable
and reverses the conventional power supply direction. To link mega solar and wind
farms to the grid requires regulation and adjustment of generation and supply into a
generation pattern that the existing power companies will be able to accept. They will
not just accept everything they are told is eco-friendly.
They will not readily reduce their existing thermal and nuclear power generation just
because solar and wind power generation have been introduced in large quantities. It
is true that new energy is effective in reducing CO2 emissions, but as they are power
sources dependent on the weather, the power companies will not use them as
“alternative” generation methods. Even if solar and wind power generation are
introduced, it will still be necessary to maintain roughly the same capacity of variable
thermal generation. The idea that the use of solar and wind generation plus power
storage batteries would reduce the additional investment and maintenance costs for
variable thermal generation 11 has certainly been put forward, (the idea that the
reduction in investment in variable thermal power could be used as a resource for
the introduction of power storage batteries also makes sense), but while the power
companies recognize the moves towards lower carbon and ecology, they appear to
want to maintain their existing systems, dominated by thermal power.
Assuming, for argument’s sake, that solar and wind power could provide stable
supplies of power, there is still the recent problem that power demand in Japan has
peaked. There is already a supply surplus with existing hydroelectric, thermal and
nuclear power generation. We are sure the readers of this report are hoping to see
the introduction of secondary cells, but they must first grasp the circumstances and
inclinations of those in charge.
1. Japan’s Power Grid Systems and Power Demand and
Supply
Figure VI-3 shows Japan’s power grid systems. Power is distributed through a
number of substations between the power plants on the upstream end and homes on
the downstream end. Wind farms and mega solar installations, which are the large-
scale new energy generation facilities, have output of at least 1-2MW, and are
situated upstream of distribution substations. In contrast, 80% of the solar cell
generation which the state has set targets for is installed on homes. Reverse power
flow moving upstream from distribution substations is not permitted under the
Electricity Business Act. Power generated from homes can only use reverse power
flow as far as the distribution substations12, so it must be consumed within that
limited geographical area.
11 One example is the study by the group led by Associate Professor Yoshikuni Yoshida,
Department of Environmental Systems at the Graduate School of Frontier Sciences, the University
of Tokyo.
12 Naturally, power generated in homes in Kyushu cannot be consumed in Hokkaido. In Europe,
power distribution networks form a mesh within and between countries and the consumption range
for reverse power flow is broad, so that differences in solar cell generation between regions and
time zones can be smoothed out.
< Page VI-7 >
Copyright©2009-2010 / Institute of Information Technology, Ltd.
- 8. IIT LIB-related Study Program 09-10 (September 2009)
For a stable supply of power, the following must happen within the area under the
jurisdiction of each power company: [1] Maintenance of supply capacity in excess of
demand, and [2] Regulation of the amount of power generated to match demand.
The first is necessary to guarantee supply, and the latter is to maintain frequency
within a given range. If there is a surplus of supply, the frequency rises, and falling
when there is a shortage. As noted at the bottom of Figure VI-3, power demand
varies widely within a day. Power companies adjust the amount of power they
generate (on the power supply side, in Figure VI-3) to match demand. Large-scale
new-energy generation is connected upstream, where the power companies can
manage it. However, it is basically impossible for the power companies to manage
and adjust the quantity of solar cell generation produced from household units. The
installation of solar cell generation makes households both users and suppliers, and
that poses a thorny problem for power companies.
Figure VI-3 Japan’s Power Grid System and Installed Locations of New
Energy Generation
Note) ESS (Energy Storage System) is the secondary cell system that must be installed
together with the new energy installation that has been proposed since 2005.
When connected to the primary substation, it is “Power Storage System
Technology to Facilitate Grid Linkage”, as defined by NEDO, and when connected
to homes, it takes the form of power storage batteries installed as a
countermeasure against the voltage and frequency fluctuations that accompany
increased reverse power flow.
Currently, midnight generation can be covered by base power sources, such as
nuclear and hydroelectric power. Even if the LIBs of BEVs and PHEVs are charged
on midnight power, the supply would still be adequate. In short, the ideal generation
that power companies could wish for would be something like pumped storage
generation, which can generate only in the day, in line with power companies’
demands. From the perspective of the existing power companies, among the new
energy generation types that will be added in future, wind power generation could be
added in daytime but would not be needed at night. Wind power generation
< Page VI-8 >
Copyright©2009-2010 / Institute of Information Technology, Ltd.
- 9. IIT LIB-related Study Program 09-10 (September 2009)
operators naturally want to supply power day and night, so installation of power
storage batteries is one option open to them, to suppress and even out long-term
fluctuations. Without that, they could only stop wind power generation at night or
discard the power it produces them. They will weigh the cost of installing power
storage batteries in order to sell power generated at night during the day against just
stopping generation at night.
In that sense, solar cell generation is limited to daytime generation, but its generation
peak can be matched to the demand peak. Nevertheless, it is certainly uncontrollable
generation, so even mega solar facilities would require installation of power storage
batteries if they are to be connected to the grid, to absorb and rectify long-term and
short-term fluctuations to some extent. Solar cell generation in household units, on
the other hand, raises various problems, as described in the next section. In this
report we will not perform a quantitative demand forecast for the electric power and
power storage field in Japan, but we can state, in qualitative terms, that demand for
secondary cells in power storage systems to facilitate grid linkage, installed with
mega solar and wind farm facilities, will be very limited, and the battery type used
would be NAS batteries. Demand for secondary cells against voltage and frequency
fluctuation will be zero.
We will now present the basic data to give the reader a grasp of Japan’s electric
power situation. Figure VI-4 shows movements in Japan’s total power generation.
Total generation in FY08 stood at 1,032,978GWh, 3.9% down on the preceding year.
In FY09, the economic slowdown and the cool summer caused a major drop in
power generation. Estimating from bulletins released up to July, the total generated
power for FY0913 will be down by around 5%. The Federation of Electric Power
Companies Ten Year Plan schedules growth of less than 1.0% YOY. Power demand
is greatly influenced by the movements of the economy, and is difficult to forecast,
but it is reasonable to take a figure of around 1,000,000GWh for future power
demand.
Figure VI-4 Movements in Generated Power in Japan
13 According to the power demand bulletin published by the Federation of Electric Power
Companies in August 2009, the amount of power supplied by the ten electric utilities was down
10.8% from the same month of the preceding year. Demand from large industrial users recorded
-14.1%.
< Page VI-9 >
Copyright©2009-2010 / Institute of Information Technology, Ltd.
- 10. IIT LIB-related Study Program 09-10 (September 2009)
Note) Data from the Agency for Natural Resources and Energy. This is the total of all
generation from general electric utilities, other electricity businesses, home
generation and all other sources. It includes geothermal, solar, fuel cells and wind
power.
Peak power supply is a more important number than total generated power. The
power companies have a responsibility to supply power, so they must keep
generation capacity with a reserve of 10-20% above peak demand. For example, the
power demand peak is in August (Figure VI-5), but even that has stabilized at around
180,000MW.
Figure VI-5 Movements in Peak Power Supply in Japan
Note) Data from the Handbook of Electric Power Companies (Ohmsha Ltd., edited by
the Federation of Electric Power Companies Statistics Committee)
Figure VI-6 shows movements in the capacity of power generating facilities . Cross-
referencing to Figure VI-4 shows a pattern of long-term, sustained capital investment,
designed to avoid surplus capacity. But demand has been growing for decades, and
now there is the possibility of a growing surplus in capacity just from hydroelectric,
thermal and nuclear generation. The power companies are also expected to
introduce renewable energy towards a low-carbon society.
Figure VI-6 Movements in the Capacity of Japan’s Power Generating
Facilities
Note) Prepared using data from the Handbook of Electric Power Companies, the Power
Development Planning Almanac (Nikkan Denki Tsushinsha) and elsewhere.
< Page VI-10 >
Copyright©2009-2010 / Institute of Information Technology, Ltd.
- 11. IIT LIB-related Study Program 09-10 (September 2009)
The gap in power demand between night and day is another concern for the power
companies. Figure VI-7 shows the variation in demand through the system peak load
demand day (of CY07). The right side indicates the total generation capacity in FY08.
Power consumption is lowest at around 4am, and that level can be covered by
hydroelectric and nuclear power generations, which are the baseline power. In
practice, however, thermal power plants cannot be fully turned off. If they are turned
off, it takes time for them to start again, and it is not possible for them to
accommodate demand variations. Even so, the current level of midnight power
consumption does not require the power companies to add further supply capacity,
of new energy or any other kind. What they want is an ideal generating facilities that
can substitute for thermal generation during the day and do not emit CO2.
Figure VI-7 Japan’s Power Demand Variations Through a Day, Compared to
Generation Capacity
One idea type of generating facility is pumped storage generation, which also has an
LL function. However, the increase in pumped storage generation capacity is limited
by site constraints. Therefore, power companies want to combine solar cell
generation with power storage batteries to achieve the ideal power generation
pattern, as noted in the graph in Figure VI-3, but it is, of course, unfeasible to
introduce such systems at very large scale. The biggest reason for that is the cost.
Expectations are high for solar cell generation, which has few constraints on location,
but there is no comparison between the current cost of JPY46/kWh and the costs for
thermal and nuclear power. The second reason is that even with power storage
batteries, such systems cannot handle a week of rainy or windless weather. In short,
new energy cannot be an alternative energy source to fully substitute for sources
such as thermal and nuclear generation, so it will have to stay as only a certain
proportion.
Figure VI-8 shows movements in the shares of power generation for each plant type.
Thermal generation is the main type in Japan, but it is gradually being replaced by
nuclear. The social environment demands reduction of the proportion of thermal
generation, which emits large amounts of carbon, but it is difficult to find sites for
nuclear power plants. The total for renewable sources such as wind, geothermal and
solar now stands at a mere 1%. The Fukuda Vision set the policy goal of raising that
to at least 10% by 2030.
< Page VI-11 >
Copyright©2009-2010 / Institute of Information Technology, Ltd.
- 12. IIT LIB-related Study Program 09-10 (September 2009)
Figure VI-8 Movements in Shares of Power Generation for Each Plant Type
Note) Data from the Handbook of Electric Power Companies
Future social changes will basically achieve some level of LL (Figure VI-9). Demand
at night will be increased by BEV and PHEV charging, while the wider use of solar
cell generation will reduce demand on the existing grid in the day. These changes
will be apparent in the numbers by around CY20.
Figure VI-9 Forecast of Daily Power Demand (CY20)
Note) Forecast data from the Environment Agency are used for the diffusion of
BEV/PHEVs. Government targets were used for the diffusion of solar cell
generation. For BEV/PHEVs, it was assumed that they will charge from single-
phase 200V supplies, and that half of the owned base of such vehicles will be
fully charged. Solar cell generation was assumed to generate power at
approximately 50% of rated output.
2. New Energy Development Trends and the Potential for
Using Secondary Cells
We will now examine trends in wind and solar cell generation, new energy types that
will supply increasing amounts of power in future. We will also cover the necessity or
potential of using secondary cells when these new energy types are introduced. It is
true that these are types of energy that are better for the environment, but the power
companies are taking a cautious attitude on introducing them. They make stability
and quality maintenance their highest concerns, so they are minded to restrict
connection of these generation types to the grid. As described above, their external
environment is such that it does not let them invest vigorously in new energy.
< Page VI-12 >
Copyright©2009-2010 / Institute of Information Technology, Ltd.
- 13. IIT LIB-related Study Program 09-10 (September 2009)
1) Trends in solar cell generation
Figure VI-10 shows the production volumes and shipments of Japanese domestic
photovoltaic cell manufacturers. Domestic shipments are expected to increase in
future, although demand has been stagnant since subsidies were cut off. The
proportion of solar cell generation installed on private homes in Japan is
approximately 80%, in terms of capacity. Subsidies from the national government
and local authorities14 will resume in earnest in FY09, and shipments of solar cell
generation systems for homes are expected to reach 130,000 units. The Japanese
version of FIT15 will begin in November 2009, to further encourage diffusion. Plans
for mega solar facilities (1MW or more), mainly by power companies, have been
announced as shown in Figure VI-11. Solar cell generation really seems to have
picked up a following wind.
Figure VI-10 Movements in Shipments by Japanese Photovoltaic Cell
Manufacturers
Note) Data from the Japan Photovoltaic Energy Association (JPEA). The breakdown
between residential and industrial applications within domestic shipments for
electrical power use has been surveyed since FY2002.
14The national subsidy is JPY70,000/kW. Prefectures also have subsidy systems. Metropolitan
Tokyo provides JPY100,000/kW, and individual wards of the city have other subsidies, so it is
possible to pick up subsidies at three levels. For new home construction, the home manufacturers
sell solar cell generation systems at discounts in sales promotions. Sekisui Chemical offered a
discount of JPY70,000/kW until September.
15 The Japanese version of FIT is based on the idea of having all the citizens of the country bear
the cost of introducing new energy. Users bear the cost of power companies’ annual purchases of
solar power in the form of a solar cell generation promotion surcharge. The purchase price is
JPY48/kWh from residential systems of less than 10kW and JPY24/kWh from non-residential
systems. The power companies collect the surcharge for each year together with the next year’s
electricity bills. The increase in the charge for this financial year will be in the range JPY0~3/month
for ordinary households, and is expected to rise to JPY10~30/month next year.
< Page VI-13 >
Copyright©2009-2010 / Institute of Information Technology, Ltd.
- 14. IIT LIB-related Study Program 09-10 (September 2009)
Figure VI-11 Table of Mega Solar Plant Construction Plans in Japan
Note) Documents from the Federation of Electric Power Companies, etc.
The government target for the introduction of solar cell generation by FY20 is 28GW
(Figure VI-12). This is an aggressive plan, aiming to increase the FY08 generation
volume approximately twentyfold by FY20. The average generation capacity per
household is 3.7kW, so solar generation systems will have to be installed in
approximately 5.3 million homes. However, even if government and local authority
subsidies are used to introduce solar cell generation systems, and FIT benefits are
received it will still take a lengthy ten years to recoup the cost of a system installed in
FY10 (Figure VI-13).
Figure VI-12 Japan’s Installed Photovoltaic Cells and Future Plans
< Page VI-14 >
Copyright©2009-2010 / Institute of Information Technology, Ltd.
- 15. IIT LIB-related Study Program 09-10 (September 2009)
Figure VI-13 Movements in Prices of Residential Solar Cell Generation
Systems and Years to Recoup Investment
Note) This is the case when subsidies from the state, Metropolitan Tokyo and Ota ward
are used. The solar cell generation capacity was taken as 3.7kW and the annual
generation quantity was taken as 37,500kWh. Home consumption of solar cell
generation was assumed to be 50%, with the other 50% sold.
The reader should refer to analytical findings from specialist survey agencies on
whether or not the diffusion of solar cell generation will actually proceed in line with
government plans. We will now examine the problems that accompany the large-
scale introduction of solar cell generation.
Japan’s power grid was not built with reverse power flow from homes in mind. One of
the problems that could occur with the large-scale introduction of solar cell
generation 16 is increased voltage 17 (Figure VI-14). As Figure VI-14 shows,
resistance in the distribution cables between distribution substations and utility pole
transformers and individual homes means that the voltage supplied to each home
16 Many other problems besides increased voltage have been pointed out, one of which is that
there is not enough potential for adjusting frequency. The amounts of supply and demand for
power in the grid must be balanced in real time (the same quantities at the same time). At present,
this is achieved by a combination of three methods, using variable thermal power stations with
capacity that can track load: [1] Very small variations (between tens of seconds and a few minutes)
are handled by governor-free operation (changes of speed due to changes in generator output and
frequency are detected and used to open and close control valves, so that the generators run at
constant speed). [2] Short-cycle variations (up to about 20 minutes) are handled by LFC (Load
Frequency Control: automatic frequency control devices at the electricity supply command center
detect frequency deviations and issue output instructions that perform short-cycle load
adjustments). [3] Long-cycle variations (beyond about 20 minutes) are handled by ELD (Economic
Load Dispatch: Output instruction signals sent from electricity supply command centers). With
large-scale introduction of solar cell generation, the regulatory abilities of these methods,
particularly [2] LFC, would become inadequate.
17The Federation of Electric Power Companies has said that “it would be possible to accept solar
cell generation up to 10,000,000kW (=10GW), other than in cases of concentrated installation in
one place” (statement by the chair of the Federation of Electric Power Companies, May 2008).
Furthermore, the Central Research Institute of Electric Power Industry estimates that introduction
at above 30% would cause acute problems, and that 60% would necessitate central control by
power companies. Solar cell generation systems are most commonly installed on new houses, so
the problem of voltage increase could occur in newly-developed residential districts.
< Page VI-15 >
Copyright©2009-2010 / Institute of Information Technology, Ltd.
- 16. IIT LIB-related Study Program 09-10 (September 2009)
declines with distance (the solid black line). With this issue in mind, utility pole
transformers adjust the voltage ratio to bring 6.6kV to within 101V+/-6V. If there is
reverse power flow in the cables from individual homes, the effect of the resistance
would be reversed, to raise the voltage (the solid red line).
The power generated in homes cannot flow upstream from the distribution
substations by reverse power flow. Surplus power can only be consumed within the
region and range indicated in the upper illustration of Figure VI-14. Regular power
flow is indicated by blue arrows, reverse power flow by red arrows. With large-scale
introduction of solar cell generation, there would be districts with large amounts of
generation and districts with small amounts. The same is true for surplus power. If
power was allowed to pass beyond the distribution substations (upstream), it could
be expected to have a smoothing effect that would average out the amount of
generation. However, in the Japanese grid system, where the reverse power flow
points are limited, the power cannot be consumed in such wide areas as in Europe.
Figure VI-14 The Problem of Voltage Increase When Solar Cell Generation is
Introduced, and the Countermeasures
The problem of increased voltage has unimpressive effects when it occurs, and
causes no harm to users, either in homes or businesses. If the voltage rises, the
excess voltage protection circuit in the power conditioner operates, simply stopping
reverse power flow from solar cell generation, to prevent any impact on the power
grid. In that situation, reverse power flow is not possible even if the power is being
generated. Reverse power flow from users is stopped without their knowledge, and
their power sales are reduced.
However, if the problem is left at that, increasing complaints can be expected from
solar cell generation users, so the power companies and the Agency for Natural
< Page VI-16 >
Copyright©2009-2010 / Institute of Information Technology, Ltd.
- 17. IIT LIB-related Study Program 09-10 (September 2009)
Resources and Energy are considering other countermeasures. We will now check
the representative methods. The yellow in Figure VI-14 indicates action taken by
power companies, and green indicates ESS as the only action, taken by users. Of
course, even if it is the power company that takes the action, the burden of cost will
be transferred to the user in the form of increased electricity bills. Please refer to the
appendix for details of technologies such as SVC and SVR.
[1] Additional transformers More transformers would reduce the resistance of
cables to individual homes.
[2] Reduced distribution cable resistance Reduce resistance by using thicker cables, etc.
[3] Linked reactors Reactors can be inserted when increased voltage is
detected.
[4] Static Var Compensator (SVC) These use coils, reactors etc. to adjust voltage.
[5] Step Voltage Regulator (SVR) Transformer ratios are adjusted to adjust voltage.
[6] Loop Power Controller (LPC) Distribution substations are linked together to average
out power.
[7] Energy Storage System (ESS) Surplus power is adjusted in power storage batteries to
regulate reverse power flow.
Of these countermeasures, [1]-[3] can be introduced, in that order, in areas with
concentrations of solar cell generation. [4] and [5] can be applied in units of individual
utility pole transformers. [6] can be applied to distribution substation units. [7] with
power storage batteries is under consideration for distribution to individual houses.
Other than these, the measure of stopping the output of power conditioners during
periods of low power demand, such as the “Golden Week” cluster of national
holidays and the New Year period.
The Central Research Institute of Electric Power Industry has been working on the
development of [6] LPC, and has produced a prototype. They aim for practical
development by 2020. Figure VI-15 shows an external view of the prototype. It would
be connected between distribution substations to balance loads. Combined use with
SVR, or use of SiC in power elements will make LPC installations smaller, and their
future installation on utility poles is under consideration. LPC introduction is under
consideration, with priority for urban areas with concentrations of solar cell
generation.
Figure VI-15 LPC (Loop Power Controller) under Development by the Central
Research Institute of Electric Power Industry
The Agency for Natural Resources and Energy is studying the costs of some of
these countermeasures18. Power storage batteries are one countermeasure against
18If all solar cell generation on the user side was combined with power storage batteries, the cost
< Page VI-17 >
Copyright©2009-2010 / Institute of Information Technology, Ltd.
- 18. IIT LIB-related Study Program 09-10 (September 2009)
voltage increase, but the power companies have concerns about them. When power
flow basically happens in places beyond the reach of power management, adding
charging and discharging of power storage batteries would make the power supply
and demand situation even more complicated. The power companies need a method
to control power storage batteries, or at least monitor their states of charge and
discharge in real time. This is technologically possible with Power Line Controllers
(PLC), but the power companies use dedicated lines to manage power, so PLC
poses other problems, including security.
If power users install power storage batteries for the sole purpose of restricting
voltage increase, they would not readily accept the cost burden. If the power storage
batteries were charged at times of rising voltage and that power was then time
shifted to be sold later through reverse power flow, it would be good enough.
However, if they must use the power stored in their power storage batteries for their
own consumption, the amount they could sell by reverse power flow would be
reduced, and they would be using power that they generated with high-cost
(JPY46/kWh) solar power. They would not accept paying more than the general
lighting rate (JPY23/kWh).
Therefore, the installation of power storage batteries as a countermeasure to restrict
voltage rise is basically unfeasible 19 . In particular, measures [3]-[6] essentially
discard the power as heat, and [7] installs power storage batteries to avoid
discarding it. Ideally, we do not want to throw away power that has already been
generated with PV panels. In practice, however, the power companies want to
choose methods such as SVC, SVR and LPC, which are simple methods for
maintaining and managing power quality. For the power companies the installation of
more solar cell generation systems will result in a considerable reduction in the
amounts of power they supply. If the costs of measures to handle solar cell
generation become necessary for the sake of stable supplies, they will be cutting
their own throats. There is public opinion and government policy for promoting the
use of new energy, so it is only natural for them to feel that, if they must pursue such
contradictory activities as these, they would like to use the measures which cost the
least.
The practical argument is that if there are concerns and cost allocation problems
associated with installing power storage batteries for type [7], it would be better to
choose the low-cost option of throwing the power away as heat. If we pursue the
idealist argument over the rationalist one, there is also potential for installation of
secondary cells and ESS, as we will describe next.
Figure VI-16 shows the power consumption for a day in an average house and the
pattern of solar cell generation. The case illustrated is for solar cell generation on a
sunny day. In that case, electricity purchase (marked as power consumption in the
of countermeasures has been calculated at JPY5.4~6.7 trillion. If power storage batteries were
installed on the supply side, with utility pole transformers, and new pumped storage generation
capacity was built, the cost would be JPY4.6~4.7 trillion. The device prices are calculated at
JPY200,000 for utility pole transformers, JPY15 million for SVC and JPY47,000/kW for power
storage batteries.
19 One typical application is installation of power storage batteries at filling stations for emergency
use, in case of disasters. There is also state subsidy for that. There are also examples of operators
above a certain level of generation capacity introducing power storage batteries for peak cutting.
Using midnight power for peak cutting gains a bigger advantage. But they are only 20% of the total,
excluding home users.
< Page VI-18 >
Copyright©2009-2010 / Institute of Information Technology, Ltd.
- 19. IIT LIB-related Study Program 09-10 (September 2009)
diagram) and sale volume would be as shown in Figure VI-17. It is clear that homes
become both consumers and suppliers, but the ideal for the power companies would
be for this electricity purchase and sale (from the household) to be constants, not
time-dependent.
Figure VI-16 Daily Power Consumption in an Average House and the Amount
of Solar Cell Generation
Figure VI-17 Power Consumption and Sale in a House with Solar
Cell Generation
As Figure VI-18 shows, if secondary cells and ESS are installed in homes or in utility
pole transformers (or in distribution substations), and operate as controls, they
should increase midnight power consumption and yield a fixed amount of reverse
power flow in the day. If this was done in all households, it would provide power
companies with their ideal load and generators, and they could make a determined
effort to cut their generating facilities. The control methods are as follows:
- A timer is used at night to charge secondary cells installed in the home.
→ The minimum level of midnight power consumption is raised and
stabilized. If timers are used, there is no need for communications
infrastructure.
- In the day, the system can be regarded as a generator with stable output equal to
(solar cell generation + secondary cells).
→ Even if the amount of solar cell generation varies, power regulation is
< Page VI-19 >
Copyright©2009-2010 / Institute of Information Technology, Ltd.
- 20. IIT LIB-related Study Program 09-10 (September 2009)
still possible.
- Utility pole transformers will be equipped with ESS to allow for times of extremely
low solar cell generation.
→ If the amount of solar cell generation is low, power will be supplied from
the utility pole transformer. Supply within district units will always be
constant.
This system cannot be realized within existing regulations. The pattern would occur
by which midnight power is stored and simply sold back through reverse power flow,
and the power companies do not accept that. Power companies alone cannot
achieve complete LL, so even if they sustain some losses through the buying and
selling of electricity, there should be no problem with the realization of such a system
if it allowed them to cut their use of variable thermal generation. Users could
increase their sales of electricity, so they would have an incentive to install power
storage batteries. This kind of system should be proposed, so that users who have
invested their valuable funds in solar cell generation can use it without waste, the
balance of electricity supply and demand can be stabilized, and the power
companies can reduce their existing generating facilities.
Figure VI-18 Power Consumption and Sale in a House with (Solar Cell
Generation + ESS)
2) Trends in wind power generation
Figure VI-19 shows the movements in the amount of wind power generation and the
number of installed wind power plants in Japan up to CY08. The plan is to steadily
increase the amount of power generation20 beyond CY08. Output per wind turbine is
in the range 1~2MW. Compared to mega solar facilities, wind turbines can be
installed on relatively small sites, so many electricity wholesalers are now
participating.
20 There are many laws related to the installation of wind turbines. Siting studies are affected by
the Natural Parks Act, Forest Act, Nature Conservation Act, Sand Control Act, Landslide
Prevention Act, Cultural Assets Preservation Act, Agricultural Land Act, Act for Improvement of
Agricultural Promotion Areas, National Land Use Planning Act, City Planning Act, and others.
Construction works are affected by the Building Standards Act, Road Act, Road Traffic Act, Radio
Act, Civil Aeronautics Act, Fire Service Act, Noise Regulation Act, and Vibration Regulation Act. In
Japan, where land is a scarce resource, the locations for turbine installation are limited, so it is a
difficult environment in which to go on increasing the number of installed wind turbines in the long
term. There are an increasing number of cases of local residents opposing construction because of
noise problems. For these reasons, Japan has begun trials of offshore wind turbines have begun in
Japan, as have other countries.
< Page VI-20 >
Copyright©2009-2010 / Institute of Information Technology, Ltd.
- 21. IIT LIB-related Study Program 09-10 (September 2009)
Figure VI-19 Movements in the Amount of Wind Power Generation and the
Number of Installed Wind Power Sites in Japan
Note) NEDO data. These are sites with wind turbines in operation (including some
temporarily shut down for maintenance), with 10kW or more of capacity. Figures
for 2010 and beyond are totals of generation capacity under construction by
major wind power generation developers, such as Wind Power Development, J
Power, Clean Energy Factory, Eurus Energy, and Ecopower.
Figure VI-20 Movements in the Cumulative Wind Power Generation and
Cumulative Installed Wind Power Sites in Japan
Note) NEDO data. The amounts of generation shown in Figure VI-19 are totaled.
The two methods for stabilizing the output of wind power generation21 are long-term
cycle suppression and short-term cycle suppression. Short-cycle variations of up to
an hour are intended for peak cutting (at maximum generation output) and to
suppress output drops (at minimum generation output). These methods produce
21 Some take the view that power storage batteries would not be needed if the accuracy of
generation forecasting improved. However, the amount of wind power generation is proportional to
the cube of the wind speed, so a small error in the forecast makes a major change in the amount of
power. Site conditions cause specific local airflow, so forecasting is extremely difficult.
< Page VI-21 >
Copyright©2009-2010 / Institute of Information Technology, Ltd.
- 22. IIT LIB-related Study Program 09-10 (September 2009)
smooth output characteristics, so they are also called “smoothing”. To suppress
frequency variations in the grid, power companies regulate the output variations of
wind turbines in set short periods. Long-term variation suppression is broadly for
periods of over an hour and less than seven hours. As described above, power
companies do not need wind power generation at night and want it taken offline then.
The aim of this method is to store power during the offline period and use it for stable
daytime discharge.
Regulation of wind power generation has already begun. Figure VI-21 shows the
necessary rules related to linkage to the power company grid. Small wind turbines up
to 20kW face few regulations because they have little impact. Figure VI-22 shows
movements in the linkable capacity announced by each power company. Most power
companies demand disconnection from the grid (generation is prohibited) at night.
There is little demand for midnight power, and it just makes power stabilization
(frequency variation countermeasures) more difficult. The power companies already
restrict their acceptance of wind power, in order to keep frequency variation within
the adjustable range. That means that in the absence of power storage facilities,
power from wind power generation at night will be discarded.
Figure VI-21 Linkable Wind Power Generation Capacity and Number of Grid
Linkages
Figure VI-22 Movements in Electric Utilities’ Linkable Wind Power
Generation Capacity
< Page VI-22 >
Copyright©2009-2010 / Institute of Information Technology, Ltd.
- 23. IIT LIB-related Study Program 09-10 (September 2009)
Figure VI-23 Installed Capacity and Share of Wind Power Generation for
Each Power Company
The Tohoku and Hokkaido regions have favorable sitting conditions for wind power
generation. As Figure VI-23 showed, the share of wind power generation introduction
is higher than in other regions, and these are the first regions to experience problems
with grid linkage of wind turbines. In November 2008, Tohoku Electric Power Co.
was the first in Japan to set a “power storage slot” as a tendering condition for wind
power generation. The technical requirements are as shown below. Figure VI-24
shows the output voltage that meets the requirements.
[1] The total rated output of wind turbines connected to the power grid at one point must be at least
2,000kW.
[2] At normal times, the [maximum value - minimum value] of total output (average value over one
minute) of the wind power generating facilities over a 20 minute period from any arbitrary point in
time must not exceed 10% of the total rated output of the wind turbines.
[3] In the time bands specified by Tohoku Electric Power Company (eight hours a day, totaling
around 900 hours per year), modified output shall be held constant without outflow to the power
grid, or the wind turbines shall be disconnected (isolated) from the power grid.
[4] In the time bands specified by Tohoku Electric Power Company, if the output is kept to a
constant, the standard deviation between the total output (average value over one minute) of the
wind power generating facilities and the fixed control target value must not exceed 2% of the rated
output of the wind turbines.
[5] Control to reduce the modified output of the wind turbines immediately before the specified time
band and to increase that output immediately after the specified time period shall keep the change
in modified output per minute to 2% or less of the total rated output value for the wind turbines.
Figure VI-24 Generation Output Demanded by Tohoku Electric Power Co.
< Page VI-23 >
Copyright©2009-2010 / Institute of Information Technology, Ltd.
- 24. IIT LIB-related Study Program 09-10 (September 2009)
This demand for generation with power storage batteries were met the
Rokkashomura Power Station in Aomori prefecture, operated by Japan Wind
Development22. This is currently the only commercially-operated wind power plant
with power storage batteries in Japan. It uses NAS batteries with 3.5MW of capacity
for long-term variation.
Two wind power plants with power storage functions are expected to be built by
FY12. One is planned for construction in Otaru City, Hokkaido by Japan Wind
Development. It will have total generation capacity of 40MW (20 turbines of 2MW)
and 30MW of power storage batteries. Japan Wind Development are also planning
to install power storage batteries at Matsumae Town in Hokkaido (Figure VI-25).
Figure VI-25 Table of Wind Power Generation Equipment with Power Storage
Batteries
Cutting to the conclusion, the grid linkage of wind power generation depends on the
amount the power companies will accept, and that amount depends in turn on the
individual circumstances of those power companies. The conditions are most
stringent in the regions where the introduction of wind power generation is
progressing. From the point of view of the wind power operators, they will try long-
term variation suppression as an alternative to nocturnal disconnection, and their
most promising option is the installation of NAS batteries, which have a proven
record.
Short-term variation countermeasures are accorded low priority, but LIBs are
currently suitable for that application. For secondary cells to stand by for charging,
they standby at a moderately low SOC and perform high-rate charging and
discharging to regulate wind power output. That is really the same as the usage of
secondary cells in HEVs. The service life of wind turbines is 10~17 years, which
makes the cycle property requirement the challenge. LIC and other capacitor
suppliers are confident of their cycle properties and have high expectations for this
application.
3) Trends in NAS Batteries
Demand for secondary cells related to the introduction of new energy will be limited
for the time being. One market that is sure to form is that for NAS batteries, which
only NGK produce. Figure VI-26 gives the specifications of NAS batteries. These
long-awaited batteries went on sale in FY2002. The price of a system in the 1MW
22Tohoku Electric Power Co. has announced that grid connection is possible for wind power
generation with fixed-output control. The results of operating the Rokkashomura power plant
proved that there was no impact on frequency variations. Tenders will be accepted at any time from
December 21, 2009. The required generation output is expected to be as shown in Figure VI-24.
< Page VI-24 >
Copyright©2009-2010 / Institute of Information Technology, Ltd.
- 25. IIT LIB-related Study Program 09-10 (September 2009)
class, including AC/DC converters, is currently JPY200-250k/kW. The operating
temperature is 280-350°C, and a temperature maintenance heater is required during
operation. The heater incurs a loss of around 3kW per 50kW. Even taking that into
account, energy density is high enough. The Nagoya factory handles β alumina tube
manufacturing, sodium filling and sulfur molding, while the Komaki factory23 handles
metal component joints and assembly of individual cells.
Figure VI-26 Characteristics of NAS Batteries
Figure VI-27 shows published movements in revenue and operating profits for NGK’s
NAS battery business. Figure VI-28 shows movements in shipped capacity. After full-
scale shipments began in FY02, the business first went into the black in FY07, and
profits have been growing since. As has been announced in the newspapers, The
Abu Dhabi Water and Electricity Authority (ADWEA) in the United Arab Emirates
(UAE) has decided to order 300MW of NAS batteries and a central monitoring and
control system over five years from next financial year. Revenue will reach JPY35
23 The Komaki factory in Aichi Prefecture suffered a fire in July 2005. It started in the inspection
process for modules consisting of individual cells packed into SUS boxes. The details of why the
fire started are unclear, but cells of high energy density, like LIB, always face safety issues.
< Page VI-25 >
Copyright©2009-2010 / Institute of Information Technology, Ltd.
- 26. IIT LIB-related Study Program 09-10 (September 2009)
billion in FY2010.
Figure VI-29 shows cumulative figures to FY07 for the shares of capacity delivered to
each type of user. There is an 81% share for peak cutting and countermeasures
against momentary power outages, which corresponds to ancillary services for large
users, which will be described later. At present, NAS batteries are not used for LL on
the power company side, or for facilitating new energy grid linkage. The system price
per Wh is low enough, at JPY25, and the lifespan is adequate, at 4,500 cycles, but
the applications are still limited. The current price of LIBs is still higher, so this
suggests that, as we have described so far, if LIBs are to be used in power-related
and power storage applications, they must be technologically necessary and have
some arrangement for cost recovery.
Figure VI-27 Movements in NGK’s NAS Battery Business
Figure VI-28 Movements in Shipped Capacity of NAS Batteries
< Page VI-26 >
Copyright©2009-2010 / Institute of Information Technology, Ltd.
- 27. IIT LIB-related Study Program 09-10 (September 2009)
Figure VI-29 Application Shares for NAS Batteries
4) Ancillary Service
There is also demand for secondary cells in power-related and power storage
applications other than those related to the introduction of new energy. One of those
applications is what is called ancillary service. It operates and controls the power grid
to improve reliability and ensure safety. The service guarantees the maintenance of
frequency, voltage and supply capability. It is provided to factories, research
institutions, intelligent buildings, stadium, theme parks and other major power users,
and includes specific benefits such as prevention of instantaneous outages,
frequency stabilization, peak power cutting, and load leveling. To do so, it has come
to include power supply using secondary cells, and it is called ancillary service as
these functions are ancillary to the supply of power.
There is real demand for ancillary service in regions where the quality of power is
inferior to that in Japan. For example, A123systems in the USA has begun shipping
Ancillary Power Units (APU) using LIBs. We plan to report again on trends in this
application in Chapter 12. Also, when thermal power plants are used for low-output
generation, their fuel economy declines, so another usage method has begun in
which generation continues at high output and the surplus is stored in secondary
cells.
(End of Chapter 6)
< Page VI-27 >
Copyright©2009-2010 / Institute of Information Technology, Ltd.
- 28. IIT LIB-related Study Program 09-10 (September 2009)
Supplementary Material
Commentary on Power Grid Technology
1. Voltage and frequency regulations
The supply voltage standards for low-voltage users are stipulated by Article 44 of the
implementation rules to Article 26 of the Electricity Business Act. As Figure VI-a
shows, 100V-standard voltage is supplied at 101+/-6V. Frequency must be within +/-
0.2Hz of the standard frequency shown in Figure VI-b. The standard frequency is
50Hz in East Japan and 60Hz in West Japan.
Figure VI-a Standard Supply Voltage to Low-voltage Users
Figure VI-b Standard Supply Frequencies
Text of the Electricity Business Act (Voltage and frequency)
Article 26 Electric utilities (other than wholesale electric utilities and specified-scale
electricity suppliers. This condition also applies below) must strive to
maintain the voltage and frequency values for the electricity they supply
at the values stipulated by the Ministry of Economy, Trade and Industry.
2 Should the Minister of Economy, Trade and Industry recognize that
failure to maintain the voltage and frequency values of the electricity
supplied by the electric utility as specified by the Ministry of Economy,
Trade and Industry order stated above harms the interests of electricity
users, the Minister may order the electric utility concerned to make
repairs or improvements to electrical works in order to maintain said
values, to improve the methods of operation of the electrical works, or to
take other action.
3 Electric utilities must measure the voltage and frequency of the
electricity they supply, at the locations set by order of the Ministry of
Economy, Trade and Industry, and record and store the results.
2. Japan’s power grid and substations
Figure VI-c shows the power grid that distributes power between the power plant and
the home. Voltage is stepped up at substations close to power plants, and stepped
down at all others. There are four types of substations, as shown in Figure VI-d.
Power transmission between power companies passes through intermediate
substations. Power transmission between the Kanto and Kansai regions requires
frequency conversion. Large-scale users have private substations, although they are
not shown in Figure VI-c. Railway substations are independent. Railway transformer
output capacity is 6-60MV-A for conventional railways and 30-200MV-A for
Shinkansen. Figure VI-e shows the types of substation for each application.
< Page VI-28 >
Copyright©2009-2010 / Institute of Information Technology, Ltd.
- 29. IIT LIB-related Study Program 09-10 (September 2009)
Reverse power flow is restricted such that it can only move as far as distribution
substations. Therefore, the power coming from homes by reverse power flow must
be consumed within distribution substations units. Wind power plants and mega solar
facilities supply power to primary substations, and it is distributed to users.
Figure VI-c Japan’s Power Grid System
Figure VI-d Substation Names and Voltage Steps
Figure VI-e Substation Names and Applications
3. Voltage category
As Figure VI-f shows, voltage values are divided into low voltage, high voltage and
extra-high voltage. Figure VI-g is a table of nominal voltages.
Figure VI-f Voltage categories
< Page VI-29 >
Copyright©2009-2010 / Institute of Information Technology, Ltd.
- 30. IIT LIB-related Study Program 09-10 (September 2009)
Figure VI-g Nominal and Maximum Voltages
4. Single-phase AC, three-phase AC
AC transmission systems are categorized by the number of power lines supplied.
Single-phase has two lines, three-phase has three. Three-phase systems combine
three single-phase systems with phase angles displaced by 120° each. Basically,
three-phase transmission is used for higher-level power transmission, and single
phase for terminal power supply. Figure VI-i shows wiring from distribution
substations. Single-phase 100V and single-phase 200V can be used in ordinary
homes.
Figure VI-h Distribution Methods and Applicable Categories
Figure VI-i Wiring From Distribution Substations
5. Electricity contract types and demand
Demand for electric power is subdivided by demand category and contract type, as
in Figure VI-j. Demand categories are broadly divided between lighting and power,
based on contract capacity. Small-scale power for homes and similar users is
< Page VI-30 >
Copyright©2009-2010 / Institute of Information Technology, Ltd.
- 31. IIT LIB-related Study Program 09-10 (September 2009)
categorized as lighting services, while large-scale power for factories and the like is
categorized as power services. As Figure VI-k shows, the proportion taken by total
power consumption is gradually increasing, and reached nearly 30% of the total by
FY08.
Figure VI-j Demand Categories
Demand Contract types Range of application Value
categories
Lighting Flat-rate Used for lighting and small devices Up to 400VA
residential
lighting
Meter rate Contract capacity less
lighting than 50kW, where flat-
rate residential lighting
is inapplicable
Temporary Used for lighting and light machinery, Contract capacity less
lighting when the period for which electricity can than 50kW
be used under the contract is less than
one year
Public street Used for lighting and light machinery Contract capacity less
lighting installed for the illumination of general than 50kW
roads, parks, etc. for the public.
Lighting Commercial Supply is received at high voltage or extra- Contract capacity
and Power power high voltage, and is used for lighting, light 50kW or more
machinery, and power.
Power Low voltage Supply is received at low voltage, and is Contract capacity less
power used for power. than 50kW
High voltage Supply is received at high voltage, and is Contract capacity
power used for power. 50kW or more
Less than 2,000kW
Extra-high Supply is received at extra-high voltage, Contract capacity
voltage power and is used for power. 2,000kW or more
Temporary Supply is received at low voltage, high voltage or extra-high voltage,
power is used for lighting and power, and the contract duration is less than
one year
Agricultural Power used for agricultural irrigation and drainage
power
Self-generated Supply is received at high voltage or extra-high voltage, is used for
power backup lighting and power, and serves as backup against a failure in the
user’s generating facilities or other shortage
Standby Supply is received for commercial purposes at high voltage or extra-
power high voltage, is used for lighting and power, and serves as a standby
supply against a failure in the user’s full-time equipment or other
power shortage
< Page VI-31 >
Copyright©2009-2010 / Institute of Information Technology, Ltd.
- 32. IIT LIB-related Study Program 09-10 (September 2009)
Figure VI-k Movements in Power Demand in Demand Categories
Note) Separate statistics were only kept for the main categories of lighting and power
until FY99. Amounts of private power generation and private power consumption
were kept for private generating facilities of 500kW or more until FY02, and for
places of business with 1,000kW or more from FY03.
6. Load factor, demand factor, diversity factor
Power demand varies greatly through one day. Load factor represents the variation
of demand. It is calculated by the equation below. The smaller the load factor, the
greater the need for load leveling. The load factors of Japan’s ten power companies
are around 63%.
Average power demand (KW)
Load factor = x 100 (%)
Maximum power demand (KW)
It never happens that all users simultaneously use their full loads. Therefore, the
actual peak power demand that may occur differs from the rated capacities
(equipment capacities) of users. This relationship is represented by demand factor,
which is calculated by the equation below. The demand factor of an ordinary house
is around 50%, so there is a margin relative to equipment capacity.
Maximum power demand (KW)
Demand factor = x 100 (%)
Plant capacity (KW)
7. Electric power businesses
Electric power businesses are categorized as general electric utilities, wholesale
electric utilities, special electric utilities, and specified-scale electricity suppliers
(Figure VI-1). Figure VI-m shows examples of connection of electric utilities to grid
systems. Wholesale electric utilities often work with wind power generation. The
content of each business type’s operations is as shown in [1]-[4] below.
< Page VI-32 >
Copyright©2009-2010 / Institute of Information Technology, Ltd.
- 33. IIT LIB-related Study Program 09-10 (September 2009)
Figure VI-l Table of Electric Utilities (as of September 14, 2009)
Categories Businesses
General electric utilities Hokkaido Electric Power Co., Tohoku Electric Power Co.,
10 companies Tokyo Electric Power Co., Hokuriku Electric Power Co., Chubu
Electric Power Co., Kansai Electric Power Co., Chugoku
Electric Power Co., Shikoku Electric Power Co., Kyushu
Electric Power Co., Okinawa Electric Power Co.
Wholesale electric J-Power, The Japan Atomic Power Company, Hokuden
utilities Energy (formerly Hokkaido Hydroelectric Power Generation),
49 companies Joban Joint Power, Sakata Kyodo Power Company, Soma
Kyodo Power Company, Tohoku Natural Energy Development,
Kashima Kyodo Electric Power Co., Toyama Jikahatuden,
Wakayama Kyodo Power Company, Setouchi Joint Thermal
Power, Tobata Cooperative Thermal Power, Oita Cooperative
Thermal Power, Sumitomo Joint Electric Power, etc.
Special electric utilities Roppongi Energy Service, Suwa Energy Service, Sumitomo
5 companies Joint Electric Power, East Japan Railway Company, JFE Steel
Specified-scale Diamond Power Corporation, Marubeni, eREX, Nippon Steel
electricity suppliers Engineering, Ennet, Summit Energy, Daio Paper, Sanix,
26 companies Eneos, GTF Green Power, Eneserve, F-Power, Solar
Generation Plant, Solar Generation and Green Power
Marketing Agency, Spectol Power Design, Panasonic, Oji
Paper, Kyokuto Eletech, Sanyo Communications Engineering,
Daito System International, Japan Techno, Showa Shell
Sekiyu, JEN Holdings, Japan Wind Development, Orix,
Senboku Natural Gas Generation, Yamagata Green Power
Figure VI-m Overview of Electric Utilities
Note) Data extracted from documents by the Agency for Natural Resources and Energy
[1] General electric utilities (10 companies)
These businesses supply electricity to meet general demand.
[2] Wholesale electric utilities (49 companies)
< Page VI-33 >
Copyright©2009-2010 / Institute of Information Technology, Ltd.
- 34. IIT LIB-related Study Program 09-10 (September 2009)
These are businesses which supply general electric utilities with the electricity they
supply as general electricity, and the electrical works they provide conform with the
terms stipulated by the Ministry of Economy, Trade and Industry (total generation output
exceeding 2GW, etc.).
[3] Special electric utilities (5 companies)
These are businesses which supply electricity to meet demand at special supply
locations.
[4] Specified-scale electricity suppliers (25 companies)
These are businesses which supply electricity to users having a certain scale of demand,
and conforming to the terms stipulated by the Ministry of Economy, Trade and Industry
(contracted power is 50kW or more, etc.). Outside their service areas, they supply
specified-scale demand via electric lines maintained and operated by general electric
utilities, or by other operators.
Figure VI-n shows that general electric utilities have approximately 70% of all
generation capacity. Wholesale electric utilities have approximately 10%.
Figure VI-n Generation Capacities of Businesses
8. Pumped storage generation
In times of low power consumption, facilities for this kind of hydroelectric power
generation take surplus power from nuclear power plants and large thermal power
plants and use it to raise water from a lower reservoir to an upper reservoir. The
water is then released from the upper reservoir at times of peak demand to generate
electricity. It can be regarded as a power storage device using the potential energy of
water. Generation efficiency is approximately 70%. There is dedicated pumped
storage generation 24 which only uses pumped storage, and combined pumped
storage generation, which also uses natural inflow. Figure VI-o shows that the total
amount generated in this way in March 2009 was 25,756MW. That is equivalent to
14.3% of peak demand.
24Kannagawa Power Station is Tokyo Electric Power Co’s eighth pumped storage power plant.
Geological surveys began in 1991 and No.1 turbine began operating in FY07. Total construction
cost was JPY360 billion over 14 years. Land has been acquired for up to the No.6 turbine, and the
total cost once all plant is complete will be JPY480 billion. TEPCO’s Kannagawa Pumped Storage
Power Plant is open to the public. When author M visited in September, private roads to the power
plant and protective facilities were also being constructed. The power plant is underground, where
an enormous cavern has been built. It is not easy to change the installation plans for power grid
equipment. The author’s impression was that such capital investments must be based on an
understanding of existing large-scale development plans.
< Page VI-34 >
Copyright©2009-2010 / Institute of Information Technology, Ltd.
- 35. IIT LIB-related Study Program 09-10 (September 2009)
Dedicated pumped storage generation
Pumped storage generation uses only the upper and lower reservoirs. There is
almost no natural inflow to the upper reservoir, so the generation period is limited by
the volume of water in the upper reservoir. It is generally possible to generate power
for 6~8 hours. The height difference can be made larger to generate 1-2GW,
enabling adjustment of the power demand peak.
Combined pumped storage generation
There is natural inflow from upstream, which can be used in seasons of plentiful
water. Pumped storage generation is used in dry seasons. This type is made by
adding water-raising pumps to reservoir-type hydroelectric power plants. They are
used to adjust for the annual generation peak (summer).
Figure VI-o Table of Pumped Storage Power Plants
< Page VI-35 >
Copyright©2009-2010 / Institute of Information Technology, Ltd.
- 36. IIT LIB-related Study Program 09-10 (September 2009)
Figure VI-p Pumped Storage Power Plants
9. Power factor, reactive voltage, apparent power
In alternating current, both voltage and current vary over time. Equation (1)
expresses the relationship between the apparent power, voltage, current and power
factor of AC.
P E I cos
・・・・・ Equation (1)
P: Active power E: Effective voltage I: Effective current (E x I: Apparent power)
cosθ: Power factor
Apparent power (W) is simply the power expressed by the product of effective
voltage (V) and effective current (A), and the unit is VA (Volt-Amperes). Power factor
is power ÷ apparent power, expressed as cosθ. Active power is apparent power
multiplied by power factor, so it expresses the electrical energy actually consumed.
If the load is only resistance, the phase difference between voltage and current is 0
and power factor is 1. That means that there is no reactive power. However, when
capacitance and reactance are inserted as AC loads, the active power is reduced.
Current phase advances when the load is capacitance and retards when it is a coil.
Therefore these two components can be used to adjust phase, and thereby adjust
power factor. That forms a power factor improvement circuit.
10. Voltage variation regulators
SVC (Static Var Compensator)
The devices installed in substations are condensers, reactors and SVCs (static var
compensators). Condensers and reactors are controlled by switching on and off, and
their values are selected to suit the grid, so that the amplitude of voltage variation is
kept within a suitable range.
Figure VI-q shows the basic configuration of an SVC. A thyristor and reactor are
connected in parallel with a fixed condenser in an SVC, for rapid control of advanced
or retarded phase, to regulate voltage.
< Page VI-36 >
Copyright©2009-2010 / Institute of Information Technology, Ltd.
- 37. IIT LIB-related Study Program 09-10 (September 2009)
Figure VI-q SVC Equivalent Circuit Diagram
SVR (Step Voltage Regulator)
An SVR is an automatic voltage regulator. The principles of its operation are simple.
As Figure VI-r shows, switching the tap adjusts the voltage ratio between one circuit
and another. The transformer is called an LRT (Load Ratio Transfer). SVRs are
widely used from extra-high voltage transformers to distribution transformers. In
practice, there are between nine and 23 switchable taps in steps of 0.75-2.0%.
Figure VI-r SVR Equivalent Circuit Diagram
11. Power conditioners
Figure VI-s is a block diagram of a power conditioner. As photovoltaic cells generate
DC power, the DC voltage generated is raised by a DC/DC converter. The raised
voltage is converted to AC by a DC/AC converter and connected to loads or power
grids.
If reverse power flow is used, the system operates in the same phase as the grid
voltage and output current, so the power factor is 1. If the grid voltage is higher than
the set voltage, power conditioners advance the current phase. The phase differs
from the current flowing from the grid, so the voltage at the linkage point is reduced.
Voltage control operates until power factor reaches 0.8. The voltage rise suppression
effect of power conditioners is around 2-3%. If the voltage rises beyond the voltage
rise suppression range of the power conditioner, and the grid voltage rises, the
excess voltage protection circuit operates. In this state power is isolated from the grid
and reverse power flow is stopped.
When the system has power storage batteries, a circuit is needed to control charging
and discharging between the output point of the DC/DC converter and the power
storage batteries.
< Page VI-37 >
Copyright©2009-2010 / Institute of Information Technology, Ltd.
- 38. IIT LIB-related Study Program 09-10 (September 2009)
Figure VI-s Block Diagram of a Power Conditioner
12. Grid linkage regulations
The documents listed below contain the regulations applicable to linkage to the grid.
[1] Grid linkage regulations JEAC 9701-2006
The Japan Electricity Association, special committee on grid linkage
This is the regulation on linkage of dispersed power sources.
[1] Wind power generation regulations JEAC 5005-2001
The Japan Electricity Association, special committee on transformers
These are various types of regulation for wind power generation. The regulations also
provide examples for the calculation of power storage battery capacity. Related laws and
regulations for wind power generation equipment are also stated.
[3] Regulations on Batteries for Power Storage JEAC 5006-2007
The Japan Electricity Association, special committee on transformers
Content is presented on batteries for power storage. For load leveling purposes, the
battery capacity is set to 10% of the rated transformer capacity. For leveling of received
power, the capacity is set at 30-40% of contracted power.
[4] Power Conversion Devices for Grid Linkage of Dispersed Power Sources JEC 2470-2005
The Institute of Electrical Engineers of Japan, Electrical standards survey group
standard
This document is focused on definitions of technical terms and system configuration
examples for power conditioners and power storage systems.
13. Approach to calculating the capacity of power storage batteries for power storage
The method for determining the capacity of batteries for power storage applications
requires further study. The “Power Storage Battery Regulations” by the Japan
Electricity Association presents their approach to this issue. It refers to the
calculation method for power storage battery capacity used for the ancillary service
introduced above, and for similar applications, so the following extract is reproduced
for reference.
No.2, Article 8 Approach to calculating the battery capacity (extract)
[1] Capacity for load leveling
This capacity should be set with reference to the load situation of the installed transformer station.
In installations to date, battery capacity has been set to approximately 10% of total transformer
output capacity in distribution substations and similar locations, and there is an example of power
< Page VI-38 >
Copyright©2009-2010 / Institute of Information Technology, Ltd.
- 39. IIT LIB-related Study Program 09-10 (September 2009)
storage battery facilities of 6,000kW (three banks of 2,000kW) being installed on the secondary
side of a transformer.
[2] Capacity for received power leveling
Such equipment is commonly installed in a cramped space inside a commercial building, as one
element in the user’s power reception equipment, so it is preferable to consider installation space
and cost effectiveness before installing. Battery capacity must be considered with reference to the
equipment and load situation of the building, but in many cases the term for calculation is
minimization of contracted power, and the optimum battery capacity is set at 30-40% of contracted
power.
[3] Capacity for generated power leveling
Capacity selection should be based on thorough consideration of the maximum output and regular
average output of solar, wind and other generating facilities, of the proportion of output variation by
time and season, and of the time and range of variation for which leveling is required.
(End)
< Page VI-39 >
Copyright©2009-2010 / Institute of Information Technology, Ltd.
- 40. The Equipment List of the cell material
Mill, Mixing System, Composite System, Kiln System,
Distribuing System, Magnetic Separator etc.