Using Data Visualization for Behaviour Change
•
0 likes•1,081 views

Report
Share
Report
Share
Download to read offline

Recommended
Recommended
Mtp kit in kuwait௹+918133066128....) @abortion pills for sale in Kuwait City ✒Abortion CLINIC In Kuwait ?Kuwait pills +918133066128௵) safe Abortion Pills for sale in Salmiya, Kuwait city,Farwaniya-cytotec pills for sale in Kuwait city. Kuwait pills +918133066128WHERE I CAN BUY ABORTION PILLS IN KUWAIT, CYTOTEC 200MG PILLS AVAILABLE IN KUWAIT, MIFEPRISTONE & MISOPROSTOL MTP KIT FOR SALE IN KUWAIT. Whatsapp:+Abortion Pills For Sale In Mahboula-abortion pills in Mahboula-abortion pills in Kuwait City- .Kuwait pills +918133066128)))abortion pills for sale in Mahboula …Mtp Kit On Sale Kuwait pills +918133066128mifepristone Tablets available in Kuwait?Zahra Kuwait pills +918133066128Buy Abortion Pills Cytotec Misoprostol 200mcg Pills Brances and now offering services in Sharjah, Abu Dhabi, Dubai, **))))Abortion Pills For Sale In Ras Al-Khaimah(((online Cytotec Available In Al Madam))) Cytotec Available In muscat, Cytotec 200 Mcg In Zayed City, hatta,Cytotec Pills௵+ __}Kuwait pills +918133066128}— ABORTION IN UAE (DUBAI, SHARJAH, AJMAN, UMM AL QUWAIN, ...UAE-ABORTION PILLS AVAILABLE IN DUBAI/ABUDHABI-where can i buy abortion pillsCytotec Pills௵+ __}Kuwait pills +918133066128}}}/Where can I buy abortion pills in KUWAIT , KUWAIT CITY, HAWALLY, KUWAIT, AL JAHRA, MANGAF , AHMADI, FAHAHEEL, In KUWAIT ... pills for sale in dubai mall and where anyone can buy abortion pills in Abu Dhabi, Dubai, Sharjah, Ajman, Umm Al Quwain, Ras Al Khaimah ... Abortion pills in Dubai, Abu Dhabi, Sharjah, Ajman, Fujairah, Ras Al Khaimah, Umm Al Quwain…Buy Mifepristone and Misoprostol Cytotec , Mtp KitABORTION PILLS _ABORTION PILLS FOR SALE IN ABU DHABI, DUBAI, AJMAN, FUJUIRAH, RAS AL KHAIMAH, SHARJAH & UMM AL QUWAIN, UAE ❤ Medical Abortion pills in ... ABU DHABI, ABORTION PILLS FOR SALE ----- Dubai, Sharjah, Abu dhabi, Ajman, Alain, Fujairah, Ras Al Khaimah FUJAIRAH, AL AIN, RAS AL KHAIMAMedical Abortion pills in Dubai, Abu Dhabi, Sharjah, Al Ain, Ajman, RAK City, Ras Al Khaimah, Fujairah, Dubai, Qatar, Bahrain, Saudi Arabia, Oman, ...Where I Can Buy Abortion Pills In Al ain where can i buy abortion pills in #Dubai, Exclusive Abortion pills for sale in Dubai ... Abortion Pills For Sale In Rak City, in Doha, Kuwait.௵ Kuwait pills +918133066128₩ Abortion Pills For Sale In Doha, Kuwait,CYTOTEC PILLS AVAILABLE Abortion in Doha, ꧁ @ ꧂ ☆ Abortion Pills For Sale In Ivory park,Rabie Ridge,Phomolong. ] Abortion Pills For Sale In Ivory Park, Abortion Pills+918133066128In Ivory Park, Abortion Clinic In Ivory Park,Termination Pills In Ivory Park,. *)][(Abortion Pills For Sale In Tembisa Winnie Mandela Ivory Park Ebony Park Esangweni Oakmoor Swazi Inn Whats'app...In Ra al Khaimah,safe termination pills for sale in Ras Al Khaimah. | Dubai.. @Kuwait pills +918133066128Abortion Pills For Sale In KuwaAbortion Pills in Oman (+918133066128) Cytotec clinic buy Oman Muscat
Abortion Pills in Oman (+918133066128) Cytotec clinic buy Oman MuscatAbortion pills in Kuwait Cytotec pills in Kuwait
Model Call Girl Services in Delhi reach out to us at 🔝 9953056974 🔝✔️✔️
Our agency presents a selection of young, charming call girls available for bookings at Oyo Hotels. Experience high-class escort services at pocket-friendly rates, with our female escorts exuding both beauty and a delightful personality, ready to meet your desires. Whether it's Housewives, College girls, Russian girls, Muslim girls, or any other preference, we offer a diverse range of options to cater to your tastes.
We provide both in-call and out-call services for your convenience. Our in-call location in Delhi ensures cleanliness, hygiene, and 100% safety, while our out-call services offer doorstep delivery for added ease.
We value your time and money, hence we kindly request pic collectors, time-passers, and bargain hunters to refrain from contacting us.
Our services feature various packages at competitive rates:
One shot: ₹2000/in-call, ₹5000/out-call
Two shots with one girl: ₹3500/in-call, ₹6000/out-call
Body to body massage with sex: ₹3000/in-call
Full night for one person: ₹7000/in-call, ₹10000/out-call
Full night for more than 1 person: Contact us at 🔝 9953056974 🔝. for details
Operating 24/7, we serve various locations in Delhi, including Green Park, Lajpat Nagar, Saket, and Hauz Khas near metro stations.
For premium call girl services in Delhi 🔝 9953056974 🔝. Thank you for considering us!call girls in Dakshinpuri (DELHI) 🔝 >༒9953056974 🔝 genuine Escort Service 🔝✔️✔️
call girls in Dakshinpuri (DELHI) 🔝 >༒9953056974 🔝 genuine Escort Service 🔝✔️✔️9953056974 Low Rate Call Girls In Saket, Delhi NCR
More Related Content
Recently uploaded
Mtp kit in kuwait௹+918133066128....) @abortion pills for sale in Kuwait City ✒Abortion CLINIC In Kuwait ?Kuwait pills +918133066128௵) safe Abortion Pills for sale in Salmiya, Kuwait city,Farwaniya-cytotec pills for sale in Kuwait city. Kuwait pills +918133066128WHERE I CAN BUY ABORTION PILLS IN KUWAIT, CYTOTEC 200MG PILLS AVAILABLE IN KUWAIT, MIFEPRISTONE & MISOPROSTOL MTP KIT FOR SALE IN KUWAIT. Whatsapp:+Abortion Pills For Sale In Mahboula-abortion pills in Mahboula-abortion pills in Kuwait City- .Kuwait pills +918133066128)))abortion pills for sale in Mahboula …Mtp Kit On Sale Kuwait pills +918133066128mifepristone Tablets available in Kuwait?Zahra Kuwait pills +918133066128Buy Abortion Pills Cytotec Misoprostol 200mcg Pills Brances and now offering services in Sharjah, Abu Dhabi, Dubai, **))))Abortion Pills For Sale In Ras Al-Khaimah(((online Cytotec Available In Al Madam))) Cytotec Available In muscat, Cytotec 200 Mcg In Zayed City, hatta,Cytotec Pills௵+ __}Kuwait pills +918133066128}— ABORTION IN UAE (DUBAI, SHARJAH, AJMAN, UMM AL QUWAIN, ...UAE-ABORTION PILLS AVAILABLE IN DUBAI/ABUDHABI-where can i buy abortion pillsCytotec Pills௵+ __}Kuwait pills +918133066128}}}/Where can I buy abortion pills in KUWAIT , KUWAIT CITY, HAWALLY, KUWAIT, AL JAHRA, MANGAF , AHMADI, FAHAHEEL, In KUWAIT ... pills for sale in dubai mall and where anyone can buy abortion pills in Abu Dhabi, Dubai, Sharjah, Ajman, Umm Al Quwain, Ras Al Khaimah ... Abortion pills in Dubai, Abu Dhabi, Sharjah, Ajman, Fujairah, Ras Al Khaimah, Umm Al Quwain…Buy Mifepristone and Misoprostol Cytotec , Mtp KitABORTION PILLS _ABORTION PILLS FOR SALE IN ABU DHABI, DUBAI, AJMAN, FUJUIRAH, RAS AL KHAIMAH, SHARJAH & UMM AL QUWAIN, UAE ❤ Medical Abortion pills in ... ABU DHABI, ABORTION PILLS FOR SALE ----- Dubai, Sharjah, Abu dhabi, Ajman, Alain, Fujairah, Ras Al Khaimah FUJAIRAH, AL AIN, RAS AL KHAIMAMedical Abortion pills in Dubai, Abu Dhabi, Sharjah, Al Ain, Ajman, RAK City, Ras Al Khaimah, Fujairah, Dubai, Qatar, Bahrain, Saudi Arabia, Oman, ...Where I Can Buy Abortion Pills In Al ain where can i buy abortion pills in #Dubai, Exclusive Abortion pills for sale in Dubai ... Abortion Pills For Sale In Rak City, in Doha, Kuwait.௵ Kuwait pills +918133066128₩ Abortion Pills For Sale In Doha, Kuwait,CYTOTEC PILLS AVAILABLE Abortion in Doha, ꧁ @ ꧂ ☆ Abortion Pills For Sale In Ivory park,Rabie Ridge,Phomolong. ] Abortion Pills For Sale In Ivory Park, Abortion Pills+918133066128In Ivory Park, Abortion Clinic In Ivory Park,Termination Pills In Ivory Park,. *)][(Abortion Pills For Sale In Tembisa Winnie Mandela Ivory Park Ebony Park Esangweni Oakmoor Swazi Inn Whats'app...In Ra al Khaimah,safe termination pills for sale in Ras Al Khaimah. | Dubai.. @Kuwait pills +918133066128Abortion Pills For Sale In KuwaAbortion Pills in Oman (+918133066128) Cytotec clinic buy Oman Muscat
Abortion Pills in Oman (+918133066128) Cytotec clinic buy Oman MuscatAbortion pills in Kuwait Cytotec pills in Kuwait
Model Call Girl Services in Delhi reach out to us at 🔝 9953056974 🔝✔️✔️
Our agency presents a selection of young, charming call girls available for bookings at Oyo Hotels. Experience high-class escort services at pocket-friendly rates, with our female escorts exuding both beauty and a delightful personality, ready to meet your desires. Whether it's Housewives, College girls, Russian girls, Muslim girls, or any other preference, we offer a diverse range of options to cater to your tastes.
We provide both in-call and out-call services for your convenience. Our in-call location in Delhi ensures cleanliness, hygiene, and 100% safety, while our out-call services offer doorstep delivery for added ease.
We value your time and money, hence we kindly request pic collectors, time-passers, and bargain hunters to refrain from contacting us.
Our services feature various packages at competitive rates:
One shot: ₹2000/in-call, ₹5000/out-call
Two shots with one girl: ₹3500/in-call, ₹6000/out-call
Body to body massage with sex: ₹3000/in-call
Full night for one person: ₹7000/in-call, ₹10000/out-call
Full night for more than 1 person: Contact us at 🔝 9953056974 🔝. for details
Operating 24/7, we serve various locations in Delhi, including Green Park, Lajpat Nagar, Saket, and Hauz Khas near metro stations.
For premium call girl services in Delhi 🔝 9953056974 🔝. Thank you for considering us!call girls in Dakshinpuri (DELHI) 🔝 >༒9953056974 🔝 genuine Escort Service 🔝✔️✔️
call girls in Dakshinpuri (DELHI) 🔝 >༒9953056974 🔝 genuine Escort Service 🔝✔️✔️9953056974 Low Rate Call Girls In Saket, Delhi NCR
Recently uploaded (20)
Brookefield Call Girls: 🍓 7737669865 🍓 High Profile Model Escorts | Bangalore...
Brookefield Call Girls: 🍓 7737669865 🍓 High Profile Model Escorts | Bangalore...
➥🔝 7737669865 🔝▻ Kolkata Call-girls in Women Seeking Men 🔝Kolkata🔝 Escorts...
➥🔝 7737669865 🔝▻ Kolkata Call-girls in Women Seeking Men 🔝Kolkata🔝 Escorts...
Sector 105, Noida Call girls :8448380779 Model Escorts | 100% verified
Sector 105, Noida Call girls :8448380779 Model Escorts | 100% verified
Abortion Pills in Oman (+918133066128) Cytotec clinic buy Oman Muscat
Abortion Pills in Oman (+918133066128) Cytotec clinic buy Oman Muscat
💫✅jodhpur 24×7 BEST GENUINE PERSON LOW PRICE CALL GIRL SERVICE FULL SATISFACT...
💫✅jodhpur 24×7 BEST GENUINE PERSON LOW PRICE CALL GIRL SERVICE FULL SATISFACT...
Call Girls Basavanagudi Just Call 👗 7737669865 👗 Top Class Call Girl Service ...
Call Girls Basavanagudi Just Call 👗 7737669865 👗 Top Class Call Girl Service ...
Pooja 9892124323, Call girls Services and Mumbai Escort Service Near Hotel Gi...
Pooja 9892124323, Call girls Services and Mumbai Escort Service Near Hotel Gi...
call girls in Kaushambi (Ghaziabad) 🔝 >༒8448380779 🔝 genuine Escort Service 🔝...
call girls in Kaushambi (Ghaziabad) 🔝 >༒8448380779 🔝 genuine Escort Service 🔝...
call girls in Dakshinpuri (DELHI) 🔝 >༒9953056974 🔝 genuine Escort Service 🔝✔️✔️
call girls in Dakshinpuri (DELHI) 🔝 >༒9953056974 🔝 genuine Escort Service 🔝✔️✔️
Pooja 9892124323, Call girls Services and Mumbai Escort Service Near Hotel Hy...
Pooja 9892124323, Call girls Services and Mumbai Escort Service Near Hotel Hy...
Hire 💕 8617697112 Meerut Call Girls Service Call Girls Agency
Hire 💕 8617697112 Meerut Call Girls Service Call Girls Agency
8377087607, Door Step Call Girls In Majnu Ka Tilla (Delhi) 24/7 Available
8377087607, Door Step Call Girls In Majnu Ka Tilla (Delhi) 24/7 Available
Escorts Service Nagavara ☎ 7737669865☎ Book Your One night Stand (Bangalore)
Escorts Service Nagavara ☎ 7737669865☎ Book Your One night Stand (Bangalore)
RT Nagar Call Girls Service: 🍓 7737669865 🍓 High Profile Model Escorts | Bang...
RT Nagar Call Girls Service: 🍓 7737669865 🍓 High Profile Model Escorts | Bang...
call girls in Vasundhra (Ghaziabad) 🔝 >༒8448380779 🔝 genuine Escort Service 🔝...
call girls in Vasundhra (Ghaziabad) 🔝 >༒8448380779 🔝 genuine Escort Service 🔝...
Featured
Featured (20)
Product Design Trends in 2024 | Teenage Engineerings
Product Design Trends in 2024 | Teenage Engineerings
How Race, Age and Gender Shape Attitudes Towards Mental Health
How Race, Age and Gender Shape Attitudes Towards Mental Health
AI Trends in Creative Operations 2024 by Artwork Flow.pdf
AI Trends in Creative Operations 2024 by Artwork Flow.pdf
Content Methodology: A Best Practices Report (Webinar)
Content Methodology: A Best Practices Report (Webinar)
How to Prepare For a Successful Job Search for 2024
How to Prepare For a Successful Job Search for 2024
Social Media Marketing Trends 2024 // The Global Indie Insights
Social Media Marketing Trends 2024 // The Global Indie Insights
Trends In Paid Search: Navigating The Digital Landscape In 2024
Trends In Paid Search: Navigating The Digital Landscape In 2024
5 Public speaking tips from TED - Visualized summary
5 Public speaking tips from TED - Visualized summary
Google's Just Not That Into You: Understanding Core Updates & Search Intent
Google's Just Not That Into You: Understanding Core Updates & Search Intent
The six step guide to practical project management
The six step guide to practical project management
Beginners Guide to TikTok for Search - Rachel Pearson - We are Tilt __ Bright...
Beginners Guide to TikTok for Search - Rachel Pearson - We are Tilt __ Bright...
Using Data Visualization for Behaviour Change
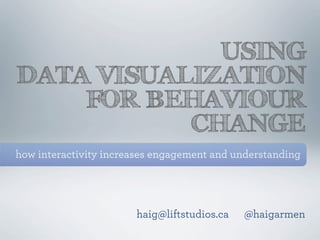
- 1. USING DATA VISUALIZATION FOR BEHAVIOUR CHANGE how interactivity increases engagement and understanding haig@liftstudios.ca @haigarmen
- 2. BUT FIRST, A BIT ABOUT ME Professor of Design Emily Carr University of Art + Design Founder & Creative Director Lift Studios - Interaction Design Agency Studied Architecture, Jazz Performance & Composition
- 5. INFO-GRAPHICS VS. DATA VISUALIZATIONS SIMPLICITY COMPLEXITY abstracted data actual quantitative data info Data graphics hand drawn programmatically generated viZ rarely interactive truly interactive MESSAGE INTERPRETATION
- 6. Named one of the best science images by the National Geographic News, Visualizing the Bible "... brings to light the interconnected nature of one of the world's most familiar books." The bar graph that runs along the bottom represents all of the chapters in the Bible. Books alternate in color between white and light gray. The length of each bar denotes the number of verses in the chapter. Each of the 63,779 cross references found in the Bible is depicted by a single arc - the color corresponds to the distance between the two chapters, creating a rainbow-like effect.
- 7. one case study: Grey Vaisius Jill Southern Brandon Visser
- 8. fg.1 fg.2 fg.3 fg.4 These are a few examples of the current hand washing campaigns that exist at Van- couver General Hospital. We used these images and campaigns as a starting point to our project, carefully considering what they did effectively, and how we could improve on the methods used [fg.1-4]
- 9. fg.12 We made several mockups in illustrator to get a better idea of the effect we wanted to achieve with the final piece, as well as to play with compositional ideas [fg.12]. The left hand page shows a few of the logo iterations we went through on our way to the final logo, we played with emphasis and ways of evoking the idea of counting. [fg.9 and 10]. Along the bottom of the the left page you see a few of our original ides fleshed out a little further in illustrator. It was at this point that we started to experiment with colour to great effect, and we began to discuss the visualization of hand sanitiza- tion in greater depth [fg. 11].
- 10. INSTALLATION Showing how our piece would be The light that would accompany the dispensers implemented in the space at vgh at the entrance, making them more appealing to use, beaconing the users.
- 14. Thank you haig@liftstudios.ca @haigarmen