SlideShare une entreprise Scribd logo
1  sur  23
Télécharger pour lire hors ligne
Exploring
     the
    VALUE
   of Casual
    Infovis
        Casual Infovis is
        non-expert users
    consuming or creating                   “the dumpster”: 20,000 breakup blogs from 2005,
                                               commissioned by the Whitney Musuem, NYC
     images created from
large amounts of information
  for the purpose of insight
      (or other purposes).

 Project Presentation: Harriet King CS 5090 – Data Visualization, December 2010
Presentation Outline
●   Review & Introduction
●   Excluded Topics
●   Diversity of Types
●   Overview of Value
●   Findings
●   Outlook for Casual Infovis
●   Concerns
●   Conclusion
●   Sources

               InformationIsBeautiful.net, David McCandless, November 2009
Review and Introduction


             “Last Clock”: video surveillance in public area capturing time and motion and mapping
                      seconds, minutes, hours, completely non-utilitarian, intended as art
●   New opportunities to explore “edge cases”:
     – art, non-expert public use, online accessibility, ambient infovis,
         education, journalism, community collaborative infovis, and more
●   Casual could be in purpose, audience, or context
●   Who has tools, data, skills? What purposes for casual infovis? What
    makes it valuable?
●   Usability and accessibility concerns are crucial in attracting non-expert
    public users
●   Casual infovis producers and consumers need to use critical thinking and
    beware false influence
Due to Time Limitations – Excluded Topics


These can be found
in the paper
●   Discussion of Casual Infovis
●   Detailed Purpose and Types of
    Casual Infovis
●   Relevance of Casual Infovis
●   Detailed Discussion of Value:
    Attributes, Accomplishing
    Purpose, Measuring Value
●   Selected Examples
                                   “tree.growth”: Tree and program code intended as art, 2006
Types of Infovis and Examples,                            page 1/3


Ambient
 ● ambient orb or Skog’s bus
   schedule

Personal data & finance
 ● Smartmoney’s Map of the Market                      Skog, Ambient Infovis of bus
 ● Digg.com’s “Stack”, “Swarm”, and                   schedule, styled after Mondrian
   “Arc” visualizations
 ● Slife (spend time)
 ● photomesa
 ● Nicholas Felton’s Annual Reports

Journalism (an entire field by itself)

World trends and education, e.g.
gapminder.org


                                         “Wealth and Health of Nations”, gapminder.org
Types of Infovis and Examples,                              page 2/3


                                Artistic work that
                                visualize information
                                 ●  “Artifacts of the
                                    Presence Era”
                                 ●  “Tableaux
                                    Machine”
                                    surveillance as art
                                 ●  Ray’s Visitor.Files:   “Tableaux Machine”: in home surveillance
                                    data gathered by        cameras using AI to report the “mood” of
                                    hand, painted strict        the home via screen art display

   Ray, “Visitor.Files”: hand
                                    mapping by hand
 gathered traffic and weather
data mapped and hand painted    A “measuring” topic,
       as visualization
                                e.g. energy use
                                (vampireenergy), diet,
                                exercise

                                Persuasive
                                visualization:
                                Persuasive Mirror          “Persuasive Mirror”: screen showing future
                                                             self, recently purchased by Accenture
Types of Infovis and Examples,                                         page 3/3

Social Visualization
& Collaboration
●   “PeopleGardens”
●   “The Dumpster”
●   “wefeelfine.org”
●   “vizster”, social network
    graph
●   “themail”                                   “wefeelfine.org”: mines for “I feel..” and visualizes in real time
●   tagging of digital artifacts
●   collaborative web
    bookmarking, e.g.
    del.icio.us
●   news, e.g. digg.com
●   public space, e.g.
    plazes.com,
    yellowarrow.org


                                   “vizster”: graph of “friendster” social network
Discussion of Value


             Van Wijk, model for infovis (left) and formula for cost benefit of infovis (right)

Value can be objectified, quantified, measured, and abstracted to fit a
variety of infovis and measured with cost benefit formulas


   Value can be
   non-utilitarian,
   subjective,
   aesthetic,
   sublime


                                          Kosara, examples of utilitarian to the sublime in infovis
Attributes & Elements
Attributes:
1. Design Principles &
   Choices
2. Objective or Subjective
3. Interaction or Not
4. Functional, Physical, &
   Qualitative Requirements
5. Individual & Social
   Aspects
Outcomes
●   Accomplishing the
    Purpose                     Van Wijk, demonstrating errors experts can make using common
                              interpolation method that caused erroneous results, a lesson learned
●   Measuring Value
Findings – Overview page 1/2
●   Casual infovis encourages
    non-expert public to be
    users and creators, but it is
    not mainstream yet
●   Value includes serving a
    purpose, solving a problem,
    being usable and
    accessible, & also the
    sublime aesthetic, building
    community, and many other
    individual values
●   Casual infovis is as
    subjectively valued as any
    other art or entertainment
                                    NY Times online visualization: 2008 county
                                          presidential elections returns
Findings – Overview page 2/2
                                                 ●   No widespread effort to create
                                                     public demand for infovis tools
                                                 ●   No clear problem for an infovis to
                                                     solve, then no incentive for the
                                                     public to be bothered with casual
                                                     infovis
                                                 ●   Wrong assumption that individuals
                                                     have piles of data, time, or problems
                                                     to solve with infovis
                                                 ●   Service industries fill the gap, e.g.
“PeopleGardens”, 1999: flower = user, height =
                                                     bank graphs & power company
number of messages posted to message board           statistics
                                                 ●   Attempts to commercialize infovis
                                                     services have recently failed, e.g.
                                                     swivel.com & verifiable.com
Findings: Outlook for Casual Infovis, 1/2
                                         ●   Analogy of photography:
                                             broaden producers,
                                             consumers, manipulation
                                             tools, develop critical
                                             thinking
                                         ●   Journalism infovis is
                                             effective in attracting the
                                             public’s interest in infovis in
                                             general and driving
                                             innovation and
                                             advancement of casual
                                             infovis
                                         ●   Popularizing casual infovis
                                             requires: free, online, easy,
                                             effective, sharing and
                                             community, import/export
                                             control, hidden technical
   Mashable.com: 2010 cell phone usage       details, choices in usability
Findings: Outlook for Casual Infovis, 2/2
                                                                  Increase exposure through:
                                                                  ●   blogs, product marketing,
                                                                      journalism
                                                                  ●   “visualati” like Hans Rosling,
                                                                      Edward Tufte, or Al Gore
                                                                  ●   social and collaborative
                                                                      visualizations
                                                                  ●   Ambient intelligence & data
                                                                      mining infovis, e.g. “Tableaux
                                                                      Machine”, “wefeelfine.org”
                                                                  ●   Information Is Power: infovis
                                                                      used to eradicate poverty, e.g.
    Anne Chappuis: “Rural Female Literacy” (India, 2001),
      vista-info.net: “We believe that the villagers, even if         rural Indian villagers infovis of
illiterate, are clever and capable of analyzing their situation       Anne Chappuis
      and planning for their future if they are provided with
       information, and specially with visual information.”
Findings: Concerns
                                       ●   Avoid abuses of casual infovis
                                            –   build a savvy public who understand that
                                                  not all infovis is legitimate
                                            –   public provide many-eyes-watching
                                                  method of checks and balances on
                                                  infovis legitimacy

                                       ●   Privacy issues, especially ambient
                                           surveillance & data mining e.g. vizster
 Fernanda Viegas, “Artifacts of the
  Presence Era: Using Information      ●   Casual infovis assumes computer literacy,
Visualization to Create an Evocative
    Souvenir”, 2003, Institute of
                                           access, and desire (no Luddites)
         Contemporary Art
                                       ●   Casual infovis is too broad, detracts from
                                           intentions of data visualization
Conclusion
●   Casual infovis is not
    mainstream
●   Value can be
    functional,
    subjective,
    accomplishing any                        Many Eyes website: movie genres from 1900 to present,
    purpose, individual                           the epitome of casual information visualized
    values, aesthetic,
    and social
    Infovis is for
                                                     Encouragement
●

    presentation and
    exploration. Letting    “Our networks are awash in data. A little of it is
    the non-expert          information. A smidgen of this shows up as
    public use it is a      knowledge. Combined with ideas, some of that is
    great idea, let’s see   actually useful. Mix in experience, context,
    what innovation         compassion, discipline, humor, tolerance, and
    arises                  humility, and perhaps knowledge becomes wisdom.”
                            Turning Numbers into Knowledge, Jonathan G. Koomey, 2001, Analytics Press: Oakland, CA page 5,
                            quoting Clifford Stoll.
37                    Resources read                                   Page 1/5

http://visualjournalism.com/too-sexy-for-its-own-good-ebb-and-flow-at-the-box-office/2009/03/29/ -
“Too sexy for its own good? Ebb and flow at the box office”, Visual Journalism
Bertini, Enrico, December 1, 2007,
http://diuf.unifr.ch/people/bertinie/visuale/2007/12/stephen_fews_vast_keynote.html

Bertini, Enrico, November 19, 2007,
http://diuf.unifr.ch/people/bertinie/visuale/2007/11/matthew_ericsons_infovis_keyno_1.html

Michael Danziger, “Information Visualization for the People” Submitted to the Program in
Comparative Media Studies on May 9, 2008 in Partial Fulfillment of the Requirements for the
Degree of Master of Science
Eagle, Nathan, Technology Review, “Mining mobile-phone data for the public good” Nathan Eagle,
MIT data mining,

http://www.technologyreview.com/tr35/Profile.aspx?TRID=802
Few, Stephen. “InfoVis as Seen by the World Out There: 2007 in Review,” IEEE Symposium on
Visual Analytics Science and Technology, 2007. Sacramento, CA. 1 Nov. 2007.
Grimwade, John, “Visualize this: is it information or is it art?”, Society for News Design (SND),
February 2nd, 2010 : http://www.snd.org/2010/02/visualize-this-is-it-info-or-is-it-art/
37                    Resources read                                     page 2/5

Heer, J. and D. Boyd. “Vizster: Visualizing Online Social Networks,” IEEE Symposium on Information
Visualization, 2005. Oct. 2005: 32-39.

H. Kienle and H. Muller, “Requirements of Software Visualization Tools: A Literature Survey,” Visualizing
Software for Understanding and Analysis, 2007. VISSOFT 2007. 4th IEEE International Workshop on,
2007, pp. 2-9. [requirements for research tools that target the domains of visualization for software
maintenance, reengineering, and reverse engineering. Put into the attributes section of paper]

 Kosara, Robert, “The Visualization Cargo Cult”, Robert Kosara; April 7, 2010,
http://eagereyes.org/criticism/the-visualization-cargo-cult

 Kosara, Robert, “Visualization Can Never Be Art”, May 3, 2010,
http://eagereyes.org/criticism/visualization-can-never-be-art

Kosara , Robert Kosara; November 24, 2007, http://eagereyes.org/blog/infovis-2007-infovis-for-the-
masses.html

R. Kosara, “Visualization criticism ― the missing link between information visualization and art,” IN
PROCEEDINGS OF THE 11TH INTERNATIONAL CONFERENCE ON INFORMATION VISUALISATION
(IV, 2007, pp. 631 - 636)

Kosara, Robert, “The Rise and Fall of Swivel.com”, 10/12/2010,
http://eagereyes.org/criticism/the-rise-and-fall-of-swivel
37                    Resources read                                  page 3/5

Kosara, Robert, “The End of Verifiable.com”, 6/10/2010, http://eagereyes.org/blog/2010/end-of-
verifiable-com
B. Lorensen, “On the Death of Visualization: Can It Survive Without Customers?” NIH/NSF Fall
2004 Workshop on Visualization Research Challenges, 2004.

Geoff McGee, “Journalism in the Age of Data”, A video report on data visualization as a storytelling
medium, Produced during a 2009-2010 Knight Journalism Fellowship.
http://datajournalism.stanford.edu/.

M. Ogawa and Kwan-Liu Ma, “code_swarm: A Design Study in Organic Software Visualization,”
Visualization and Computer Graphics, IEEE Transactions on, vol. 15, 2009, pp. 1097-1104.

Plaisant, Catherine. “The Challenge of Information Visualization Evaluation,” Proceedings of the
Working Conference on Advanced Visual Interfaces. 2004: 109-116.

Z. Pousman, J. Stasko, and M. Mateas, “Casual Information Visualization: Depictions of Data in
Everyday Life,” Visualization and Computer Graphics, IEEE Transactions on, vol. 13, 2007, pp.
1145-1152.

M. Romero and M. Mateas. A preliminary investigation of alien presence. In Proceedings of HCII
2005, 2005. [pousman’s 30- tableaux, perceived mood of the house as painting]
37                     Resources read                                    page 4/5

T. Skog, S. Ljunglblad, and L. E. Holmquist. Between aesthetics and utility: Designing ambient
information visualization. In Proceedings of IEEE Infovis, pages 233–240, 2003. [32 in pousman]

D. Sprague and M. Tory, “Motivation and Procrastination: Methods for Evaluating Pragmatic Casual
Information Visualizations,” Computer Graphics and Applications, IEEE, vol. 29, 2009, pp. 86-91.

Stasko, John, Information Interfaces, “InfoCanvas: Information Art”,
http://www.cc.gatech.edu/gvu/ii/about.html

M. Tory and T. Moller, “Human factors in visualization research,” Visualization and Computer Graphics,
IEEE Transactions on, vol. 10, 2004, pp. 72-84.

Tufte, Edward, “Beautiful Evidence” Chapter: “Principles of Analytical Design” (2006)

J.J. Van Wijk, “The Value of Visualization,” vol. 12, 2005, pp. 79―86.

J. van Wijk, “Views on Visualization,” Visualization and Computer Graphics, IEEE Transactions on, vol.
12, 2006, pp. 1000-433.

A.B. Viégas, M. Wattenberg, F. Van Ham, J. Kriss, and M. Mckeon, “Many eyes: A site for visualization
at internet scale,” PROCEEDINGS OF INFOVIS, 2007.

F. Viegas, S. Golder, and J. Donath. Visualizing email content: Portraying relationships from
conversational histories. In Proceedings of CHI, New York, NY, USA, 2006. ACM Press. c 2006 ACM,
Inc. Reproduced by permission. [39 in pousman]
37                     Resources read                                     page 5/5

F. Viegas, M. Wattenberg, and J. Feinberg, “Participatory Visualization with Wordle,” Visualization and
Computer Graphics, IEEE Transactions on, vol. 15, 2009, pp. 1137-1144.

Viegas, F.B.; Perry, E.; Howe, E.; Donath, J.; , "Artifacts of the Presence Era: Using Information
Visualization to Create an Evocative Souvenir," Information Visualization, 2004. INFOVIS 2004. IEEE
Symposium on , vol., no., pp.105-111, 0-0 0 doi: 10.1109/INFVIS.2004.8,
URL: http://ieeexplore.ieee.org/stamp/stamp.jsp?tp=&arnumber=1382897&isnumber=30135

F. Viegas and M. Wattenberg. Artistic data visualization: Beyond visual analytics. In Proceedings of HCII
2007 (in press), July 2007.

M. Wattenberg and J. Kriss, “Designing for social data analysis,” Visualization and Computer Graphics,
IEEE Transactions on, vol. 12, 2006, pp. 549-557.

S. Wipfli and C. Schneider, “The Sensitive Tapestry: Built Architecture as a Platform for Information
Visualization and Interaction,” Information Visualisation, 2009 13th International Conference, 2009, pp.
486-489.

 R. Xiong and J. Donath. Peoplegarden: creating data portraits for users. In Proceedings of UIST
(Symposium on User interface software and technology), pages 37–44, New York, NY, USA, 1999. ACM
Press. c 1999 ACM, Inc. Reproduced by permission.

J.S. Yi, Y. Kang, J.T. Stasko, and J.A. Jacko, “Understanding and characterizing insights: how do people
gain insights using information visualization?,” Proceedings of the 2008 conference on Beyond time and
errors: novel evaluation methods for Information Visualization, Florence, Italy: ACM, 2008, pp. 1-6.
28           A few websites             page 1/2


                       http://www.informationisbeautiful.net/
                              http://vizlab.nytimes.com/
       http://mashable.com/2010/12/03/cell-phone-mobile-infographic/
                          http://www.huffingtonpost.com/
                    http://www.cs.umd.edu/hcil/photomesa/
                              http://www.slifeweb.com/
                http://www.youtube.com/watch?v=zgZfry82LC4
                             http://www.gapminder.org/
                               http://r-s-g.org/carnivore/
                                http://blog.blprnt.com/
                               http://www.swivel.com/
          http://www-958.ibm.com/software/data/cognos/manyeyes/
                    http://www.vista-info.net/pages/home.html
http://www.youtube.com/watch?v=jbkSRLYSojo&feature=player_embedded

  http://alumni.media.mit.edu/~fviegas/projects/themail/study/index.htm
                http://alumni.media.mit.edu/~fviegas/ICA/
28           A few websites             page 2/2


                             http://www.delicious.com/
                              http://www.daytum.com/
   http://www.informationisbeautiful.net/2009/interesting-easy-beautiful-true/
                      http://reality.media.mit.edu/viz.php
                               http://www.wordle.net/
                      http://www.nullsoft.com/free/milkdrop/.
            __DdeLink__1415_864627515http://www.wefeelfine.org/.
                    http://hci.stanford.edu/jheer/projects/vizster/
                                http://eagereyes.org/
             http://artport.whitney.org/commissions/thedumpster/
http://www.ted.com/talks/hans_rosling_shows_the_best_stats_you_ve_ever_s
                                        een.html
                     http://www.sics.se/fal/projects/infoart/
Thank you. Questions?
                                     Contact hcking@mtu.edu
                                   to access the complete paper


          Casual Infovis Examples: Two Wordles
Original Proposal (left) compared to the Final Report (right)

Contenu connexe

Similaire à Exploring the VALUE of Casual Infovis

Application UI Design with Large Data Sets (Cathy Lu)
Application UI Design with Large Data Sets (Cathy Lu)Application UI Design with Large Data Sets (Cathy Lu)
Application UI Design with Large Data Sets (Cathy Lu)uxpa-dc
 
Towards user co-creation of value on the Internet-of-Things (IoT)
Towards user co-creation of value on the Internet-of-Things (IoT)Towards user co-creation of value on the Internet-of-Things (IoT)
Towards user co-creation of value on the Internet-of-Things (IoT)trappenl
 
Fallon Brainfood x VCU Brandcenter: The Engagement Opportunity
Fallon Brainfood x VCU Brandcenter: The Engagement OpportunityFallon Brainfood x VCU Brandcenter: The Engagement Opportunity
Fallon Brainfood x VCU Brandcenter: The Engagement OpportunityAki Spicer
 
Using Web Analytics
Using Web AnalyticsUsing Web Analytics
Using Web AnalyticsDana Chinn
 
Picture This © data visualisation platform by And Then
Picture This © data visualisation platform by And ThenPicture This © data visualisation platform by And Then
Picture This © data visualisation platform by And Thenvikram sood
 
3of3 ‘Visual Storytelling’ to Communicate Sustainability
3of3 ‘Visual Storytelling’ to Communicate Sustainability3of3 ‘Visual Storytelling’ to Communicate Sustainability
3of3 ‘Visual Storytelling’ to Communicate SustainabilityArlene Birt
 
Infographics overview e&e 20120608_final
Infographics overview e&e 20120608_finalInfographics overview e&e 20120608_final
Infographics overview e&e 20120608_finalJason Jercinovic
 
Co-Creation & Co-Creativity - innovating together with end-users on-line and ...
Co-Creation & Co-Creativity - innovating together with end-users on-line and ...Co-Creation & Co-Creativity - innovating together with end-users on-line and ...
Co-Creation & Co-Creativity - innovating together with end-users on-line and ...Liliane Kuiper-Hoyng
 
Basics of Interaction Design & Strategy - 4/11/15
Basics of Interaction Design & Strategy - 4/11/15Basics of Interaction Design & Strategy - 4/11/15
Basics of Interaction Design & Strategy - 4/11/15Robert Stribley
 
Designing Learning in the Digital Age - Analysing_your_organisations_digit…
Designing Learning in the Digital Age - Analysing_your_organisations_digit…Designing Learning in the Digital Age - Analysing_your_organisations_digit…
Designing Learning in the Digital Age - Analysing_your_organisations_digit…Vanguard Visions
 
Knudsen sandvik challenging-smart-in-smartcity-strategies
Knudsen sandvik challenging-smart-in-smartcity-strategiesKnudsen sandvik challenging-smart-in-smartcity-strategies
Knudsen sandvik challenging-smart-in-smartcity-strategiesKjetil Sandvik
 
"Creating user-centered websites that drive results" by Savage at the HiMA IS...
"Creating user-centered websites that drive results" by Savage at the HiMA IS..."Creating user-centered websites that drive results" by Savage at the HiMA IS...
"Creating user-centered websites that drive results" by Savage at the HiMA IS...Robin Tooms
 
New roles and new skills for km (isko)
New roles and new skills for km (isko)New roles and new skills for km (isko)
New roles and new skills for km (isko)Collabor8now Ltd
 
The Virtual Future of Business Administration PhD Education
The Virtual Future of Business Administration PhD EducationThe Virtual Future of Business Administration PhD Education
The Virtual Future of Business Administration PhD EducationRobin Teigland
 
Basics of Interaction Design & Strategy - 6/12/15
Basics of Interaction Design & Strategy - 6/12/15Basics of Interaction Design & Strategy - 6/12/15
Basics of Interaction Design & Strategy - 6/12/15Robert Stribley
 
UofC Digital Marketing Lecture 3
UofC Digital Marketing Lecture 3UofC Digital Marketing Lecture 3
UofC Digital Marketing Lecture 3John Hutchings
 
Introduction to User Experience Design 06/22/19
Introduction to User Experience Design 06/22/19Introduction to User Experience Design 06/22/19
Introduction to User Experience Design 06/22/19Robert Stribley
 
Introduction to User Experience Design 12/07/19
Introduction to User Experience Design 12/07/19Introduction to User Experience Design 12/07/19
Introduction to User Experience Design 12/07/19Robert Stribley
 
SocialThinkers_Credential_english
SocialThinkers_Credential_englishSocialThinkers_Credential_english
SocialThinkers_Credential_englishJörg Zabel
 
Introduction to User Experience Design 10/05/19
Introduction to User Experience Design 10/05/19Introduction to User Experience Design 10/05/19
Introduction to User Experience Design 10/05/19Robert Stribley
 

Similaire à Exploring the VALUE of Casual Infovis (20)

Application UI Design with Large Data Sets (Cathy Lu)
Application UI Design with Large Data Sets (Cathy Lu)Application UI Design with Large Data Sets (Cathy Lu)
Application UI Design with Large Data Sets (Cathy Lu)
 
Towards user co-creation of value on the Internet-of-Things (IoT)
Towards user co-creation of value on the Internet-of-Things (IoT)Towards user co-creation of value on the Internet-of-Things (IoT)
Towards user co-creation of value on the Internet-of-Things (IoT)
 
Fallon Brainfood x VCU Brandcenter: The Engagement Opportunity
Fallon Brainfood x VCU Brandcenter: The Engagement OpportunityFallon Brainfood x VCU Brandcenter: The Engagement Opportunity
Fallon Brainfood x VCU Brandcenter: The Engagement Opportunity
 
Using Web Analytics
Using Web AnalyticsUsing Web Analytics
Using Web Analytics
 
Picture This © data visualisation platform by And Then
Picture This © data visualisation platform by And ThenPicture This © data visualisation platform by And Then
Picture This © data visualisation platform by And Then
 
3of3 ‘Visual Storytelling’ to Communicate Sustainability
3of3 ‘Visual Storytelling’ to Communicate Sustainability3of3 ‘Visual Storytelling’ to Communicate Sustainability
3of3 ‘Visual Storytelling’ to Communicate Sustainability
 
Infographics overview e&e 20120608_final
Infographics overview e&e 20120608_finalInfographics overview e&e 20120608_final
Infographics overview e&e 20120608_final
 
Co-Creation & Co-Creativity - innovating together with end-users on-line and ...
Co-Creation & Co-Creativity - innovating together with end-users on-line and ...Co-Creation & Co-Creativity - innovating together with end-users on-line and ...
Co-Creation & Co-Creativity - innovating together with end-users on-line and ...
 
Basics of Interaction Design & Strategy - 4/11/15
Basics of Interaction Design & Strategy - 4/11/15Basics of Interaction Design & Strategy - 4/11/15
Basics of Interaction Design & Strategy - 4/11/15
 
Designing Learning in the Digital Age - Analysing_your_organisations_digit…
Designing Learning in the Digital Age - Analysing_your_organisations_digit…Designing Learning in the Digital Age - Analysing_your_organisations_digit…
Designing Learning in the Digital Age - Analysing_your_organisations_digit…
 
Knudsen sandvik challenging-smart-in-smartcity-strategies
Knudsen sandvik challenging-smart-in-smartcity-strategiesKnudsen sandvik challenging-smart-in-smartcity-strategies
Knudsen sandvik challenging-smart-in-smartcity-strategies
 
"Creating user-centered websites that drive results" by Savage at the HiMA IS...
"Creating user-centered websites that drive results" by Savage at the HiMA IS..."Creating user-centered websites that drive results" by Savage at the HiMA IS...
"Creating user-centered websites that drive results" by Savage at the HiMA IS...
 
New roles and new skills for km (isko)
New roles and new skills for km (isko)New roles and new skills for km (isko)
New roles and new skills for km (isko)
 
The Virtual Future of Business Administration PhD Education
The Virtual Future of Business Administration PhD EducationThe Virtual Future of Business Administration PhD Education
The Virtual Future of Business Administration PhD Education
 
Basics of Interaction Design & Strategy - 6/12/15
Basics of Interaction Design & Strategy - 6/12/15Basics of Interaction Design & Strategy - 6/12/15
Basics of Interaction Design & Strategy - 6/12/15
 
UofC Digital Marketing Lecture 3
UofC Digital Marketing Lecture 3UofC Digital Marketing Lecture 3
UofC Digital Marketing Lecture 3
 
Introduction to User Experience Design 06/22/19
Introduction to User Experience Design 06/22/19Introduction to User Experience Design 06/22/19
Introduction to User Experience Design 06/22/19
 
Introduction to User Experience Design 12/07/19
Introduction to User Experience Design 12/07/19Introduction to User Experience Design 12/07/19
Introduction to User Experience Design 12/07/19
 
SocialThinkers_Credential_english
SocialThinkers_Credential_englishSocialThinkers_Credential_english
SocialThinkers_Credential_english
 
Introduction to User Experience Design 10/05/19
Introduction to User Experience Design 10/05/19Introduction to User Experience Design 10/05/19
Introduction to User Experience Design 10/05/19
 

Exploring the VALUE of Casual Infovis

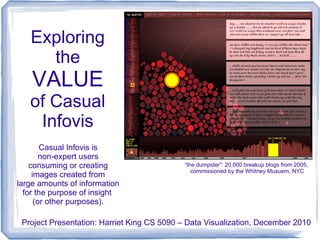
  • 1. Exploring the VALUE of Casual Infovis Casual Infovis is non-expert users consuming or creating “the dumpster”: 20,000 breakup blogs from 2005, commissioned by the Whitney Musuem, NYC images created from large amounts of information for the purpose of insight (or other purposes). Project Presentation: Harriet King CS 5090 – Data Visualization, December 2010
  • 2. Presentation Outline ● Review & Introduction ● Excluded Topics ● Diversity of Types ● Overview of Value ● Findings ● Outlook for Casual Infovis ● Concerns ● Conclusion ● Sources InformationIsBeautiful.net, David McCandless, November 2009
  • 3. Review and Introduction “Last Clock”: video surveillance in public area capturing time and motion and mapping seconds, minutes, hours, completely non-utilitarian, intended as art ● New opportunities to explore “edge cases”: – art, non-expert public use, online accessibility, ambient infovis, education, journalism, community collaborative infovis, and more ● Casual could be in purpose, audience, or context ● Who has tools, data, skills? What purposes for casual infovis? What makes it valuable? ● Usability and accessibility concerns are crucial in attracting non-expert public users ● Casual infovis producers and consumers need to use critical thinking and beware false influence
  • 4. Due to Time Limitations – Excluded Topics These can be found in the paper ● Discussion of Casual Infovis ● Detailed Purpose and Types of Casual Infovis ● Relevance of Casual Infovis ● Detailed Discussion of Value: Attributes, Accomplishing Purpose, Measuring Value ● Selected Examples “tree.growth”: Tree and program code intended as art, 2006
  • 5. Types of Infovis and Examples, page 1/3 Ambient ● ambient orb or Skog’s bus schedule Personal data & finance ● Smartmoney’s Map of the Market Skog, Ambient Infovis of bus ● Digg.com’s “Stack”, “Swarm”, and schedule, styled after Mondrian “Arc” visualizations ● Slife (spend time) ● photomesa ● Nicholas Felton’s Annual Reports Journalism (an entire field by itself) World trends and education, e.g. gapminder.org “Wealth and Health of Nations”, gapminder.org
  • 6. Types of Infovis and Examples, page 2/3 Artistic work that visualize information ● “Artifacts of the Presence Era” ● “Tableaux Machine” surveillance as art ● Ray’s Visitor.Files: “Tableaux Machine”: in home surveillance data gathered by cameras using AI to report the “mood” of hand, painted strict the home via screen art display Ray, “Visitor.Files”: hand mapping by hand gathered traffic and weather data mapped and hand painted A “measuring” topic, as visualization e.g. energy use (vampireenergy), diet, exercise Persuasive visualization: Persuasive Mirror “Persuasive Mirror”: screen showing future self, recently purchased by Accenture
  • 7. Types of Infovis and Examples, page 3/3 Social Visualization & Collaboration ● “PeopleGardens” ● “The Dumpster” ● “wefeelfine.org” ● “vizster”, social network graph ● “themail” “wefeelfine.org”: mines for “I feel..” and visualizes in real time ● tagging of digital artifacts ● collaborative web bookmarking, e.g. del.icio.us ● news, e.g. digg.com ● public space, e.g. plazes.com, yellowarrow.org “vizster”: graph of “friendster” social network
  • 8. Discussion of Value Van Wijk, model for infovis (left) and formula for cost benefit of infovis (right) Value can be objectified, quantified, measured, and abstracted to fit a variety of infovis and measured with cost benefit formulas Value can be non-utilitarian, subjective, aesthetic, sublime Kosara, examples of utilitarian to the sublime in infovis
  • 9. Attributes & Elements Attributes: 1. Design Principles & Choices 2. Objective or Subjective 3. Interaction or Not 4. Functional, Physical, & Qualitative Requirements 5. Individual & Social Aspects Outcomes ● Accomplishing the Purpose Van Wijk, demonstrating errors experts can make using common interpolation method that caused erroneous results, a lesson learned ● Measuring Value
  • 10. Findings – Overview page 1/2 ● Casual infovis encourages non-expert public to be users and creators, but it is not mainstream yet ● Value includes serving a purpose, solving a problem, being usable and accessible, & also the sublime aesthetic, building community, and many other individual values ● Casual infovis is as subjectively valued as any other art or entertainment NY Times online visualization: 2008 county presidential elections returns
  • 11. Findings – Overview page 2/2 ● No widespread effort to create public demand for infovis tools ● No clear problem for an infovis to solve, then no incentive for the public to be bothered with casual infovis ● Wrong assumption that individuals have piles of data, time, or problems to solve with infovis ● Service industries fill the gap, e.g. “PeopleGardens”, 1999: flower = user, height = bank graphs & power company number of messages posted to message board statistics ● Attempts to commercialize infovis services have recently failed, e.g. swivel.com & verifiable.com
  • 12. Findings: Outlook for Casual Infovis, 1/2 ● Analogy of photography: broaden producers, consumers, manipulation tools, develop critical thinking ● Journalism infovis is effective in attracting the public’s interest in infovis in general and driving innovation and advancement of casual infovis ● Popularizing casual infovis requires: free, online, easy, effective, sharing and community, import/export control, hidden technical Mashable.com: 2010 cell phone usage details, choices in usability
  • 13. Findings: Outlook for Casual Infovis, 2/2 Increase exposure through: ● blogs, product marketing, journalism ● “visualati” like Hans Rosling, Edward Tufte, or Al Gore ● social and collaborative visualizations ● Ambient intelligence & data mining infovis, e.g. “Tableaux Machine”, “wefeelfine.org” ● Information Is Power: infovis used to eradicate poverty, e.g. Anne Chappuis: “Rural Female Literacy” (India, 2001), vista-info.net: “We believe that the villagers, even if rural Indian villagers infovis of illiterate, are clever and capable of analyzing their situation Anne Chappuis and planning for their future if they are provided with information, and specially with visual information.”
  • 14. Findings: Concerns ● Avoid abuses of casual infovis – build a savvy public who understand that not all infovis is legitimate – public provide many-eyes-watching method of checks and balances on infovis legitimacy ● Privacy issues, especially ambient surveillance & data mining e.g. vizster Fernanda Viegas, “Artifacts of the Presence Era: Using Information ● Casual infovis assumes computer literacy, Visualization to Create an Evocative Souvenir”, 2003, Institute of access, and desire (no Luddites) Contemporary Art ● Casual infovis is too broad, detracts from intentions of data visualization
  • 15. Conclusion ● Casual infovis is not mainstream ● Value can be functional, subjective, accomplishing any Many Eyes website: movie genres from 1900 to present, purpose, individual the epitome of casual information visualized values, aesthetic, and social Infovis is for Encouragement ● presentation and exploration. Letting “Our networks are awash in data. A little of it is the non-expert information. A smidgen of this shows up as public use it is a knowledge. Combined with ideas, some of that is great idea, let’s see actually useful. Mix in experience, context, what innovation compassion, discipline, humor, tolerance, and arises humility, and perhaps knowledge becomes wisdom.” Turning Numbers into Knowledge, Jonathan G. Koomey, 2001, Analytics Press: Oakland, CA page 5, quoting Clifford Stoll.
  • 16. 37 Resources read Page 1/5 http://visualjournalism.com/too-sexy-for-its-own-good-ebb-and-flow-at-the-box-office/2009/03/29/ - “Too sexy for its own good? Ebb and flow at the box office”, Visual Journalism Bertini, Enrico, December 1, 2007, http://diuf.unifr.ch/people/bertinie/visuale/2007/12/stephen_fews_vast_keynote.html Bertini, Enrico, November 19, 2007, http://diuf.unifr.ch/people/bertinie/visuale/2007/11/matthew_ericsons_infovis_keyno_1.html Michael Danziger, “Information Visualization for the People” Submitted to the Program in Comparative Media Studies on May 9, 2008 in Partial Fulfillment of the Requirements for the Degree of Master of Science Eagle, Nathan, Technology Review, “Mining mobile-phone data for the public good” Nathan Eagle, MIT data mining, http://www.technologyreview.com/tr35/Profile.aspx?TRID=802 Few, Stephen. “InfoVis as Seen by the World Out There: 2007 in Review,” IEEE Symposium on Visual Analytics Science and Technology, 2007. Sacramento, CA. 1 Nov. 2007. Grimwade, John, “Visualize this: is it information or is it art?”, Society for News Design (SND), February 2nd, 2010 : http://www.snd.org/2010/02/visualize-this-is-it-info-or-is-it-art/
  • 17. 37 Resources read page 2/5 Heer, J. and D. Boyd. “Vizster: Visualizing Online Social Networks,” IEEE Symposium on Information Visualization, 2005. Oct. 2005: 32-39. H. Kienle and H. Muller, “Requirements of Software Visualization Tools: A Literature Survey,” Visualizing Software for Understanding and Analysis, 2007. VISSOFT 2007. 4th IEEE International Workshop on, 2007, pp. 2-9. [requirements for research tools that target the domains of visualization for software maintenance, reengineering, and reverse engineering. Put into the attributes section of paper] Kosara, Robert, “The Visualization Cargo Cult”, Robert Kosara; April 7, 2010, http://eagereyes.org/criticism/the-visualization-cargo-cult Kosara, Robert, “Visualization Can Never Be Art”, May 3, 2010, http://eagereyes.org/criticism/visualization-can-never-be-art Kosara , Robert Kosara; November 24, 2007, http://eagereyes.org/blog/infovis-2007-infovis-for-the- masses.html R. Kosara, “Visualization criticism ― the missing link between information visualization and art,” IN PROCEEDINGS OF THE 11TH INTERNATIONAL CONFERENCE ON INFORMATION VISUALISATION (IV, 2007, pp. 631 - 636) Kosara, Robert, “The Rise and Fall of Swivel.com”, 10/12/2010, http://eagereyes.org/criticism/the-rise-and-fall-of-swivel
  • 18. 37 Resources read page 3/5 Kosara, Robert, “The End of Verifiable.com”, 6/10/2010, http://eagereyes.org/blog/2010/end-of- verifiable-com B. Lorensen, “On the Death of Visualization: Can It Survive Without Customers?” NIH/NSF Fall 2004 Workshop on Visualization Research Challenges, 2004. Geoff McGee, “Journalism in the Age of Data”, A video report on data visualization as a storytelling medium, Produced during a 2009-2010 Knight Journalism Fellowship. http://datajournalism.stanford.edu/. M. Ogawa and Kwan-Liu Ma, “code_swarm: A Design Study in Organic Software Visualization,” Visualization and Computer Graphics, IEEE Transactions on, vol. 15, 2009, pp. 1097-1104. Plaisant, Catherine. “The Challenge of Information Visualization Evaluation,” Proceedings of the Working Conference on Advanced Visual Interfaces. 2004: 109-116. Z. Pousman, J. Stasko, and M. Mateas, “Casual Information Visualization: Depictions of Data in Everyday Life,” Visualization and Computer Graphics, IEEE Transactions on, vol. 13, 2007, pp. 1145-1152. M. Romero and M. Mateas. A preliminary investigation of alien presence. In Proceedings of HCII 2005, 2005. [pousman’s 30- tableaux, perceived mood of the house as painting]
  • 19. 37 Resources read page 4/5 T. Skog, S. Ljunglblad, and L. E. Holmquist. Between aesthetics and utility: Designing ambient information visualization. In Proceedings of IEEE Infovis, pages 233–240, 2003. [32 in pousman] D. Sprague and M. Tory, “Motivation and Procrastination: Methods for Evaluating Pragmatic Casual Information Visualizations,” Computer Graphics and Applications, IEEE, vol. 29, 2009, pp. 86-91. Stasko, John, Information Interfaces, “InfoCanvas: Information Art”, http://www.cc.gatech.edu/gvu/ii/about.html M. Tory and T. Moller, “Human factors in visualization research,” Visualization and Computer Graphics, IEEE Transactions on, vol. 10, 2004, pp. 72-84. Tufte, Edward, “Beautiful Evidence” Chapter: “Principles of Analytical Design” (2006) J.J. Van Wijk, “The Value of Visualization,” vol. 12, 2005, pp. 79―86. J. van Wijk, “Views on Visualization,” Visualization and Computer Graphics, IEEE Transactions on, vol. 12, 2006, pp. 1000-433. A.B. Viégas, M. Wattenberg, F. Van Ham, J. Kriss, and M. Mckeon, “Many eyes: A site for visualization at internet scale,” PROCEEDINGS OF INFOVIS, 2007. F. Viegas, S. Golder, and J. Donath. Visualizing email content: Portraying relationships from conversational histories. In Proceedings of CHI, New York, NY, USA, 2006. ACM Press. c 2006 ACM, Inc. Reproduced by permission. [39 in pousman]
  • 20. 37 Resources read page 5/5 F. Viegas, M. Wattenberg, and J. Feinberg, “Participatory Visualization with Wordle,” Visualization and Computer Graphics, IEEE Transactions on, vol. 15, 2009, pp. 1137-1144. Viegas, F.B.; Perry, E.; Howe, E.; Donath, J.; , "Artifacts of the Presence Era: Using Information Visualization to Create an Evocative Souvenir," Information Visualization, 2004. INFOVIS 2004. IEEE Symposium on , vol., no., pp.105-111, 0-0 0 doi: 10.1109/INFVIS.2004.8, URL: http://ieeexplore.ieee.org/stamp/stamp.jsp?tp=&arnumber=1382897&isnumber=30135 F. Viegas and M. Wattenberg. Artistic data visualization: Beyond visual analytics. In Proceedings of HCII 2007 (in press), July 2007. M. Wattenberg and J. Kriss, “Designing for social data analysis,” Visualization and Computer Graphics, IEEE Transactions on, vol. 12, 2006, pp. 549-557. S. Wipfli and C. Schneider, “The Sensitive Tapestry: Built Architecture as a Platform for Information Visualization and Interaction,” Information Visualisation, 2009 13th International Conference, 2009, pp. 486-489. R. Xiong and J. Donath. Peoplegarden: creating data portraits for users. In Proceedings of UIST (Symposium on User interface software and technology), pages 37–44, New York, NY, USA, 1999. ACM Press. c 1999 ACM, Inc. Reproduced by permission. J.S. Yi, Y. Kang, J.T. Stasko, and J.A. Jacko, “Understanding and characterizing insights: how do people gain insights using information visualization?,” Proceedings of the 2008 conference on Beyond time and errors: novel evaluation methods for Information Visualization, Florence, Italy: ACM, 2008, pp. 1-6.
  • 21. 28 A few websites page 1/2 http://www.informationisbeautiful.net/ http://vizlab.nytimes.com/ http://mashable.com/2010/12/03/cell-phone-mobile-infographic/ http://www.huffingtonpost.com/ http://www.cs.umd.edu/hcil/photomesa/ http://www.slifeweb.com/ http://www.youtube.com/watch?v=zgZfry82LC4 http://www.gapminder.org/ http://r-s-g.org/carnivore/ http://blog.blprnt.com/ http://www.swivel.com/ http://www-958.ibm.com/software/data/cognos/manyeyes/ http://www.vista-info.net/pages/home.html http://www.youtube.com/watch?v=jbkSRLYSojo&feature=player_embedded http://alumni.media.mit.edu/~fviegas/projects/themail/study/index.htm http://alumni.media.mit.edu/~fviegas/ICA/
  • 22. 28 A few websites page 2/2 http://www.delicious.com/ http://www.daytum.com/ http://www.informationisbeautiful.net/2009/interesting-easy-beautiful-true/ http://reality.media.mit.edu/viz.php http://www.wordle.net/ http://www.nullsoft.com/free/milkdrop/. __DdeLink__1415_864627515http://www.wefeelfine.org/. http://hci.stanford.edu/jheer/projects/vizster/ http://eagereyes.org/ http://artport.whitney.org/commissions/thedumpster/ http://www.ted.com/talks/hans_rosling_shows_the_best_stats_you_ve_ever_s een.html http://www.sics.se/fal/projects/infoart/
  • 23. Thank you. Questions? Contact hcking@mtu.edu to access the complete paper Casual Infovis Examples: Two Wordles Original Proposal (left) compared to the Final Report (right)