HepG2 cell model for steatosis and phospholipidosis assessment
•
1 j'aime•933 vues

Early detection of toxic events induced by drug cantidats is mandatory in order to avoid late attrition in the process of R&D. Steatosis is an accumulation of triglicerids within the liver cells and may lead steatohepatiitis. Phospholipidosis is a disruption of the phospholipidases activity, either by direct inhibition or through drug-phospholipid complexes that cannot be broken by them, leading to intracellular phospholipid accumulation. Although not a toxic event by itself, phospholipidosis predict drug and metabolite accumulation that may provoke toxicity within the liver or kidney for example. Drug induced steatosis and phospholipidosis can be quantified by High Content Screening.
Recommandé

Recommandé
Contenu connexe
Plus de HCS Pharma
Plus de HCS Pharma (20)
Dernier
Dernier (20)
HepG2 cell model for steatosis and phospholipidosis assessment
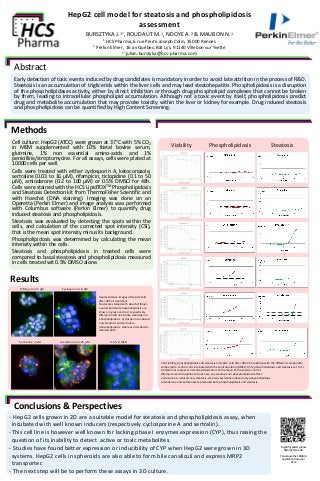
- 1. HepG2 cell model for steatosis and phospholipidosis assessment BURSZTYKA J.1*, ROUDAUT M.1, NDOYE A.2 & MAUBON N.1 1 HCS Pharma, 6 rue Pierre Joseph Colin, 35000 Rennes 2 Perkin Elmer , 16 av Québec, Bât Lys, 91140 Villebon sur Yvette 1*julian.burstyka@hcs-pharma.com Abstract Early detection of toxic events induced by drug candidates is mandatory in order to avoid late attrition in the process of R&D. Steatosis is an accumulation of triglicerids within the liver cells and may lead steatohepatitis. Phospholipidosis is a disruption of the phospholipidases activity, either by direct inhibition or through drug-phospholipid complexes that cannot be broken by them, leading to intracellular phospholipid accumulation. Although not a toxic event by itself, phospholipidosis predict drug and metabolite accumulation that may provoke toxicity within the liver or kidney for example. Drug induced steatosis and phospholipidosis can be quantified by High Content Screening. Results Methods Conclusions & Perspectives - HepG2 cells grown in 2D are a suitable model for steatosis and phospholipidosis assay, when incubated with well known inducers (respectively cyclosporine A and sertralin). - This cell line is however well known for lacking phase I enzymes expression (CYP), thus raising the question of its inability to detect active or toxic metabolites. - Studies have found better expression or inducibility of CYP when HepG2 were grown in 3D systems. HepG2 cells in spheroids are also able to form bile canaliculi and express MRP2 transporter. - The next step will be to perform these assays in 3D culture. Cell culture: HepG2 (ATCC) were grown at 37°C with 5% CO2 in MEM supplemented with 10% fœtal bovine serum, glutmine, 1% non essential amino-acids and 1% penicilline/streptomycine. For all assays, cells were plated at 10000 cells per well. Cells were treated with either cyclosporin A, ketoconazole, sertraline (0.03 to 16 µM), rifampicin, ticlopidine (0.1 to 50 µM), amiodarone (0.2 to 100 µM) or 0.5% DMSO for 48h. Cells were stained with the HCS LipidTOXTM Phospholipidosis and Steatosis Detection kit from ThermoFisher Scientific and with Hoechst (DNA staining). Imaging was done on an Operetta (Perkin Elmer) and image analysis was performed with Columbus software (Perkin Elmer) to quantify drug induced steatosis and phospholipidosis. Steatosis was evaluated by detecting the spots within the cells, and calculation of the corrected spot intensity (CSI), that is the mean spot intensity minus its background. Phospholipidosis was determined by calculating the mean intensity within the cells. Steatosis and phospholipidosis in treated cells were compared to basal steatosis and phospholipidosis measured in cells treated wit 0.5% DMSO alone. Representative images of HepG2 cells after 48h of treatment Nuclei are stained with Hoechst (blue), neutral lipid and phospholipidosis are shown in green and red, respectively. Rifampicin did not induce steatosis nor phospholipidosis. Cyclosporin A induced only steatosis and sertraline phospholipidosis, whereas Amiodarone induced both. Cell viability, phospholipidosis and steatosis in HepG2 cells after 48h of incubation with the different compounds, compared to control cells incubated with the vehicule alone (DMSO 0.5%, phospholipidosis and steatosis set to 1). Dotted lines represent 3 standard deviations of the mean of the vehicle control. Rifampicin and ticlopidine did not have any steatosis nor phospholipidosis effect. Cyclosporin A induced only steatosis, whereas Sertraline induced only phospholipidosis. Amiodarone and ketoconazole produced both phospholipidosis and steatosis. To get this poster, please flash the QR-code. You can use the I-NIGMA application from your store Viability Rifampicin 25 µM Cyclosporin A 8 µM Sertraline 2 µM Amiodarone 6.25 µM 0.5 % DMSO Phospholipidosis Steatosis