SlideShare une entreprise Scribd logo
1  sur  81
1-INTRODUCTION:
       Among all the innovations that have flooded the international financial markets,
financial derivatives occupy the driver's seat. These specialized instruments facilitate the
shuffling and redistribution of the risks that an investor faces. Thus aids in the process of
diversifying ones portfolio. The volatility in the equity markets over the past years has
resulted in greater use of equity derivatives. The volume of the exchange traded equity
futures and options in most of the mature markets have seen a significant growth.
 It goes beyond that the local derivative in the emerging markets have witnessed
widespread use of the derivative instrument for a variety of reasons. This continuous
growth and development by the emerging market participants has resulted in capital
inflows as well as helped the investors in risk protection through hedging.
Derivatives trading commenced in India in June 2000 after SEBI granted the approval to
this effect in May 2000. SEBI permitted the derivative trading on two stock exchanges,
i.e. and BSE, and NSE, their clearing house/corporation to commence trading and
settlement in approved derivative contracts. Begin with SEBI’s approved trading in index
futures contracts based on S&P CNX Nifty Index and BSE-30 (Sensex) Index. This was
followed by approval for trading in options based on these two indices and options on
individual securities. The trading in index options commenced in June 2001 and trading
in options on individual securities would commence in July 2000. While trading in
futures of individual stocks started from November 2001. In June 2003, SEBI and/RBI
approved the trading on interest rate derivative instruments only in NSE. Introduced
trading of interest rate futures contracts on June 24, 2003 on 91-day Notional T-Bills and
10-year Notional 6% coupon bearing as well as zero coupon Bonds. Futures and Options
were also introduced on CNX IT Index in August 2003. The total exchange traded
derivatives witnessed a value of Rs.5, 423, 333 million during 2002-03 as against Rs.
1,038,480 million during the preceding year. While NSE accounted for about 99.5% of
total turnover, BSE accounted for less than 1% in2002-03. The market witnessed higher
trading levels from June 2001 with introduction of index options, and still higher volumes
with the introduction of stock options in July 2001. In the year 2002 has been a
remarkable year for the global derivatives market. This year witnessed NSE making huge
strides and also moved upward in the global ranking. According to the Futures Industry
Associations in the year 2002, NSE ranked 30th in the global futures and options volume,
whereas it ranks 2nd in the world, in terms of stock futures.


                                            1
Securities and exchange Board of India (SEBI) signed a memorandum of understanding
(MOU) with United States Commodity Futures Trading Commission (CFTC) in
Washington on April 28, 2004. The MOU was signed by Mr. G. N. Bajpal, Chairman,
SEBI and Mr. James E.Newsome, Chairman, CFTC. The MOU aims to strengthen
communication channels and establish a framework for assistance and mutual cooperation
between the two organizations.
The MOU marks the beginning of greater collaboration between SEBI and CFTC too
effectively
Regulate and develop futures markets, in view of greater cross-border trade and cross-
market linkages brought about by the globalization of financial markets. The two
authorities intend to consult periodically about matters of mutual interest in order to
promote cooperation and market
Integrity and to further the protection of futures and options market participants. In
furtherance of the objective of promoting the development of futures and options
regulatory mechanisms would also provide technical assistance for development of
futures markets in India.
In India, the statutory, basis for regulating commodity futures’ trading is found in the
Forward Contracts (Regulation) Act. 1952, which (apart from being an enabling
enactment, laying down certain fundamental ground rules) created the permanent
regulatory body known as the Forwards Markets Commission. This commission holds
overall charge of the regulation of all forward contracts and carries out its functions
through recognized association.
Too much regulation and too little regulation are both bad in respect of these markets.
Too much regulation will have a throttling effect and prevent the entry and growth of the
market. Too little regulation will lead to lack of enough protection to investors and fear of
failures in the market.
The role of regulator has many objectives the purpose of regulation is to protect the
interests of investors, infuse confidence in the market and prevents unfair trade practices.


                                            2
1.2-STATEMENT OF PROBLEM

     The study analyses Various Derivatives Used to Minimise Risk in Indian
        Capital Market.

     It foresees the difficulties facial to choose the underlying assets in the
        derivatives and to analyze the current scenario of Derivative markets in India


1.3-OBJECTIVES OF THE STUDY

1. To understand the concept and to study the current scenario of derivatives market
in India.

2. To analyze whether the purpose for which derivatives are used has been actually
achieved or not

3. To study the purpose for which financial institutions adopt derivatives

4. To know pricing of derivatives.

5. To know about future of derivative trading in India

6. To find the growth of derivatives in India

7. To suggest suitable methods based on the observations of the study

1.4-Data collection:

The study is exclusively based on secondary data.

    Secondary data is collected from various sources such as text books, reports,
annual reports of various organisations , research articles, papers presented at various
national and international seminars, conferences, workshops etc.,       Secondary data
was also used to to conceptualise the term risk and the degree of risk involved. This
apart of Websites of companies, Stock exchanges, NSE and BSE were used.
Newspaper such as Economic Times, Business Line, Magazines such as Business
World and Capital Market were also used.


                                         3
1.5-PLAN OF ANALYSIS TECHNIQUE

The collected data has been carefully classified, tabulated and interpreted on the basis
of which, tables, charts and graphs are drawn .Percentages are drawn from the tabulated
frequencies and the data should be analyzed. The analysis of data helped in drawing
inferences and better understanding, charts are plotted.

  1.6-SCOPE OF THE STUDY

       Derivative deals with equity, derivatives, mutual funds, etc. in this we are find
         out which is the once is best and analyze the customer awareness in
         derivatives Market and it also covers the recent changes in derivatives
         Market.

       It gives the information about Forward, Future Option, & swaps. It gives
         more concentrate on how Securities traded in derivative markets


  1.7- LIMITATIONS OF THE STUDY

The study was carried out only on secondary information and it is carried out only for a
short period of three months hence the findings of the study cannot be generalized.


                                           4
Theoretical Review of Literature
  2-DERIVATIVES
  With the opening of the economy to multinational and the adoption of the liberalized
  economic policies the economy is driven more towards the free market economy. The
  complex nature of the financial structuring is self involves the utilization of
  multicurrency transaction. It exposes the clients, particularly corporate clients to
  various risks such as exchange rate risk, interest risk, economic risk & political risk

  In the present state of the economy there is an imperative need for the corporate
  clients to protect their operating profits by shifting some of the uncontrollable
  financial risk to those who are able bear and manage them. Thus, risk management
  becomes a must for survival since there is a high volatility in the present’s financial
  markets

  In the context, derivatives occupy an important place as a risk reducing machinery.
  Derivatives are useful to reduce many of the risks. In fact, the financial service
  companies can play a very dynamic role in dealing with such risk. They can ensure
  that the above risks are hedged by using derivatives like forwards, futures, options,
  swaps

  In a broad sense, many commonly used instruments can be called derivatives since
  they derive their value from underlying assets. For instance, equity share its self is a
  derivatives, since it derives its value from the underlying assets. Similarly one takes
  an insurance against his house covering all risks


  DEFINITION

  Derivatives are the financial instruments, which derive their value from some other
  financial instruments, called the underlying. The foundation of all derivatives market
  is the underlying market, which could be spot market for gold, or it could be a pure
  number such as the level of the wholesale price index of a market price.
A derivative is a financial instrument whose value depends on the
  Value of other basic underlying variables.
                                                                  “John c hull”


                                            5
According to the Securities Contract (Regulation) Act, 1956, derivatives include:
•   A security derived from a debt instrument, share, and loan whether secured or
    unsecured, risk instrument or contract for differences or any other form of Security.
•   A contract, which derives its value from the prices or index of prices of underlying
    securities.
    Therefore, derivatives are specialized contracts to facilitate temporarily for hedging
    which is protection against losses resulting from unforeseen price or volatility
    changes. Thus, derivatives are a very important tool of risk management.
    Derivatives perform a number of economic functions like price discovery, risk
    transfer and market completion. The simplest kind of derivative market is the forward
    market. Here a buyer and seller write a contract for delivery at a specific future date
    and a specified future price. In India, a forward market exists in the form of the dollar-
    rupee market. But forward market suffers from two serious problems;
    Counter party risk resulting in comparatively high rate of contract noncompliance
    And poor liquidity.
    Futures markets were invented to cope with these two difficulties of forward markets.
    Futures are standardized forward contracts traded on an organized stock exchange. In
    essence, a future contract is a derivative instrument whose value is derived from the
    expected price of the underlying security or asset or index at a pre-determined future
    date.
    Derivatives are financial contracts that are designed to create market price exposure to
    changes in an underlying commodity, asset or event. In general they do not involve
    the exchange or transfer of principal or title. Rather their purpose is to capture, in the
    form of price changes, some underlying price change or event. The term derivative
    refers to how the prices of these contracts are derived from the price of some
    underlying security or commodity or from some index, interest rate, exchange rate or
    event. Examples of derivatives include futures, forwards, options and swaps, and these
    can be combined with each other or traditional securities and loans in order to create
    hybrid instruments or structured securities


                                              6
2.1- Players of trading in Futures & Option

 The minimum quantity trade in is one market lot. The market lot is different for on
 NSE Derivatives stocks/index. Time to time list will keep changing


          CNXIT                   ICICI                     Oriental Bank
          NIFTY                   Infosys                   PNB
          ACC                     IOC                       Polaris

          Andhra Bank             MTNL                      Ranbaxy
          Bajaj Auto              ONGC                      Wipro

          Bank of Baroda          Nalco                     REL

          Bank of India           Tisco                     Union Bank

          BEL                     M&M                       TCS

          Bank of India           Maruti                    Tata TEA

          HCL Tech                Grasim Ind                ITC

          BHEL                    IPCL                      RIL

          BPCL                    Hero Honda                i-flex

          Canada Bank             HDFC Bank                 HPCL

          Cipla                   HLL                       Tata Power

          GAIL                    Hindalco                  Gujarat Abuja


                                          7
2.2-DERIVATIVES IN INDIA
A derivative is a security or contract designed in such a way that its price is derived from
the price of an underlying asset. For instance, the price of a gold futures contract for
October maturity is derived from the price of gold. Changes in the price of the underlying
asset affect the price of the derivative security in a predictable way.
The term derivatives can simply be understood as those items that do not have their own
independent values. Rather they have derived values. Derivatives have a significant place
in finance and risk management. A Derivative is financial instrument whose pay-off is
derived from some other asset which is called an underlying asset.


Evolution of derivatives
In the 17th century, in Japan, the rice was been grown abundantly; later the trade in rice
grew and evolved to the stage where receipts for future delivery were traded with a high
degree of standardization. This led to forward trading. In 1730, the market received
official recognition from the “Tokugawa Shogunate” (the ruling clan of shoguns or feudal
lords). The Dojima rice market can thus be regarded as the first futures market, in the
sense of an organized exchange with standardized trading terms.
The first futures markets in the Western hemisphere were developed in the United States
in Chicago. These markets had started as spot markets and gradually evolved into futures
trading. This evolution occurred in stages. The first stage was the starting of agreements
to buy grain in the future at a pre-determined price with the intension of actual delivery.
Gradually these contracts became transferable and over a period of time, particularly
delivery of the physical produce. Traders found that the agreements were easier to buy
and sell if they were standardized in terms of quality of grain, market lot and place of
delivery. This is how modern futures contracts first came into being. The Chicago Board
of Trade (CBOT) which opened in 1848 is, to this day the largest futures market in the
world.


                                             8
2.3 Kinds of financial derivatives
1) Forwards
2) Futures
3) Options
4) Swaps

1) Forwards
A forward contract refers to an agreement between two parties, to exchange an agreed
quantity of an asset for cash at a certain date in future at a predetermined price specified
in that agreement. The promised asset may be currency, commodity, instrument etc, In a
forward contract, a user (holder) who promises to buy the specified asset at an agreed
price at a future date is said to be in the ‘long position’. On the other hand, the user who
promises to sell at an agreed price at a future date is said to be in ‘short position’.


2) Futures
A futures contract represents a contractual agreement to purchase or sell a specified asset
in the future for a specified price that is determined today. The underlying asset could be
foreign currency, a stock index, a treasury bill or any commodity. The specified price is
known as the future price. Each contract also specifies the delivery month, which may be
nearby or more deferred in time.
The undertaker in a future market can have two positions in the contract: -
a) Long position is when the buyer of a futures contract agrees to purchase the underlying
asset.
b) Short position is when the seller agrees to sell the asset. Futures contract represents an
institutionalized, standardized form of forward contracts. They are traded on an organized
exchange, which is a physical place of trading floor where listed contract are traded face
to face.
A futures trade will result in a futures contract between 2 sides- someone going long at a
negotiated price and someone going short at that same price. Thus, if there were no
transaction costs, futures trading would represent a ‘Zero sum game’ what one side wins,
which exactly match what the other side loses.


                                              9
Types of futures contracts
a) Agricultural futures contracts:
These contracts are traded in grains, oil, livestock, forest products, textiles and foodstuff.
Several different contracts and months for delivery are available for different grades or
types of commodities in question. The contract months depend on the seasonality and
trading activity.
b) Metallurgical futures contract:-
This category includes genuine metal and petroleum contracts. Among the metals,
contracts are traded in
     gold,
     silver,
     platinum and
     Copper. Of the petroleum products, only heating oil, crude oil and gasoline is
        traded.
c) Interest rate futures contract
These contracts are traded on treasury bills, notes, bonds, and banks certification of
deposit, as well as Eurodollar.


d) Foreign exchange futures contract
These contracts are trade in the British Pound, the Canadian Dollar, the Japanese Yen, the
Swiss Franc and the Deutsche Mark. Contracts are also listed on French Francs, Dutch
Guilders and the Mexican Peso, but these have met with only limited success.


1) Options
An option contract is a contract where it confers the buyer, the right to either buy or to
sell an underlying asset (stock, bond, currency, and commodity) etc. at a predetermined
price, on or before a specified date in the future. The price so predetermined is called the
‘Strike price’ or ‘Exercise price’. Depending on the contract terms, an option may be
exercisable on any date during a specified period or it may be exercisable only on the
final or expiration date of the period covered by the option contract.


                                            10
Option Premium
In return for the guaranteeing the exercise of an option at its strike price, the option seller
or writer charges a premium, which the buyer usually pays upfront. Under favorable
circumstances the buyer may choose to exercise it.
Alternatively, the buyer may be allowed to sell it. If the option expires without being
exercised, the buyer receives no compensation for the premium paid.
Writer
In an option contract, the seller is usually referred to as “writer”, since he is said to write
the Contract. If an option can be excised on any date during its lifetime it is called an
American Option. However, if it can be exercised only on its expiration date, it is called
an European Option.
Option instruments
a) Call Option
 A Call Option is one, which gives the option holder the right to “buy” an underlying
asset
at a pre-determined price.
b) Put Option
 A put option is one, which gives the option holder the right to “sell” an underlying asset
at a pre-determined price on or before the specified date in the future.
c) Double Option
  A Double Option is one, which gives the Option holder both the right to “buy” and
“sell” Underlying asset at a pre-determined price on or before a specified date in the
future.


2) SWAPS
A SWAP transaction is one where two or more parties exchange (swap) one pre-
determined
Payment for another.
There are three main types of swaps:-
a) Interest Rate swap
An Interest Rate swap is an agreement between 2 parties to exchange interest obligations
or
Receipts in the same currency on an agreed amount of notional principal for an agreed
period of time.


                                             11
b) Currency swap
A currency swap is an agreement between two parties to exchange payments or receipts
in One currency for payment or receipts of another.
c) Commodity swap
A commodity swap is an arrangement by which one party (a commodity user/buyer)
agrees to Pay a fixed price for a designated quantity of a commodity to the counter party
(commodity producer/seller), who in turn pays the first party a price based on the
prevailing market price (or an accepted index thereof) for the same quantity.
Derivatives are financial instruments whose values depend on the values of other, more
basic underlying assets. Exchange traded financial derivatives were introduced in India in
June 2000 at the two major stock exchanges, NSE and BSE. Derivatives are used by :
1. Hedgers: For protecting against adverse movement. Hedging is a mechanism to reduce
price risk inherent in open positions. Derivatives are widely used for hedging. A Hedge
can help lock in existing profits. Its purpose is to reduce the volatility of a portfolio, by
reducing the risk.
2. Speculators: To make quick fortune by anticipating/forecasting future market
movements. Hedgers wish to eliminate or reduce the price risk to which they are already
exposed. Speculators, on the other hand are those class of investors who willingly take
price risks to profit from price changes in the underlying. While the need to provide
hedging avenues by means of derivative instruments is laudable, it calls for the existence
of speculative traders to play the role of counter-party to the hedgers. It is for this reason
that the role of speculators gains prominence in a derivatives market.
3. Arbitrageurs: To earn risk-free profits by exploiting market imperfections.
Arbitrageurs profit from price differential existing in two markets by simultaneously
operating in the two different markets.


                                            12
2.4 DERIVATIVE MARKET IN INDIA
An important step towards introduction of derivatives trading in India was the
Promulgation of the Securities Laws (Amendment) Ordinance, 1995, which lifted the
Prohibition on "options in securities" (NSEIL, 2001). However, since there was no
Regulatory framework to govern trading of securities, the market could not develop.
SEBI Set up a committee in November 1996 under the chairmanship of Dr. L.C. Gupta
to Develop appropriate regulatory framework for derivatives trading. The committee
suggested that if derivatives could be declared as "securities" under SCRA, the
appropriate regulatory framework of "securities" could also govern trading of derivatives.
SEBI also set up a group under the chairmanship of Prof. J.R. Varma in 1998 to
recommend risk containment measures for derivatives trading. The Government decided
that a legislative amendment in the securities laws was necessary to provide a legal
framework for derivatives trading in India.
Consequently, the Securities Contracts (Regulation) Amendment Bill 1998 was
introduced in the LokSabha on 4th July 1998 and was referred to the Parliamentary
Standing Committee on Finance for examination and report thereon. The Bill suggested
that derivatives may be included in the definition of "securities" in the SCRA whereby
trading in derivatives may be possible within the framework of that Act.
The said Committee submitted the report on 17th March 1999. The Committee was of the
opinion that the introduction of derivatives, if implemented, with proper safeguards and
risk containment measures, will certainly give a fillip to the sagging market, result in
enhanced investment activity and instill greater confidence among investors/participants.
The Committee was of the view that since cash settled contracts could be classified as
"wagering agreements" which can be null and void under Section 30 of the Indian
Contracts Act, 1872, and since index futures are always cash settled, such futures
contracts can be entangled in legal controversy. The Committee, therefore, suggested an
overriding provision as a matter of abandoned caution-
"Notwithstanding anything contained in any other Act, contracts in derivatives as per the
SCRA shall be legal and valid". Further, since Committee was convinced that stock
exchanges would be better equipped to undertake trading in derivatives in sophisticated
environment it would be prudent to allow trading in derivatives by such stock exchanges
only. The Committee, therefore, suggested a clause- "The derivative shall be traded and
settled on stock exchanges and clearing houses of the stock exchanges, respectively in
accordance with the rules and bye-laws of the stock exchange". The Proposed Bill, which


                                              13
incorporated the recommendations of the said Parliamentary Committee, was finally
enacted in December 1999.
Equity Derivatives in India
    Equity index futures are the most widely traded futures contract while single stock
       futures on the whole contribute to a larger percentage of the traded volumes
    Equity index options are the most widely traded options contract in the exchange
    FII’s are very active in the equity derivative markets in India . Retail presence is
       also high in the equity derivative market
Interest Rate and Currency Derivatives in India
    The market for Overnight Index Swaps (OIS) is the most active interest rate
       derivative
    OIS is based on the overnight call money benchmark, NSE Mibor
    Other interest rate derivatives include swaps on government bond benchmarks
Currency derivatives is dominated by forward market though options are picking up

2.5-DERIVATIVES PRODUCTS LEGALLY PERMITTED TO BE TRADED IN
INDIAN

1. Equity Derivatives (Index/stock futures/options) - Legally permitted to be traded
through stock exchanges approved by SEBI


2. Commodity Trading - Commodity futures are permitted. Commodity futures
permitted only for trading in commodities approved by the Government in Commodity
Exchanges recognized by Forward Markets Commission. Option contracts in
commodities trading are not permitted.


3. Foreign Exchange Derivatives - Forward Contracts as approved by RBI permitted
to be transacted by Banks and other approved foreign-exchange dealers.


4. OTC rupee derivatives in the form of Forward Rate Agreements (FRAs)/Interest Rate
Swaps (IRS) - These were introduced by RBI in India in July 1999 in terms powers
vested with it Foreign Exchange Management Act, 2000. These derivatives enable banks,
primary dealers (PDs) and all-India financial institutions (FIs) to hedge interest


                                            14
5. Rate risk for their own balance sheet management and for market-making purposes.
Banks/PDs/FIs can undertake different types of plain vanilla FRAs/IRS. Swaps having
explicit/implicit option features such as caps/floors/collars are not permitted now.


6. Exchange Traded Interest Rate Derivatives were introduced by RBI/SEBI during June,
2003. These can be traded through stock exchanges by primary dealers subject to
conditions stipulated by RBI. OTC Rupee derivatives are presently not permitted.


2.6-CATEGORIES OF DERIVATIVES TRADED IN INDIA
1. Commodities Futures for Coffee, Oil Seeds, Oil (Castor, Palmolein), Pepper, Cotton,
Jute and Jute Goods are traded in the Commodities Futures. Forward Markets
Commission regulates the trading of commodities futures.


2. Index futures based on Sensex and Nifty Index are also traded under the supervision of
SEBI.
3. RBI has permitted Banks, FIs and PDs to enter into forward rate agreement
(FRAs)/interest rate swaps in order to facilitate hedging of interest rate risks and ensuring
orderly development of the derivatives market
4. NSE became the first exchange to launch trading in options on individual securities.
Trading in options on individual securities commenced from July 2, 2001. Option
contracts are American style and cash settled and are available on 41 securities stipulated
by the Securities & Exchange Board of India (SEBI)
5. NSE commenced trading in futures on individual securities on November 9, 2001. The
futures contracts are available on 41 securities stipulated by the Securities & Exchange
Board of India (SEBI).BSE also has started trading in individual stock options & futures
(both Index & Stocks) around the same time as NSE.


                                            15
2.7-Trading Strategies of Derivatives

   •   Buy downside put as insurance when long stocks
   •   Sell upside call to collect premium when upside is limited
   •   Buy call spread expecting limited upside
   •   Buy put spread expecting limited downside
   •   Buy strangle or straddle expecting volatility ahead
   •   Synthetic short – buy put sell call
   •   Most PMs buy options not sell

Trading Strategies Buy Straddle

   •   Buy both ATM call and put
   •   Max gain: unlimited
   •   Max loss: time decay (theta)
   •   Buy gamma and kappa, pay theta
   •   Short dated straddle – buy more gamma
   •   Long dated straddle – buy more kappa

Trading Strategies Buy strangle

   •   Buy both OTM call and put
   •   Max gain: unlimited
   •   Max loss: time decay, theta
   •   You buy gamma and kappa, earn theta
   •   Short dated strangle – buy more gamma
   •   Long dated strangle – buy more kappa
   •   Diversify your risk comparing to straddle and cheaper


                                             16
Trading Strategies

John Murphy is a very popular author, columnist, and speaker on the subject of StockCharts.com
is very glad to include his trading in our educational material. If you find this information useful,
please visit the Murphy Morris web site for additional examples of John's insight.


     Buy downside put as insurance when long stocks

     Sell upside call to collect premium when upside is limited

     Buy call spread expecting limited upside

     Buy put spread expecting limited downside

     Buy strangle or straddle expecting volatility ahead

     Synthetic short – buy put sell call

        Buy call option
     Expecting more upside


                                                17
Sell put option
    Expecting limited downside


2.8-Derivative Based Instruments
 Derivative Instruments are instruments at which their values are derived from the
   value of an underlying physical or financial assets

 Derivative Instruments include:

Forward Contracts                    Futures Contracts

Salam Contracts                      Swap Contracts

Option Contracts (Call & Put)                Combination & Embedded Contracts

    Derivative Instruments are mainly used as risk management tools

    Participation in risk and reward is an important feature of Islamic finance &
       investments

    Management of risk is an integral part of Islamic mode of financing


                                          18
Call Options

   Call Options are contracts at which the owner of the Call (buyer or long position
     holder) after paying a premium (option premium) to the seller of the Call, gains
     the right but not the obligation to buy a given asset with a specific quality at a
     specific price (strike price) at or until a specific date (strike date).

   A Call Option is not an obligation

   The seller of a Call Option (short position holder) has no obligations to sell the
     asset until the Call is exercised by the Option buyer

   When the Call is exercised the seller is obliged to sell the asset at the strike price

   Call Option buyer thinks the asset price will rise and the seller thinks the opposite

   A Call Option buyer usually uses this instrument to insure or hedge the cost of the
     needed raw materials or the maximum price he/she wants to pay for the purchase
     of an asset

   Call Options are mainly traded in the organized exchanges and to some degree in
     the OTC markets


                                           19
Long Call Option


                                        Long Call


      Value


                            Break-Even Price

                        Underlying Asset Price


                   20
Short Call Option


          Value


                                           Break-Even Price
                                             Underlying Asset Price     Short Call


Put Options:
 Put Options are contracts at which the owner of the Put (buyer or long position
   holder) after paying a premium (option premium) to the seller of the Put, gains the
   right but not the obligation to sell a given asset with a specific quality at a specific
   price (strike price) at or until a specific date (strike date).

 A Put Option is not an obligation

 The seller of a Put Option (Short Position holder) has no obligations to buy the asset
   until the Put is exercised by the Option buyer

 When the Put is exercised the seller is obliged to buy the asset at the strike price

 Put Option buyer thinks the asset price will fall and the seller thinks the opposite

 A Put Option buyer usually uses this instrument to insure or hedge the income
   resulting from the sale of an asset or the minimum price he/she receives from the sale
   of an asset

 Put Options are mainly traded in the organized exchanges and to some degree in the
   OTC markets


                                              21
Long Put Option


                  Long Put

Value


                             Break-Even Price

                      Underlying Asset Price


                             22
Short Put Option


                                   Break-Even Price

Value


                            Short Put


                                  Underlying Asset Price
  •     An option gives its owner the right to buy or sell an underlying asset on or before
        a given date at a fixed price.

  •     Option belong to a broader class of assets called contingent claims

  •     The most popular model for pricing options is the block-scholes model which was
        published in 1973 the year in which the Chicago board of options exchange the
        first organized options exchange in the world was also setup – it was a rare
        occurrence in the field of finance when a seminal theoretical breakthrough
        coincided with a major institutional development.


                                           23
HOW OPTIONS WORK
•   The options to buy is a call option & the option to sell is a put options

•   The options holder is the buyer of the option & the option writer is the seller of
    the option.

•   The fixed price at which the option holder can buy & sell the underlying asset is
    called the striking price.

•   The date when the option expires is referred to as the expiration date.

•   The act of buying or selling the underlying asset as per the option contract is
    called exercising the option.

•   Options traded on an exchange are called exchange-traded options.

•   Options are said to be

        1. ATM-At The Money

        2. ITM-In The Money

        3. OTM-Out of The Money

 Call option                                                    put option

•   ATM exercise price=market price               exercise price=market price

•   ITM exercise price<market price             exercise price>market price

•   OTM exercise price>market price             exercise price<market price

•   The value of an option if it were to expire immediately is called its intrinsic value.

•   The excess of the market price of any option over its intrinsic value is called the
    time value of the option.

•   Exchange traded options are standardized in terms of quantity cycle, expiration date,
    strike prices, type of option, & mode of settlement.


                                           24
2.9-EQUITY OPTIONS IN INDIA

       There are two popular types of equity options index options and options on
       individual securities.

       Types of Equity Option

   •   Bombay Stock Exchange

   •   National Stock Exchange

INDEX OPTION:

       Index options are options on stock market indices. Currently the most popular
index options option in India is the option on the S&P CNX Nifty which is traded on the
NSE. The salient features of this contract are as follows

   1. The contract size is 200 times the underlying index.

   2. The options contracts have a maximum of three month trading cycle

           •   Near month

           •   Next month

           •   Far month

               A new contract will be introduced on the next trading day

   3. It is a European style option contract

   4. The expiry day is the last Thursday of the expiry month or previous trading day if
       the last Thursday is a trading holiday

   5. The contract is cash settled. The settlement is done a day after the expiry day
       based on the expiration price as may be decided by the exchange.


                                           25
Futures & Forward contract
forward                                  future
1.traded on phone                        1.traded in a competitive arena
2.self-regulating                        2.regulated by authority like the exchange
3.tailor made sizes
                                         3.standardised sizes
4.delivary on any date and as per the
                                         4.delivary on specific dates fixed before
requirements of the party
                                         hand
5.settlements on the due date
                                         5.settlement on a daily basis
6.Margins are not required
                                         6.mergins are required


                                    26
3- INDUSTRY PROFILE
  The growth of financial sector in India at present is nearly 8.5% per year. The rise in the
growth of the economy. The financial policies and the monetary policies are able to stable
growth rate. The reforms, pertaining to the monetary policies and the macroeconomic
policies over the last five years has influenced the Indian economy to the core.

However global economic activity decelerated towards the end of the calendar year
resulting in investment concerns on account of the sub-prime crisis in the US and other
developed nations. Naturally the effects of this slowdown spilled over into developing
economies also and we are looking ahead with some degree of concern over the prospects
in the near future.

The economic environment and prospects of India got the attention of global investors
and the FII inflows continued even in the current financial year. The net FII investors
peaked at USD 7 billion in September 2007. The increased liquidity combined with
excellent performance of the corporate sector helped growth of equity market
significantly. The Sensex touched the peak level of 21,206 in the month of January 2008.
As a resulted volume in the market also went up to unprecedented level. The combined
daily market turnover touched the record level of Rs 1 lakh crore for the first time in the
history of capital market. The average daily turnover in the cash segment of NSE which
was 7,812 crore in the year 2006-07 crossed was Rs 20,000 crore in October, 2007.
Similarly the average volume in the derivative segment which was Rs 29,543 crore in
2006-07 reached a high of Rs 83,348 crore in October 2007. There has been a
considerable increase in other areas of the industry such as mutual funds. IPOs and
insurance products also, 612 mutual fund schemes were launched during the year against
413 last year.

In recent days economic collapsed in variation of the foreign investors fund main effect of
the Indian economy in 2008-2009 the Bombay Stock Exchange (BSE) the Sensex was
13,400 in the month of 13th july 2009 . In other side National Stock Exchange (NSE)
3,974 is in the same month of 2009 . However the market witnessed deep corrections in
the end of January 2009 as a fall out of sub-prime crisis and related economic concerns in


                                            27
the US. Consequently volumes went down below half of the peak and the index corrected
by more than 30% from its peak level. The dark clouds caused by global events and its
possible impact on Indian economy continue to cast a shadow on the outlook of the
markets in the near future.


However global economic activity decelerated towards the end of the calendar year
resulting in investment concerns on account of the sub-prime crisis in the US and other
developed nations. Naturally the effects of this slowdown spilled over into developing
economies also and we are looking ahead with some degree of concern over the prospects
in the near future.

The economic environment and prospects of india got the attention of global investors
and the FII inflows continued even in the current financial year. The net FII investors
peaked at USD 7 billion in September 2007. The increased liquidity combined with
excellent performance of the corporate sector helped growth of equity market
significantly. The Sensex touched the peak level of 21,206 in the month of January 2008.
As a resulted volume in the market also went up to unprecedented level. The combined
daily market turnover touched the record level of Rs 1 lakh crore for the first time in the
history of capital market. The average daily turnover in the cash segment of NSE which
was 7,812 crore in the year 2006-07 crossed was Rs 20,000 crore in October, 2007.
Similarly the average volume in the derivative segment which was Rs 29,543 crore in
2006-07 reached a high of Rs 83,348 crore in October 2007. There has been a
considerable increase in other areas of the industry such as mutual funds. IPOs and
insurance products also , 612 mutual fund schemes were launched during the year against
413 last year.

In recent days economic collapsed in variation of the forign investors fund main effect of
the Indian economy in 2008-2009 the Bombay Stock Exchange (BSE) the sensex was
13,400 in the month of 13th july 2009 . In other side National Stock Exchange (NSE)
3,974 is in the same month of 2009 .

However the market witnessed deep corrections in the end of January 2009 as a fall out
of sub-prime crisis and related economic concerns in the US. Consequently volumes went
down below half of the peak and the index corrected by more than 30% from its peak


                                           28
level. The dark clouds caused by global events and its possible impact on Indian economy
continue to cast a shadow on the outlook of the markets in the near future.

3.1- COMPANY PROFILE

3.1a- Background and Inception of the company

     Mr.C.J.George and Mr.Ranajit Kanjilal founded Geojit as a partnership firm in the
year 1987 in 1993. Mr.Ranajit kanjilal retired from the firm        and Geojit became a
proprietary concern of Mr. C.J.George. In 1994, it became a public limited company by
the name Geojit securities Ltd. The Kerala state industrial Development Corporation Ltd.
(KSIDC),IN 1995, became a co-promoter of Geojit by acquiring 24% stake in the
company, the only instance in india of a government entity participating in the equity of a
stock broking company.

22yearsof history in Indian Capital Market

Geojit BNP Paribas has 22 years of in-depth broking experience in the Indian Capital
Market. More than 4.5 lakh clients and over Rs 5,400 crores (as of 31st Mar.’09) in
Assets Under Management reflect the trust reposed in our expertise.

Pioneer in Online Trading in Feb. 2000

In the year 2000, Geojit BNP Paribas pioneered the simple concept of providing
individuals with the facility to trade online. This revolution has given the company the
first mover advantage in online trading. As a creative innovator, Geojit BNP Paribas uses
advanced technology in online trading to meet client requirements such as customized
online trading platforms and many other services.

Strong Shareholders

Geojit BNP Paribas is backed by strong shareholders. In 2007, global banking major BNP
Paribas joined the company’s other major shareholders - Mr. C.J.George, KSIDC (Kerala
State Industrial Development Corporation) and Mr.Rakesh Jhunjhunwala – when it took a
stake to become the single largest shareholder.

Wide range of products

Geojit BNP Paribas offers a wide range of trading and investment products and solutions.
Certified financial advisors help clients to arrive at the right financial solution to meet


                                             29
their individual needs. The wide range on offer includes - Equities | Derivatives |
Currency Futures | Custody Accounts | Mutual Funds | Life Insurance & General
Insurance | IPOs | Portfolio Management Services | Property Services | Margin Funding |
Loans against Shares Learn the craft You too can develop your trading skills by availing
of the effective guidance by our research department. We offer-Daily mails delivered to
our client’s mailbox on market conditions and recommendations

Technical analysis of BSE 200 Index scrip’s

Free monthly investment magazine

Services of professionally qualified executives at 500 offices across India.

Our strong research ideas have been instrumental in converting our clients into successful
traders.

Multichannel service-

     Internet,

     Phone,

     Branch trading

     Trade the way that you want to by selecting from multiple channel options-
           Internet, Phone or Branch.

First mover advantage

Geojit BNP Paribas through its first mover advantage in different areas has been the first
to serve investors with its innovative offerings.

1st to launch internet trading in the year 2000.

1st to launch integrated internet trading system for cash and derivative segments in the
year 2002.

1st Indian stock broking company to commence domestic retail broking operations in any
foreign country.

1st in the industry to have a global player offering its name thereby creating Geojit BNP
Paribas.


                                            30
1st to launch exclusive branches for women in 2005.

Wide range of fund options

 Geojit BNP Paribas gives you the option to choose from the 700 plus Mutual Fund
schemes offered by over 35 Asset Management companies such as

   •   SBI Mutual Fund,

   •   Reliance Mutual Fund,

   •   Franklin Templeton India Mutual Fund,

   •   Tata Mutual Fund,

   •   Sundaram BNP Paribas Mutual Fund,

   •   Fidelity Mutual Fund, and

   •   HDFC Mutual Fund.

3.1b-Geojit Securities is now Geojit BNP Paribas Financial services

Mumbai March 13 BNP Paribas S.A. has become the single largest shareholder in Geojit
Financial Services Ltd through a preferential allotment of 5.68 crore shares and 2.28 crore
warrants. Geojit will now be rechristened `Geojit BNP Paribas Financial Services Ltd.'

The allotments follow shareholders' approval at the Extra Ordinary General Meeting held
on November 22, 2006 and other statutory approvals, the company informed the BSE.

BNP Paribas will acquire 27.18 per cent stake in the company at Rs 26 per share and after
the conversion of warrants into shares within 18 months at the same price, will increase
its holding to 34.35 per cent. BNP Paribas will make an open offer for acquiring an
additional 20 per cent stake in Geojit. The price for the open offer has not yet been
decided, said Mr Olivier Le Grand, Head of BNP Paribas Personal Investors.

Shares of Geojit Financial Services rose 5.21 per cent to close at Rs 38.35 on the BSE.

However, even post-open offer there are no plans to delist Geojit from the stock
exchanges, said Mr. C.J. George, Managing Director, Geojit Financial Services Ltd.


                                           31
The promoters' stake in Geojit will come down to around 30 per cent from around 45 per
cent (going by BSE).

For BNP Paribas the deal will cost around Rs 207 crore and the fund infusion will be
done in stages. It will fund expansion of business in the Middle East, branch expansion in
India and strengthen the distribution of financial products.

The company will continue to be managed by the current team with Mr George as the
Managing Director. Three members from BNP Paribas will be nominated on the board,
namely Mr Olivier Le Grand, Mr. Frederic Amoudru - Chief executive and Country
Manager of BNP Paribas in India and Mr. Rousseau - Head of BNP Paribas Securities,
Asia.

"By joining the global network of BNP Paribas, Geojit will be in a position to serve the
large Indian population living outside India, apart from gaining knowledge from BNP
Paribas' position as the market leader in online brokerage in continental Europe," said Mr
George.

Geojit wants to become a strong distribution platform for brokerage and savings products,
increase margin lending in equities, develop institutional business and strengthen the
business of Geojit Technologies Ltd.


                                            32
3.2- Nature of the Business

A Geojit securities limited /Geojit Financial BNP service limited is the holding company
for the subsidieries .The principal subsidieries include:


                                 Geojit Financial BNP Services limited


Geojit Credits (p)               Geojit Commodities                      Geojit financial services &
limited                          limited                                 management Limited


Geojit Technologies (p)                                  Geojit Financial Distribution
Limited                                                  (p) Limited


                                            33
Sigma system International
                                  FZ LLC


Area of operation

                    STATES                            No of Branches
Andhra Pradesh                                        39
Bihar                                                 1
Chandigarh                                            1
Chaattisgarh                                          1
Goa                                                   1
Gujarat                                               23
Haryana                                               3
Jammu & Kashmir                                       1
Karnataka                                             62
Kerala                                                121
Madhya Pradesh                                        7
Maharashtra                                           54
Delhi                                                 12
Panjab                                                4
Rajasthan                                             6
Tamilnadu                                             94
Uttar Pradesh                                         15
Uttaranchal                                           1
West Bengal                                           7

TOTAL                                                 453


                             34
OWNERSHIP PATTERN

Sl No.   Category of share holders              Total    no    of %   to   Total
                                                shares           shares
1        Indian individuals                     45,606,760       21.82%

2        Indian bodies corporate                20,000,000       9.57%

3        Foreign bodies corporate               56,804,870       27.18%

4        Mutual funds                           7,568,040        3.62%

5        Foreign institutional investors        6,001,465        2.87%


6        Non institutional bodies corporate     8,189.114        3.92%


7        Non institutional Individuals          26,587,130       12.72%

8        Trust                                           525     0.06%

9        Directors & their relatives            29,362,000       14.05%

10       Nonresident Indians                    6,617,951        3.17%


                                           35
11        Overseas Corporate Bodies                            300         0.045


12        Clearing members                             1,823,211           0.87%


13        Hindu undivided families                     429,504             0.21%


          TOTAL                                        208,990,870         100%


3.3 Vision and Mission Statement

VISION

To be a leading financial and commodities intermediary for individual and institutional
clients from india and overseas

Company will continually strive to raise the product and service standard by intelligent
application of technology and processes

MISSION

Company understands and respects customer needs to consistently deliver total quality
solutions through constant skills up gradation

Company believes that there culture helps to attract and retain the best talent

Company upholds uncompromising ethical standards and strives to maintain a distinctive
identity in public mind through innovation and quality

Company is committed to achieve profitable progress, consistently.

Company freely shares investment experience across all ages and strata of society to
encourage wise investment for a better future.

                                            36
CODE OF CONDUCT FOR THE DIRECTORS AND SENIOR OFFICERS
As per Clause 49 of the Listing Agreement with the Stock Exchanges, it shall be
obligatory for the Board of Directors of all listed Companies to lay down a code of
conduct for all Board members and senior management of the Company in order to
ensure good Corporate Governance.

I. CORPORATE GOVERNANCE Corporate governance is about commitment to
values and about ethical business conduct. It is about how an organization is managed.
This includes its corporate and other structures, its culture, its policies and the manner in
which it deals with various stakeholders. Accordingly, timely and accurate disclosure of
information regarding the financial situation, performance, ownership and governance of
the company, is an important part of corporate governance. This improves public
understanding of the structure, activities and policies of the organization. Consequently,
the organization is able to attract investors, and to enhance the trust and confidence of the
stakeholders.

We believe that sound corporate governance is critical to enhance and retain investor
trust. Accordingly, we always seek to attain our performance rules with integrity. The
Board extends its fiduciary responsibilities in the widest sense of the term. Our
disclosures always seek to attain the best practices in international corporate governance.
We are also responsible to enhance long term shareholder value and respect minority
rights in all our business decisions.

II. INTRODUCTION OF CODE (Preamble)
This Code of Ethics for Directors and Senior Executives (the “Code”) helps to maintain
the standards of business conduct for Geojit BNP Paribas Financial Services Limited (the
“Company”) and ensures compliance with legal requirements particularly of Companies
Act, SEBI Regulations and the Listing Agreement with Stock Exchanges. The purpose of
the Code is to deter wrongdoing and promote ethical conduct. The matters covered in this
Code are of utmost importance to the Company, our shareholders and our business
partners. Further, these are essential so that we can conduct our business in accordance
with our stated values.

The Code is applicable to the following persons, referred to as “Officers” :

   •   Directors of the Company
   •   Our Senior Management
   •   Members of the Board of Subsidiary Company

Ethical business conduct is critical to our business. Accordingly, Officers are expected to
read and understand this Code, uphold these standards in day-to-day activities, and
comply with all applicable laws, rules and regulations, the Geojit BNP Paribas Code of
Conduct, Service rules and all applicable policies and procedures adopted by the
Company that govern the conduct of its employees.

                                            37
Because the principles described in this Code are general in nature, Officers should also
review the Company’s other applicable policies and procedures.

Officers should sign the acknowledgment form at the end of this Code and return the
form to the HR department indicating that they have received, read and understood, and
agree to comply with the Code. The signed acknowledgement form should be available
with officers concerned. Each year, as part of their annual review, Officers will be asked
to sign an acknowledgement indicating their continued understanding and adherence of
the code.

III. HONEST AND ETHICAL CONDUCT
We expect all Officers to act in accordance with highest standards of personal and
professional integrity, honesty and ethical conduct, while working on the Company’s
premises, at offsite locations where the Company’s business is being conducted, at
Company sponsored business and social events, or any other place where Officers are
representing the Company.

We consider honest conduct to be conduct that is free from fraud or misrepresentation or
deception. We consider ethical conduct to be conduct conforming to the accepted
professional standards of conduct. Ethical conduct includes ethical handling of actual or
apparent conflicts of interest between personal and professional relationships. This is
discussed in more detail in Section IV below.

IV. CONFLICTS OF INTEREST
 an Officer’s duty to the Company demands that he or she avoids and discloses actual
and apparent conflicts of interest. A conflict of interest exists where the interests or
benefits of one person or entity conflict with the interests or benefits of the Company.
Examples include:

   A. Employment/Outside employment: With regard to the employment with the
      Company, Officers are expected to devote their full attention to the business
      interests of the Company. Officers are prohibited from engaging in any activity
      that interferes with their employment with the Company. Our policies prohibit
      Officers from accepting simultaneous employment with suppliers, customers,
      developers or competitors of the Company, or from taking part in any activity that
      enhances or supports a competitor’s position. Additionally, Officers must disclose
      to the Company’s Audit Committee, any interest that they have that may conflict
      with the business of the Company.


   B. Outside directorships: It is a conflict of interest to serve as a director of any
      company that competes with the Company. Officers must first obtain approval
      from the Company’s audit committee before accepting a directorship.


                                           38
C. Business Interests: If an Officer is considering investing in any customer, supplier,
   developer or competitor of the Company, he or she must first take care to ensure
   that these investments do not compromise on their responsibilities to the
   Company. Our policy requires that Officers first obtain approval from the
   Company’s Audit Committee before making such an investment. Many factors
   should be considered in determining whether a conflict exists, including the size
   and nature of the investments, the Officer’s ability to influence the Company’s
   decisions, his or her access to confidential information of the Company or of the
   other company, and nature of the relationship between the Company and the other
   company. At the time of application for approval, full facts of the proposed
   investment shall be placed before the Committee.


D. Related parties: As a general rule, Officers should avoid conducting Company’s
   business with a relative, or have business in which a relative is associated in any
   significant role. A relative means and includes spouse, children, parents,
   grandparents, grandchildren, aunts, uncles, nieces, nephews, cousins, step
   relationships, and in-laws. Subject to the rules and regulation, the Company
   discourages the employment of relatives of Officers in key positions or
   assignments within the same department. Further, the Company prohibits the
   employment of such individuals in positions that have a financial dependence or
   influence (e.g. an auditing or control relationship, or a supervisor/subordinate
   relationship). Every employee drawing a monthly salary of Rs.10,000/- or more
   shall disclose whether he is a relative or not of any of our directors.


E. Payments or gifts from others: Under no circumstance the Officers shall accept
   any offer, payment, promise to pay, or authorisation to pay any money, gift, or
   anything of value from customers, vendors, consultants, etc., that is perceived as
   intended, directly or indirectly, to influence any business decision, any act or
   failure to act, any commitment of fraud, or opportunity for the commitment of any
   fraud. Inexpensive gifts, infrequent business meals, celebratory events and
   entertainment, provided that they are not excessive or create an appearance of
   impropriety, do not violate this policy. Questions regarding whether a particular
   payment or gift violates this policy are to be directed to Finance Department. Gifts
   given by the Company to suppliers or customers should be appropriate to the
   circumstances and should never be of a kind that could create an appearance of
   impropriety. The nature and cost must always be accurately recorded in the
   Company’s books and records.


F. Corporate opportunities: Officers may not exploit for their own personal gain,
   opportunities that are discovered through the use of corporate property,
   information or position, unless the opportunity is disclosed fully in writing to the
   Company’s Board of Directors and the Board declines to pursue such opportunity.


                                        39
G. Interested Contracts: Except with the consent of the Board of Directors of the
      Company, any of the Director or his relative or a firm in which a director or his
      relative is a partner, any other partner in such a firm, or a private company of
      which the director is a member or director shall enter into any contract with the
      Company for sale, purchase or supply of goods, materials or services, or for
      underwriting the subscription of any shares in or debentures of the Company
      except for purchase or sale of goods for market price or such contracts which
      either party regularly trades or does business. For any clarification in this regard,
      the officers are requested to contact to the Finance Department / Secretarial
      Department / Legal Department.


   H. Whistle Blower Policy: Employees who came across any unethical or improper
      practice (not necessarily a violation of law) shall be free to approach the Audit
      Committee without necessarily informing their supervisors. All officers are
      requested to inform their subordinates about their this right through an effective
      manner. For any clarification in this regard please contact Finance Department /
      Secretarial Department / Legal Department.


   I. Other Situations: It would be impractical to attempt to list all possible situations.
      If a proposed transaction or situation raises any questions or doubts, please contact
      Finance Department.


3.4 ACHIVEMENT AND AWARDS

        The company crossed the following milestone to reach its present position as a
leading retail broking house in India.

1986

 Geojit became the member of the Cochin stock exchange.

1994

 The Kerala state industrial development corporation an arm of the government of
Kerala became a co promoter of the company by acquiring 24% equity stake in Geojit
financial services ltd. Based on the evaluation report of this is the only venture in India
where a state owned development institution is participating in the equity of a stock
broking company. Geojit became a corporate broking house.

1995


                                            40
Geojit comes out with a small initial public offer of rs-95 million which was
oversubscribed by 15 million and KSIDC equity stake comes down to 17%.

 Geojit become a member of the NSE and installs its first trading terminal in Cochin,
Kerala.

1996

 The company launches portfolio management services after obtaining required
registratration from SEBI.

1997

  Geojit become a depository participant under national depository securities depository
ltd (NSDL) and begins providing depository services through its branches.


1999

Geojit becomes a member of the BSE In MUMBAI and activities Bombay Online
Trading in different branches.

The customer’s base of Geojit crosses the 50000 mark


2000

Geojit become the first broking firm in the country to offer online trading facility. The
then SEBI chairman, Mr.D.R.Mehta the facility on 1-2-2000

Commences Derivative Trading after obtaining registration as a clearing and trading
member in NSE.

2001

 Geojit’s customer base crosses 100,000 Become Indian first DP to launch depository
transaction through Internet.

The company issues bonus shares in the ratio of 1:1


                                           41
2002

 Geojit ties up with Met life for the marketing 7 distribution of insurance products across
the country.

 The company becomes the first online brokerage house to launch integrated internet
trading system for both cash and derivative segments.

2003

 Geojit commodities ltd, a wholly owned subsidiary of Geojit became member of
National Multi commodity exchange ltd. National commodity Exchange ltd.

Geojit raises more than Rs-100 million through issue of preferential shares.


2005

 Barjeel Geojit Securities LLC becomes a member of Dubai Gold Commodity
Exchange.

Customer base of Geojit croses 2,50,000 Geojit reach speeds through a network of more
than 300 branches.

The company gets listed on NSE of India ltd.

The company implements Employees stock option scheme.

The company opens a first of its kind all woman’s branch in Cochin.


2006

   Geojit launches Internet Trading on Reuters TIB Mercury platform.


2007


                                          42
On 13-3-2007 the formation of geojit BNP Paribas Financial Services ltd. was announced
in Mumbai and Paris. Through a preferential allotment BNP Paribas had taken 27% stake
in Geojit which will eventually increases to 34.35% .with the final step the French
banking major has become the largest share holder in Geojit Financial services Ltd. With
presence in more than 85 countries the bank has a headcount of more than 1,38,000.


3.5WORK FLOW MODEL

 Geojit a member of NSE & BSE has a network of over 450 branches in India and
abroad, rendering quality equity trading services. Geojit not only has a strong offline
presence but also provides automated online trading services.

 Geojit also provides a call & trade facility to its customers wherein they can place and
track their orders through our dedicated call centre Desk.

  Geojit’s retail spread caters to the need of individuals investors Trading in equities is
made simple, safe and interesting with smart advice from the research desk through daily
SMS alerts, market pointers , periodical research reports stock recommendations and
customer meets organised frequently.


There are 3 types of trading platform offered by Geojit bnp financial for its customer


                                       SILVER


                                      PLATINUM
                                           43
                                        GOLD
1) SILVER:

         Silver platform is browser based solution where in one can enquire and get
  the stock prices market depth, etc. For each scrip at a time. Minimum brokerage
  concept does not apply for silver platform.


2) GOLD:

     This Platform is a web based solution and the customer can login to the trading
  platform from anywhere in the world.


3) PLATINUM:

      The platinum version acts as a virtual dealers terminal providing live up dates and
  confirmation.


                                        44
3.4 - SWOT ANALYSIS


                      STRENGTHS


                                       WEAKNE
THREAT                            SS
                       SWOT


                           45
OPPORTUNITIES


   STRENGTHS:

 Geojit is one of the leading retail financial service companies in the country and in
   the Middle East with membership in NSE and BSE.

 Company continues to achieve cost efficiencies through the application of
   technology.

 Geojit is a charter member of the financial planning standards board of India and
   is one of the largest brokers in the country.

 It is listed on the BSE & NSE and its market capitalization is over Rs.777.6 crores

 It is the first Indian stock broking company to commence domestic retail
   brokerage operations in any foreign country through its joint venture Aloula
   Geojit.

 Geojit renders quality equity trading services.

 It is a highly innovative company and among many industries first to its credit
   prominent is the launch of internal trading in 2000.

 It launched branches exclusively for women investors.

 It brand is popular and the brand image can be capitalized.

 It has well experienced staff and good infrastructure.

 It follows corporate governance norms and adopts best management practices.

 Wide number of products and services and also branches.


                                        46
WEAKNESS:

    Unable to market their products & services more efficiently

    Many of their competitors have significantly greater financial, technical,
       marketing and other resources than available to Geojit.

    Unable to compete with the brokerage rates of their competitors.

    Less number of branches in north India.

    Lack of efficient and effective strategies in attracting customers.


       OPPORTUNITIES:

   The India financial market has a vary high growth potential. The macro economic
fundamental are sound to allow the economy to make rapid strides. Economic expansion
will result in greater disposable incomes and larger number of investors.


    The manifold increase in capital mobile station from the primary market.

    Increase the resource mobilization by mutual funds

    Phenomenal growth in secondary market volumes.

    Introduction of new products like mini derivative contracts and securities lending
       and borrowing scheme.

    Introduction of new instruments in the F&O segment etc.

    Trapping new markets.

    Target the rural and sub urban areas.

    Growing India economy opens up huge market for stock broking companies.

    Company believes that their culture helps to attract and retain the best talent.

    Company is committed to achieve profitable progress consistently.

                                           47
THREATS:

   The stock broking industry has recently witnessed intense competition falling
     brokerage rates & the entry of several big player.

   Increased level of competition is a cause of concerns.

   Competition from financial institution like banks investing firms etc.

   Uncertainty in the market.

   Changes in India political economic conditions.

   Changes in government policies and regulation.

   Dependency on international market.


4-ANALYSIS AND INTERPRETATION OF DATA


                                         48
The analysis and interpretation of data conducted in Geojit BNP Paribas financial
 services ltd Hassan, covers on overview of the Derivatives (F&O) segment month
 wise, product wise, trade wise, with traded value analysis Trend analysis supported by
 charts and Tables from the information collected during the project study


 Table 1: The following table showing the trading Contracts from Oct
 2009 to Mar 2010


Particulars   Oct-09       Nov-09       Dec-09      Jan-10       Feb-10       Marc-10
Stock
Futures       14044526     13260546     11307332    12546679     10725789     12657646
Index
Futures       13615447     15178552     13337833    12056359     13891843     14379982
Stock
Options       1378569      1360703      1252898     1414178      1223627      1384453
Index
Options       26671252     32965274     29525940    27084605     34588704     30199846


 Graph:1 The following Graph Showing                   the Derivatives       trading
 Contracts at NSE from Oct 2009 to Mar 2010


                                         49
Derivatives Contracts
       40000000


                                                                        34588704
       35000000
                                  32965274

                                                                                    30199846
                                               29525940
       30000000
                     26671252                               27084605

       25000000

                                                                                             Stock Future
       20000000                                                                              Index Future
                                                                                             Stock Option
                              15178552
       1500000014044526                                              13891843 14379982       Index Option
   m
   N


                             13260546      13337833
   o
   n
   b
   u
   C
   e
   a
   c
   s
   r
   t
   f


                                                       12546679              12657646
                  13615447                11307332
                                                         1205635910725789
       10000000


       5000000
                    1378569      1360703      1252898      1414178     1223627     1384453

             0
                    Oct/09       Nov/09       Dec/09       Jan/10      Feb/10      Mar/10


Analysis

 Above graph shows that stock future was 14044526 Contract on October 2009 where
 as it Increased to 30199846 Contracts in March 2010. Index Future in October 2009
 was 13615447 Contracts and it decreased to 12657646 Contracts in the month of
 March 2010. Stock Option in October 2009 was 1378569 Contracts and it increased
 to 1384453 Contracts in the month of March 2010. And Index Option in October
 2009 was 26671252 Contracts and it increased to 30199846 Contracts in the month of
 March 2010.


 Interpretation


                                             50
It can be interpreted that The Index futures are having more trade value compare to
stock Future. Index Option are having more trade value compare to stock options.

From the October 2009 to March 2010 Number Contract decreased due to the market
decline, economic exposure and Operational exposure


Table: 2 The following table Showing the Number of Contracts And
average daily Contracts from October-2009 to March-2010
      Months                    Total                             Avg. Daily Trading
      Oct-2009                  55709794                          2932094
      Nov-2009                  62765075                          3138254
      Dec-2009                  55424003                          2639238
      Jan-2010                  53101821                          2794833
      Feb-2010                  60429963                          3021498
      Mar-2010                  58621927                          2791521


Working Note
Average Daily Trading =         Total Contracts
                         ------------------------------------------
                         No. Of trading days in month
 Oct-2008 =55709794/19=2932094
Nov-2009=62765075/20=3138254
Dec-2009=55424003/21=2639238
Jan-2010=53101821/19=2794833
Feb-2010=60429963/20=3021498
Mar-2010=58621927/21=2791521
Analysis
The above table shows Number of Contracts from October-2009 to March -2010,
55709794, 62765075, 55424003, 53101821, 60429963, 58621927, respectively.


Interpretation
It can be interpreted that from October-2009 to November-2009 ontracts are increased
(55709794 to 62765075). And in Nov-2009 to Mar-2010 it decreased (58621927) due
to the market decline


                                          51
Table 3: The following table showing the Derivatives Trading
 Volume at .NSE. From Oct-2009 TO Mar -2010 (in core)

  Particulars   Oct-20   Nov-20   Dec-20   Jan-20   Feb-20   Mar-20
                09       09       09       10       10       10
  Stock         465829   438220   395954   444134   354485   413257
  Futures
  Index         329610   363523   329496   298849   326871   292038
  Futures
  Stock         45387    43666    42855    51454    41285    38467
  Options
  Index         669591   816408   756677   695860   847236   753739
  Options


Graph:2 The following Graph Showing the Derivatives trading volume
at NSE from Oct 2009 to Mar 201


                                  52
Derivatives Trading Volume
     900000
                                                                    847236
                              816408
     800000                               756677                                753739

                                                        695860
     700000       669591

                                                                                         Stock Futures
     600000


     500000 465829                                                                       Index Futures
                         438220                    444134
                                                                           413257
                                     395954
     400000                363523                              354485
 m
 V
 R
 o
 u
 C
 e


               329610                  329496
 s


                                                                                         Stock Options
 r


                                                                 326871
 )
 (
 l


                                                    298849                   292038
     300000

                                                                                         Index
     200000
                                                                                         Options

     100000
                 45387       43666       42855         51454       41285       38467

           0
                Oct/09      Nov/09      Dec/09        Jan/10      Feb/10      Mar/10


Analysis
 Above graph shows that stock future Turnover was 4,65,829 crore on October 2009
 Where as it decreased to 4,13,257 crore in March 2010. Index Future in October 2009
 was 3,29,610 and it decreased to 2,92,038 in the month of March 2010. Stock Option
 in October 2009 was 45,387 crore and it decreased to 38,467 crore in the month of
 March 2010. And Index Option in October 2009 was 6, 69, 591 cores and it increased
 to 7,53,739 crore in the month of March 2010


Interpretation


                                              53
It can be interpreted that The Stock Futures are having more trade value compare to
Index Future. Index Option is having more trade value compare to stock options.

From the October 2009 to March 2010 trade value decreased (except Index Option)
due to the market decline, economic exposure and Operational exposure

Graph: 4 The following Graph Showing the Derivatives trading
volume at NSE of Nov 2009


Analysis

Above graph shows that the Volume of Stock Future is 438220 crore (26.37%), Index
Future is 363523 crore(21.88%), Stock Option is 45666 crore (2.63%) & Index
Option is 816408 crore (49.12%) in the month of October

Interpretation

It can be interpreted The Stock Futures are having more trade value compare to Index
Future. Index Option are having more trade value compare to stock options.


                                       54
Graph:5 The following Graph Showing the Derivatives trading volume
at NSE of Dec 2009


 Analysis

 Above graph shows that the Volume of Stock Future is 395954 crore (25.97%) ,
 Index Future is 329496 crore (21.61%), Stock Option is 42855 crore (2.81%) &
 Index Option is 756677 crore (49.61%) in the month of October

 Interpretation

 It can be interpreted that The Stock Futures are having more trade value compare to
 Index Future. Index Option are having more trade value compare to stock options.


                                        55
Graph:6 The following Graph Showing the Derivatives trading
volume at NSE of Jan 2010


Analysis

Above graph shows that the Volume of Stock Future is 444134 crore (29.80%) , Index
Future is 298849 crore (20.05%), Stock Option is 51454 crore (3.45%) & Index
Option is 695860 crore (46.70%) in the month of October

Interpretation

It can be interpreted that The Stock Futures are having more trade value compare to
Index Future. Index Option are having more trade value compare to stock options.


Graph:7 The following Graph Showing the Derivatives trading
volume at NSE of Feb 2010

                                       56
Analysis

 Above graph shows that the Volume of Stock Future is 354485 crore (22.58%), Index
 Future is 326871 crore(20.82%), Stock Option is 41285 crore (2.63%) & Index Option
 is 847236 crore (53.97%) in the month of October

 Interpretation

 It can be interpreted that The Stock Futures are having more trade value compare to
 Index Future. Index Option are having more trade value compare to stock options.


Graph:8 The following Graph Showing the Derivatives trading volume
at NSE of Mar 2010


                                        57
Analysis

 Above graph shows that the Volume of Stock Future is 413257 crore (27.60%), Index
 Future is 292038 crore (19.50%), Stock Option is 38467 crore (2.56%) & Index
 Option is 753739 crore (50.33%) in the month of October

 Interpretation

 It can be interpreted that the Stock Futures are having more trade value compare to
 Index Future. Index Option are having more trade value compare to stock options.


4.2-Growth of Derivative Market in India


                                        58
Table: 5 the following table showing the Growth of the derivatives in
  India

         Index Futures                     Stock                  Index                   Stock
                                           Futures                Options                 Options

Year       No.   of Turnov No. of Turnov No. of Turnov No.           of Turn
           contract er (Rs. contract er (Rs. contract er (Rs. contract over
           s        cr.)    s        cr.)    s        cr.)    s         (Rs.
                                                                        cr.)

2009-1     1783068   393438    1455912 5195247 3413795 802796                  1401627       50606
0          89        9         40              23      4                       0             5.2

2008-0     2104281   357011    2215779 3479642 2120884 373150                  1329597       22922
9          03        1         80              44      2                       0             6.8

  200
  7-0      156598    38206     203587         754856     553660      13621     946063        3591
  8        579       67        952            3          38          11        1             36.6
2006-      814874    25395     104955         383096     251574      79190     528331        1937
07         24        74        401            7          38          6         0             95
2005-      585378    15137     809054             2791     1293          338       5240      1802
06         86        55        93                 697     5116           469       776       53
  200                                                                                          16
  4-0        2163        772    4704              1484    3293           121       5045        88
  5          5449        147    3066              056     558            943       112         36
  200                                             130                                          21
  3-0        1719        554        3236          593     1732           528       5583        72
  4          1668        446        8842          9       414            16        071         07
  200                                                                                          10
  2-0        2126        439        1067          286     4422           924       3523        01
  3          763         52         6843          533     41             6         062         31
  200                                                                                          25
  1-0        1025        214        1957          515     1759           376       1037        16
  2          588         83         856           15      00             5         529         3


Graph:9 The following Graph                  Showing the Growth of Derivative
Market In India(Turnover)


                                             59
Analysis

 Above graph shows that the Growth of derivatives in India. Index Future Turnover
 was 2365 Crore on 2000-01 Where as it increased to 3934389 Crore in 2009-2010.
 Stock Future in 2001-2002was 51515 Crore and it increased to 5195247 Crore in the


                                      60
2009-2010. Index Option in 2001-2002 was 3765 Crore and it increased to 8027964
 Crore in the 2009-2010. And Stock Option in 2001-2002 was 25163 Crore and it
 increased to 506065.2 Crore in the 2009-2010.


 Interpretation

 It can be interpreted that in the 2000-2001 only Index Future are started & reaming
 Three Could not open i.e. (Stock Option, Stock Future and Index Option). In
 2001-2002 starting all the Four Derivatives. In 2000 is very low turnover but after
 constantly increasing. In 2009-2010 Index Option having more trade value but
 2007-2008 Stock Future is more Than the Index Option. And 2009-2010 good
 position & rapidly increasing the derivative Market in India.


Graph:10 The following Graph Showing the Growth of Derivative
Market In India(Contract)


                                          61
Growth of Derivative Market
        35000000


        30000000


        25000000


        20000000

                                                                            Index Future
        15000000                                                            Stock Future
    m
    N
    o
    n
    b
    u
    C
    e
    a


                                                                            Index Option
    c
    r
    t
    f


        10000000                                                            Stock Option


        50000000


               0


                                           Year


Analysis
 Above graph shows that the Growth of derivatives in India. Index Future was 90580
 Contract on 2000-01 where as it Increased to 178306889 Contracts in 2009-2010.
 Stock Future in 2001-2002was 1957856 Contract and it increased to 145591240


                                      62
Contract in the 2009-2010. Index Option in 2001-2002 was 175900 Contract and it
 increased to 341379523 Contract in the 2009-2010. And Stock Option in 2001-2002
 was 1037529 Contract and it increased to 14016270 Contract in the 2009-2010.


 Interpretation

 In can be interpreted that in the 2000-2001 only Index Future are started & reaming
 Three Could not open i.e. (Stock Option, Stock Future And Index Option). In
 2001-2002 starting all the Four Derivatives. in 2000 is very Less number of contract
 but after constantly increasing. And 2009-2010 good position & Rapidly increasing
 the derivative Market in India.


4.3-Comparative Analysis – World Exchanges


                                        63
Table: 6 the following table showing the Top 10 Derivatives Exchanges
ranked by Number of Contracts Traded and/or Cleared. Exchanges that
operate under common ownership are combined. Rank Exchange 2008


Rank     Exchange                                      2008

1        CME Group (includes CBOT and Nymex) *         3,277,645,351


2        Eurex (includes ISE) *                        3,172,704,773


3        Korea Exchange                                2,865,482,319


4        NYSE Euronext (includes all EU and US         1,675,791,242

         markets) *
5        Chicago Board Options Exchange (includes      1,194,516,467

         CFE) *
6        BM&F Bovespa *                                741,889,113


7        Nasdaq OMX Group (includes all EU and US      722,107,905

         markets) *
8        National Stock Exchange of India              590,151,288


9        JSE South Africa                              513,584,004


10       Dalian Commodity Exchange                     313,217,957


Graph: 11 The following Graph Showing the Top 10 Derivatives
Exchanged in the World (2008)


                                    64
Analysis

Above graph shows that the Top 10 derivatives Exchanges in the World. The CME
Group was more Exchanged and 1st Rank in the World Eurex is 2nd Rank in the
World Korea Exchange, NYSE Euronext, markets)*, Chicago Board Options Exchange,
BM&F Bovespa *, Nasdaq OMX Group are 3rd, 4th, 5th, 6th & 7th Respectively. National Stock Exchange
of India (NSE) 8th Ranked in the World. And JSE South Africa, Dalian Commodity Exchange was
9th&10th respectively.


                                              65
Interpretation

 It can be interpreted that in the 2008 The NSE Turnover is 59,01,51,288 Crore but
 CME Group turnover is 3,277,645,351 Crore. Big difference between both, According
 to this data NSE got 8th Rank & CME Group got 1st Rank


 Table: 7 The following table showing the Comparative analysis of the
 Traded Value in the F&O Segment with the Cash Segment: From
 Spt-2009 to Feb-2010


           months      Cash Segment         F&O Segment

           Spt-20      365063               1388378
           09
           Oct-20      362969               1510417
           09
           Nov-20      324477               1661816
           09
           Dec-20      292900               1524982
           09
           Jan-20      338443               1490297
           10
           Feb-20      245143               1569877
           10


Graph:12 The following Graph Showing the Traded Value in the F&O
Segment with the Cash Segment:


                                       66
Analysis

Above graph shows that Cash Segment Turnover was 365063 crore on September
2009 where as it decreased to 245143 crore in Feb 2010.F&O Segment was 1388378
Crore on September 2009. Whereas it increased to 1569877 Crore in Feb 2010

Interpretation

It can be interpreted that The F&O Segment are having more trade value compare to
Cash Segment. Because F&O have more Flexible

.


4.4-FUTURES SEGMENT


                                      67
Table: 8 the following table showing the Top 5 Traded Symbols on
 February 2010


 Symbols          Turnover    (Rs    Percentage
                  Cr)                (%)
 NIFTY            275349             42.29

 BANKNIFTY        24027              3.69%

 MINIFTY          13219              2.03%

 TATAMOTORS       12471              1.92%

 TATASTEEL        18357              2.82%

 OTHERS           307555             47.25%


Graph :13 The following Graph Showing the FUTURES SEGMENT of
Top 5 Traded Symbols on February 2010


                               68
50.00%                                             47.25%
  45.00% 42.29%
  40.00%
  35.00%
                                                                Sales
  30.00%
  25.00%
  20.00%
                                                                Column1
  15.00%
  10.00%
   5.00%
   0.00%               3.69%
                               2.03% 1.92%   2.82%


Analysis

Above graph shows that Top 5 Traded Symbols on Feb 2010. NIFTY Turnover was
275349 crore (42.29%), BANKNIFTY was 24027 (3.69%), MININIFTY was 13219
(2.03), TATAMOTORS was 12471(1.92%), TATASTEEL was 18357 (2.82%), &
0THERS was 307555 (47.25%).

Interpretation

It can be interpreted that The NIFTY are having more trade value compare to others
The F&O are more traded in NSE. Other Four Symbols are important role in the
Future Market


Table: 9 the following table showing the Top 5 Symbols by Open
Interest (number of contracts) on February 2010


                                        69
Symbols           Number          of   Percentage (%)
                      Contract
    NIFTY             642864               34.65%

    MINIFTY           79006                4.26%

    RELIANCE          49335                2.66%

    BHARTIARITEL      44162                2.38%

    ICICIBANK         37054                2.00%

    OTHERS            1003022              54.06%


Graph:14 The following Graph Showing the Top 5 Symbols by Open
Interest (number of contracts) on February 2010


                                 70
120000000.00%


   100000000.00%


    80000000.00%

                                                                Number of   %
    60000000.00%                                                Contracts


    40000000.00%


    20000000.00%

                    34.65%                      54.06%
            0.00%
                                        2.00%
                                 2.66% 2.38%
                             4.26%


 Analysis

 Above graph shows that Top 5 Traded Symbols by open Interest on Feb 2010.
 NIFTY was 642864 (34.65%), MININIFTY was 79006 (4.26%), RELIANCE was
 49335 (2.66%), BHARTIARTEL was 44162(2.38%), ICICI was 37054 (2%) &
 0THERS was 1003022 (54.06%).

 Interpretation

 It can be interpreted that The NIFTY are having more trade value compare to others
 Other Four Symbols are important role in the Future Market


4.5-OPTIONS SEGMENT


                                        71
Table:10 The following table showing the Top 5 Traded Symbols on
 February 2010


      Symbols        Turnover      (Rs   Percentage (%)
                     CR)
      NIFTY          8216393.57          95.26%

      TATASTEEL      5764.04             0.65%

      RELIANCE       4717.45             0.53%

      HINDALCO       3474.30             0.39%

      UNITECH        2815.05             0.32%

      OTHERS         25356.67            2.85%


Graph:15 The following Graph Showing the OPTIONS SEGMENT of
Top 5 Traded Symbols on February 2010


                                  72
120.00%


       100.00%   95.26%


        80.00%                                                          NIF TY

                                                                        TA TA S TE E
                                                                        L
        60.00%                                                          R E L IA NC E

                                                                        HINDA L C O

                                                                        UNITE C H
        40.00%
                                                                        O THE R S


        20.00%


                          0.65%      0.53%        0.39%   0.32% 2.85%
         0.00%
                 NIF TY           R E L IA NC E        UNITE C H
Analysis

Above graph shows that Top 5 Traded Symbols on Option Segment Feb 2010.
NIFTY      was 95.26%, TATASTEEL was 0.65%, RELIANCE was O.53%,
HINDALCO 0.39% , UNITECH was O.32% & 0THERS was 2,85%.

Interpretation

It can be interpreted that The NIFTY are having more trade value compare to others.
The most of the people prefer Nifty Reason is less flexibility. The Nifty are important
Role in the Option Segment


Table:11 The following table showing the Top 5 Symbols by Open
Interest (number of contracts) on February, 2010


                             Call Options


                                                  73
Symbols                    Number            of         Percentage
                                 Contracts                    (%)
      NIFTY                      1394840                      88.48%

      RELIANCE                   23486                        1.49%

      BHARTIARTEL                16283                        1.03%

      SBIN                       9956                         0.63%

      NTPC                       9326                         0.59%

      OTHERS                     122520                       7.77%


Graph:16 The following Graph showing the                         Showing the Top 5
Symbols by Open Interest (number of contracts) on February, 2010


                           Call Option


            100.00% 88.48%
                      88.48%
             80.00%                                              S ales
             60.00%
             40.00%
             20.00%                                 7.77%
                                                      7.77%
                           1.49% 1.03% 0.63% 0.59%
                             1.49% 1.03% 0.63%
              0.00%                            0.59%             C olumn1
                      NIF TY              S B IN


 Analysis

 Above graph shows that Top 5 Traded Symbols by Option Segment (CALL OPTION)
 Feb 2010.      NIFTY was 1394840 (88.48%), RELIANCE was 23486 (1.49%),
 BHARTIARTEL was 16283 (1.03%), SBIN 9956 (0.63%), NTPC was 9326 (0.59%)
 & 0THERS was 122520 (7.77%).


                                           74
Derivatives market in india

Contenu connexe

Tendances

Derivatives - Basics of Derivatives contract covered in this ppt
Derivatives - Basics of Derivatives contract covered in this pptDerivatives - Basics of Derivatives contract covered in this ppt
Derivatives - Basics of Derivatives contract covered in this pptSundar B N
 
Credit rating agencies
Credit rating agenciesCredit rating agencies
Credit rating agenciesAlfred George
 
Secondary market ppt
Secondary market pptSecondary market ppt
Secondary market pptDharmik
 
A project report on overview of indian stock market
A project report on overview of indian stock marketA project report on overview of indian stock market
A project report on overview of indian stock marketProjects Kart
 
Initial Public Offering (IPO)
Initial Public Offering (IPO)Initial Public Offering (IPO)
Initial Public Offering (IPO)Prashant Maharshi
 
Investment avenues in India
Investment avenues in IndiaInvestment avenues in India
Investment avenues in Indiakamal ega
 
New Issue Market
New Issue MarketNew Issue Market
New Issue MarketCma Agarwal
 
Ppt on-money-market-1
Ppt on-money-market-1Ppt on-money-market-1
Ppt on-money-market-1kashish1109
 
Indian capital market
Indian capital marketIndian capital market
Indian capital marketJothi Ram
 
Difference between systematic and unsystematic risk
Difference between systematic and unsystematic riskDifference between systematic and unsystematic risk
Difference between systematic and unsystematic riskSOJIBSABBIR
 
Money market & its instruments
Money market & its instrumentsMoney market & its instruments
Money market & its instrumentsabhishek rane
 
Overview of Indian Financial system
Overview of Indian Financial systemOverview of Indian Financial system
Overview of Indian Financial systemAshish Sahu
 

Tendances (20)

LISTING OF SECURITIES
LISTING OF SECURITIESLISTING OF SECURITIES
LISTING OF SECURITIES
 
Forex ppt
Forex pptForex ppt
Forex ppt
 
Derivative market in india
Derivative market in indiaDerivative market in india
Derivative market in india
 
Derivatives - Basics of Derivatives contract covered in this ppt
Derivatives - Basics of Derivatives contract covered in this pptDerivatives - Basics of Derivatives contract covered in this ppt
Derivatives - Basics of Derivatives contract covered in this ppt
 
Credit rating agencies
Credit rating agenciesCredit rating agencies
Credit rating agencies
 
Secondary market ppt
Secondary market pptSecondary market ppt
Secondary market ppt
 
A project report on overview of indian stock market
A project report on overview of indian stock marketA project report on overview of indian stock market
A project report on overview of indian stock market
 
IPO
IPOIPO
IPO
 
Mutual funds ppt
Mutual funds pptMutual funds ppt
Mutual funds ppt
 
Initial Public Offering (IPO)
Initial Public Offering (IPO)Initial Public Offering (IPO)
Initial Public Offering (IPO)
 
Primary market
Primary marketPrimary market
Primary market
 
Investment avenues in India
Investment avenues in IndiaInvestment avenues in India
Investment avenues in India
 
New Issue Market
New Issue MarketNew Issue Market
New Issue Market
 
Capital market ppt
Capital market pptCapital market ppt
Capital market ppt
 
Ppt on-money-market-1
Ppt on-money-market-1Ppt on-money-market-1
Ppt on-money-market-1
 
Indian capital market
Indian capital marketIndian capital market
Indian capital market
 
Difference between systematic and unsystematic risk
Difference between systematic and unsystematic riskDifference between systematic and unsystematic risk
Difference between systematic and unsystematic risk
 
Money market & its instruments
Money market & its instrumentsMoney market & its instruments
Money market & its instruments
 
Futures and options
Futures and optionsFutures and options
Futures and options
 
Overview of Indian Financial system
Overview of Indian Financial systemOverview of Indian Financial system
Overview of Indian Financial system
 

Similaire à Derivatives market in india

A STUDY ON FINANCIAL DERIVATIVES (FUTURES Amp OPTIONS
A STUDY ON FINANCIAL DERIVATIVES (FUTURES  Amp  OPTIONSA STUDY ON FINANCIAL DERIVATIVES (FUTURES  Amp  OPTIONS
A STUDY ON FINANCIAL DERIVATIVES (FUTURES Amp OPTIONSApril Smith
 
C:\fakepath\ppt unit 1
C:\fakepath\ppt unit 1C:\fakepath\ppt unit 1
C:\fakepath\ppt unit 1incognitorohit
 
A study on hedging effectiveness in index future
A study on hedging effectiveness in index futureA study on hedging effectiveness in index future
A study on hedging effectiveness in index futureKrishnaprabhu Jegadeesan
 
Unit 1-Part 1.docx
Unit 1-Part 1.docxUnit 1-Part 1.docx
Unit 1-Part 1.docxJainJacob12
 
Project_on_Future_of_Derivatives_in_Indi (1).doc
Project_on_Future_of_Derivatives_in_Indi (1).docProject_on_Future_of_Derivatives_in_Indi (1).doc
Project_on_Future_of_Derivatives_in_Indi (1).docMuskan13129
 
Study of Derivative Market In India
Study of Derivative Market In IndiaStudy of Derivative Market In India
Study of Derivative Market In IndiaGRV1993
 
Future of Derivatives in India
Future of Derivatives in IndiaFuture of Derivatives in India
Future of Derivatives in IndiaRatan Deep Singh
 
Project report on currency derivatives2
Project report on currency derivatives2Project report on currency derivatives2
Project report on currency derivatives2Abbott India LTD
 
3 Derivatives In India.pdf
3 Derivatives In India.pdf3 Derivatives In India.pdf
3 Derivatives In India.pdfHasratAli22
 
MMS-Security-Analysis-and-Portfolio-Management-1.docx
MMS-Security-Analysis-and-Portfolio-Management-1.docxMMS-Security-Analysis-and-Portfolio-Management-1.docx
MMS-Security-Analysis-and-Portfolio-Management-1.docxpramav2411
 
IRJET- A Study on Emerging Trends in Indian Derivative Market
IRJET-  	  A Study on Emerging Trends in Indian Derivative MarketIRJET-  	  A Study on Emerging Trends in Indian Derivative Market
IRJET- A Study on Emerging Trends in Indian Derivative MarketIRJET Journal
 
money and capital markets CASES REPORT.pdf
money and capital markets CASES REPORT.pdfmoney and capital markets CASES REPORT.pdf
money and capital markets CASES REPORT.pdfsamuelnyoike07
 
Derivatives kotak 2010
Derivatives kotak 2010Derivatives kotak 2010
Derivatives kotak 2010Naren Goud
 

Similaire à Derivatives market in india (20)

A STUDY ON FINANCIAL DERIVATIVES (FUTURES Amp OPTIONS
A STUDY ON FINANCIAL DERIVATIVES (FUTURES  Amp  OPTIONSA STUDY ON FINANCIAL DERIVATIVES (FUTURES  Amp  OPTIONS
A STUDY ON FINANCIAL DERIVATIVES (FUTURES Amp OPTIONS
 
Security market
Security marketSecurity market
Security market
 
C:\fakepath\ppt unit 1
C:\fakepath\ppt unit 1C:\fakepath\ppt unit 1
C:\fakepath\ppt unit 1
 
Final project on Capital Market
Final project on Capital MarketFinal project on Capital Market
Final project on Capital Market
 
A study on hedging effectiveness in index future
A study on hedging effectiveness in index futureA study on hedging effectiveness in index future
A study on hedging effectiveness in index future
 
Unit 1-Part 1.docx
Unit 1-Part 1.docxUnit 1-Part 1.docx
Unit 1-Part 1.docx
 
Project_on_Future_of_Derivatives_in_Indi (1).doc
Project_on_Future_of_Derivatives_in_Indi (1).docProject_on_Future_of_Derivatives_in_Indi (1).doc
Project_on_Future_of_Derivatives_in_Indi (1).doc
 
Derivatives market
Derivatives marketDerivatives market
Derivatives market
 
Study of Derivative Market In India
Study of Derivative Market In IndiaStudy of Derivative Market In India
Study of Derivative Market In India
 
Future of Derivatives in India
Future of Derivatives in IndiaFuture of Derivatives in India
Future of Derivatives in India
 
Project report on currency derivatives2
Project report on currency derivatives2Project report on currency derivatives2
Project report on currency derivatives2
 
3 Derivatives In India.pdf
3 Derivatives In India.pdf3 Derivatives In India.pdf
3 Derivatives In India.pdf
 
Final yo yo 2
Final yo yo 2Final yo yo 2
Final yo yo 2
 
MMS-Security-Analysis-and-Portfolio-Management-1.docx
MMS-Security-Analysis-and-Portfolio-Management-1.docxMMS-Security-Analysis-and-Portfolio-Management-1.docx
MMS-Security-Analysis-and-Portfolio-Management-1.docx
 
88859133 currency-derivative
88859133 currency-derivative88859133 currency-derivative
88859133 currency-derivative
 
Fm project
Fm projectFm project
Fm project
 
Derivatives in india
Derivatives in indiaDerivatives in india
Derivatives in india
 
IRJET- A Study on Emerging Trends in Indian Derivative Market
IRJET-  	  A Study on Emerging Trends in Indian Derivative MarketIRJET-  	  A Study on Emerging Trends in Indian Derivative Market
IRJET- A Study on Emerging Trends in Indian Derivative Market
 
money and capital markets CASES REPORT.pdf
money and capital markets CASES REPORT.pdfmoney and capital markets CASES REPORT.pdf
money and capital markets CASES REPORT.pdf
 
Derivatives kotak 2010
Derivatives kotak 2010Derivatives kotak 2010
Derivatives kotak 2010
 

Plus de Projects Kart

Organization Study at Saldana Coffee
Organization Study at Saldana CoffeeOrganization Study at Saldana Coffee
Organization Study at Saldana CoffeeProjects Kart
 
Organization Study at Nirani Sugars
Organization Study at Nirani SugarsOrganization Study at Nirani Sugars
Organization Study at Nirani SugarsProjects Kart
 
Organization Study at Gem Sugars
Organization Study at Gem SugarsOrganization Study at Gem Sugars
Organization Study at Gem SugarsProjects Kart
 
Organization Study at Coffee Day
Organization Study at Coffee DayOrganization Study at Coffee Day
Organization Study at Coffee DayProjects Kart
 
A Study on Sugar Industry at Chamundeshwari Sugar
A Study on Sugar Industry at Chamundeshwari SugarA Study on Sugar Industry at Chamundeshwari Sugar
A Study on Sugar Industry at Chamundeshwari SugarProjects Kart
 
Study on Inventory Management at Reid & Taylor (India) Ltd
Study on Inventory Management at Reid & Taylor (India) LtdStudy on Inventory Management at Reid & Taylor (India) Ltd
Study on Inventory Management at Reid & Taylor (India) LtdProjects Kart
 
Study on Working Capital Management at PNB
Study on Working Capital Management at PNBStudy on Working Capital Management at PNB
Study on Working Capital Management at PNBProjects Kart
 
Study on Mutual Fund is the Better Investment Plan
Study on Mutual Fund is the Better Investment PlanStudy on Mutual Fund is the Better Investment Plan
Study on Mutual Fund is the Better Investment PlanProjects Kart
 
Study on Store Environment and Merchandising Mix at Big Bazaar
Study on Store Environment and Merchandising Mix at Big BazaarStudy on Store Environment and Merchandising Mix at Big Bazaar
Study on Store Environment and Merchandising Mix at Big BazaarProjects Kart
 
Initial Public Offers and Due Diligence
Initial Public Offers and Due DiligenceInitial Public Offers and Due Diligence
Initial Public Offers and Due DiligenceProjects Kart
 
Influence of ADR on Underlying Stock Prices
Influence of ADR on Underlying Stock PricesInfluence of ADR on Underlying Stock Prices
Influence of ADR on Underlying Stock PricesProjects Kart
 
Impact of ERP on Organizational Functions in Retail Sector
Impact of ERP on Organizational Functions in Retail SectorImpact of ERP on Organizational Functions in Retail Sector
Impact of ERP on Organizational Functions in Retail SectorProjects Kart
 
The Impact of Creativity and Wow Factor in Advertising
The Impact of Creativity and Wow Factor in AdvertisingThe Impact of Creativity and Wow Factor in Advertising
The Impact of Creativity and Wow Factor in AdvertisingProjects Kart
 
Impact of Advertisements on Investors at HDFC Standard Life Insurance
Impact of Advertisements on Investors at HDFC Standard Life InsuranceImpact of Advertisements on Investors at HDFC Standard Life Insurance
Impact of Advertisements on Investors at HDFC Standard Life InsuranceProjects Kart
 
Impact of Advertising on Customers in Tata Motors
Impact of Advertising on Customers in Tata MotorsImpact of Advertising on Customers in Tata Motors
Impact of Advertising on Customers in Tata MotorsProjects Kart
 
Recruitment and Selection at Aviva Life Insurance
Recruitment and Selection at Aviva Life InsuranceRecruitment and Selection at Aviva Life Insurance
Recruitment and Selection at Aviva Life InsuranceProjects Kart
 
Financial Freedom through Reverse Mortgage
Financial Freedom through Reverse MortgageFinancial Freedom through Reverse Mortgage
Financial Freedom through Reverse MortgageProjects Kart
 
Financial Analysis on Recession Period at M&M Tractors
Financial Analysis on Recession Period at M&M TractorsFinancial Analysis on Recession Period at M&M Tractors
Financial Analysis on Recession Period at M&M TractorsProjects Kart
 
Effective Supply Chain Management as a Strategic Advantage
Effective Supply Chain Management as a Strategic AdvantageEffective Supply Chain Management as a Strategic Advantage
Effective Supply Chain Management as a Strategic AdvantageProjects Kart
 
Brand Awareness of Spencer's and Comparative Analysis with Big Bazaar
Brand Awareness of Spencer's and Comparative Analysis with Big BazaarBrand Awareness of Spencer's and Comparative Analysis with Big Bazaar
Brand Awareness of Spencer's and Comparative Analysis with Big BazaarProjects Kart
 

Plus de Projects Kart (20)

Organization Study at Saldana Coffee
Organization Study at Saldana CoffeeOrganization Study at Saldana Coffee
Organization Study at Saldana Coffee
 
Organization Study at Nirani Sugars
Organization Study at Nirani SugarsOrganization Study at Nirani Sugars
Organization Study at Nirani Sugars
 
Organization Study at Gem Sugars
Organization Study at Gem SugarsOrganization Study at Gem Sugars
Organization Study at Gem Sugars
 
Organization Study at Coffee Day
Organization Study at Coffee DayOrganization Study at Coffee Day
Organization Study at Coffee Day
 
A Study on Sugar Industry at Chamundeshwari Sugar
A Study on Sugar Industry at Chamundeshwari SugarA Study on Sugar Industry at Chamundeshwari Sugar
A Study on Sugar Industry at Chamundeshwari Sugar
 
Study on Inventory Management at Reid & Taylor (India) Ltd
Study on Inventory Management at Reid & Taylor (India) LtdStudy on Inventory Management at Reid & Taylor (India) Ltd
Study on Inventory Management at Reid & Taylor (India) Ltd
 
Study on Working Capital Management at PNB
Study on Working Capital Management at PNBStudy on Working Capital Management at PNB
Study on Working Capital Management at PNB
 
Study on Mutual Fund is the Better Investment Plan
Study on Mutual Fund is the Better Investment PlanStudy on Mutual Fund is the Better Investment Plan
Study on Mutual Fund is the Better Investment Plan
 
Study on Store Environment and Merchandising Mix at Big Bazaar
Study on Store Environment and Merchandising Mix at Big BazaarStudy on Store Environment and Merchandising Mix at Big Bazaar
Study on Store Environment and Merchandising Mix at Big Bazaar
 
Initial Public Offers and Due Diligence
Initial Public Offers and Due DiligenceInitial Public Offers and Due Diligence
Initial Public Offers and Due Diligence
 
Influence of ADR on Underlying Stock Prices
Influence of ADR on Underlying Stock PricesInfluence of ADR on Underlying Stock Prices
Influence of ADR on Underlying Stock Prices
 
Impact of ERP on Organizational Functions in Retail Sector
Impact of ERP on Organizational Functions in Retail SectorImpact of ERP on Organizational Functions in Retail Sector
Impact of ERP on Organizational Functions in Retail Sector
 
The Impact of Creativity and Wow Factor in Advertising
The Impact of Creativity and Wow Factor in AdvertisingThe Impact of Creativity and Wow Factor in Advertising
The Impact of Creativity and Wow Factor in Advertising
 
Impact of Advertisements on Investors at HDFC Standard Life Insurance
Impact of Advertisements on Investors at HDFC Standard Life InsuranceImpact of Advertisements on Investors at HDFC Standard Life Insurance
Impact of Advertisements on Investors at HDFC Standard Life Insurance
 
Impact of Advertising on Customers in Tata Motors
Impact of Advertising on Customers in Tata MotorsImpact of Advertising on Customers in Tata Motors
Impact of Advertising on Customers in Tata Motors
 
Recruitment and Selection at Aviva Life Insurance
Recruitment and Selection at Aviva Life InsuranceRecruitment and Selection at Aviva Life Insurance
Recruitment and Selection at Aviva Life Insurance
 
Financial Freedom through Reverse Mortgage
Financial Freedom through Reverse MortgageFinancial Freedom through Reverse Mortgage
Financial Freedom through Reverse Mortgage
 
Financial Analysis on Recession Period at M&M Tractors
Financial Analysis on Recession Period at M&M TractorsFinancial Analysis on Recession Period at M&M Tractors
Financial Analysis on Recession Period at M&M Tractors
 
Effective Supply Chain Management as a Strategic Advantage
Effective Supply Chain Management as a Strategic AdvantageEffective Supply Chain Management as a Strategic Advantage
Effective Supply Chain Management as a Strategic Advantage
 
Brand Awareness of Spencer's and Comparative Analysis with Big Bazaar
Brand Awareness of Spencer's and Comparative Analysis with Big BazaarBrand Awareness of Spencer's and Comparative Analysis with Big Bazaar
Brand Awareness of Spencer's and Comparative Analysis with Big Bazaar
 

Dernier

Organizational Structure Running A Successful Business
Organizational Structure Running A Successful BusinessOrganizational Structure Running A Successful Business
Organizational Structure Running A Successful BusinessSeta Wicaksana
 
Call Girls In Sikandarpur Gurgaon ❤️8860477959_Russian 100% Genuine Escorts I...
Call Girls In Sikandarpur Gurgaon ❤️8860477959_Russian 100% Genuine Escorts I...Call Girls In Sikandarpur Gurgaon ❤️8860477959_Russian 100% Genuine Escorts I...
Call Girls In Sikandarpur Gurgaon ❤️8860477959_Russian 100% Genuine Escorts I...lizamodels9
 
Marketplace and Quality Assurance Presentation - Vincent Chirchir
Marketplace and Quality Assurance Presentation - Vincent ChirchirMarketplace and Quality Assurance Presentation - Vincent Chirchir
Marketplace and Quality Assurance Presentation - Vincent Chirchirictsugar
 
Contemporary Economic Issues Facing the Filipino Entrepreneur (1).pptx
Contemporary Economic Issues Facing the Filipino Entrepreneur (1).pptxContemporary Economic Issues Facing the Filipino Entrepreneur (1).pptx
Contemporary Economic Issues Facing the Filipino Entrepreneur (1).pptxMarkAnthonyAurellano
 
BEST Call Girls In Old Faridabad ✨ 9773824855 ✨ Escorts Service In Delhi Ncr,
BEST Call Girls In Old Faridabad ✨ 9773824855 ✨ Escorts Service In Delhi Ncr,BEST Call Girls In Old Faridabad ✨ 9773824855 ✨ Escorts Service In Delhi Ncr,
BEST Call Girls In Old Faridabad ✨ 9773824855 ✨ Escorts Service In Delhi Ncr,noida100girls
 
2024 Numerator Consumer Study of Cannabis Usage
2024 Numerator Consumer Study of Cannabis Usage2024 Numerator Consumer Study of Cannabis Usage
2024 Numerator Consumer Study of Cannabis UsageNeil Kimberley
 
Global Scenario On Sustainable and Resilient Coconut Industry by Dr. Jelfina...
Global Scenario On Sustainable  and Resilient Coconut Industry by Dr. Jelfina...Global Scenario On Sustainable  and Resilient Coconut Industry by Dr. Jelfina...
Global Scenario On Sustainable and Resilient Coconut Industry by Dr. Jelfina...ictsugar
 
Independent Call Girls Andheri Nightlaila 9967584737
Independent Call Girls Andheri Nightlaila 9967584737Independent Call Girls Andheri Nightlaila 9967584737
Independent Call Girls Andheri Nightlaila 9967584737Riya Pathan
 
8447779800, Low rate Call girls in New Ashok Nagar Delhi NCR
8447779800, Low rate Call girls in New Ashok Nagar Delhi NCR8447779800, Low rate Call girls in New Ashok Nagar Delhi NCR
8447779800, Low rate Call girls in New Ashok Nagar Delhi NCRashishs7044
 
APRIL2024_UKRAINE_xml_0000000000000 .pdf
APRIL2024_UKRAINE_xml_0000000000000 .pdfAPRIL2024_UKRAINE_xml_0000000000000 .pdf
APRIL2024_UKRAINE_xml_0000000000000 .pdfRbc Rbcua
 
Market Sizes Sample Report - 2024 Edition
Market Sizes Sample Report - 2024 EditionMarket Sizes Sample Report - 2024 Edition
Market Sizes Sample Report - 2024 EditionMintel Group
 
Annual General Meeting Presentation Slides
Annual General Meeting Presentation SlidesAnnual General Meeting Presentation Slides
Annual General Meeting Presentation SlidesKeppelCorporation
 
BEST Call Girls In Greater Noida ✨ 9773824855 ✨ Escorts Service In Delhi Ncr,
BEST Call Girls In Greater Noida ✨ 9773824855 ✨ Escorts Service In Delhi Ncr,BEST Call Girls In Greater Noida ✨ 9773824855 ✨ Escorts Service In Delhi Ncr,
BEST Call Girls In Greater Noida ✨ 9773824855 ✨ Escorts Service In Delhi Ncr,noida100girls
 
8447779800, Low rate Call girls in Kotla Mubarakpur Delhi NCR
8447779800, Low rate Call girls in Kotla Mubarakpur Delhi NCR8447779800, Low rate Call girls in Kotla Mubarakpur Delhi NCR
8447779800, Low rate Call girls in Kotla Mubarakpur Delhi NCRashishs7044
 
NewBase 19 April 2024 Energy News issue - 1717 by Khaled Al Awadi.pdf
NewBase  19 April  2024  Energy News issue - 1717 by Khaled Al Awadi.pdfNewBase  19 April  2024  Energy News issue - 1717 by Khaled Al Awadi.pdf
NewBase 19 April 2024 Energy News issue - 1717 by Khaled Al Awadi.pdfKhaled Al Awadi
 
Case study on tata clothing brand zudio in detail
Case study on tata clothing brand zudio in detailCase study on tata clothing brand zudio in detail
Case study on tata clothing brand zudio in detailAriel592675
 
FULL ENJOY Call girls in Paharganj Delhi | 8377087607
FULL ENJOY Call girls in Paharganj Delhi | 8377087607FULL ENJOY Call girls in Paharganj Delhi | 8377087607
FULL ENJOY Call girls in Paharganj Delhi | 8377087607dollysharma2066
 
Digital Transformation in the PLM domain - distrib.pdf
Digital Transformation in the PLM domain - distrib.pdfDigital Transformation in the PLM domain - distrib.pdf
Digital Transformation in the PLM domain - distrib.pdfJos Voskuil
 
Call US-88OO1O2216 Call Girls In Mahipalpur Female Escort Service
Call US-88OO1O2216 Call Girls In Mahipalpur Female Escort ServiceCall US-88OO1O2216 Call Girls In Mahipalpur Female Escort Service
Call US-88OO1O2216 Call Girls In Mahipalpur Female Escort Servicecallgirls2057
 

Dernier (20)

Organizational Structure Running A Successful Business
Organizational Structure Running A Successful BusinessOrganizational Structure Running A Successful Business
Organizational Structure Running A Successful Business
 
Call Girls In Sikandarpur Gurgaon ❤️8860477959_Russian 100% Genuine Escorts I...
Call Girls In Sikandarpur Gurgaon ❤️8860477959_Russian 100% Genuine Escorts I...Call Girls In Sikandarpur Gurgaon ❤️8860477959_Russian 100% Genuine Escorts I...
Call Girls In Sikandarpur Gurgaon ❤️8860477959_Russian 100% Genuine Escorts I...
 
Marketplace and Quality Assurance Presentation - Vincent Chirchir
Marketplace and Quality Assurance Presentation - Vincent ChirchirMarketplace and Quality Assurance Presentation - Vincent Chirchir
Marketplace and Quality Assurance Presentation - Vincent Chirchir
 
Contemporary Economic Issues Facing the Filipino Entrepreneur (1).pptx
Contemporary Economic Issues Facing the Filipino Entrepreneur (1).pptxContemporary Economic Issues Facing the Filipino Entrepreneur (1).pptx
Contemporary Economic Issues Facing the Filipino Entrepreneur (1).pptx
 
BEST Call Girls In Old Faridabad ✨ 9773824855 ✨ Escorts Service In Delhi Ncr,
BEST Call Girls In Old Faridabad ✨ 9773824855 ✨ Escorts Service In Delhi Ncr,BEST Call Girls In Old Faridabad ✨ 9773824855 ✨ Escorts Service In Delhi Ncr,
BEST Call Girls In Old Faridabad ✨ 9773824855 ✨ Escorts Service In Delhi Ncr,
 
2024 Numerator Consumer Study of Cannabis Usage
2024 Numerator Consumer Study of Cannabis Usage2024 Numerator Consumer Study of Cannabis Usage
2024 Numerator Consumer Study of Cannabis Usage
 
Global Scenario On Sustainable and Resilient Coconut Industry by Dr. Jelfina...
Global Scenario On Sustainable  and Resilient Coconut Industry by Dr. Jelfina...Global Scenario On Sustainable  and Resilient Coconut Industry by Dr. Jelfina...
Global Scenario On Sustainable and Resilient Coconut Industry by Dr. Jelfina...
 
Independent Call Girls Andheri Nightlaila 9967584737
Independent Call Girls Andheri Nightlaila 9967584737Independent Call Girls Andheri Nightlaila 9967584737
Independent Call Girls Andheri Nightlaila 9967584737
 
8447779800, Low rate Call girls in New Ashok Nagar Delhi NCR
8447779800, Low rate Call girls in New Ashok Nagar Delhi NCR8447779800, Low rate Call girls in New Ashok Nagar Delhi NCR
8447779800, Low rate Call girls in New Ashok Nagar Delhi NCR
 
APRIL2024_UKRAINE_xml_0000000000000 .pdf
APRIL2024_UKRAINE_xml_0000000000000 .pdfAPRIL2024_UKRAINE_xml_0000000000000 .pdf
APRIL2024_UKRAINE_xml_0000000000000 .pdf
 
Market Sizes Sample Report - 2024 Edition
Market Sizes Sample Report - 2024 EditionMarket Sizes Sample Report - 2024 Edition
Market Sizes Sample Report - 2024 Edition
 
Annual General Meeting Presentation Slides
Annual General Meeting Presentation SlidesAnnual General Meeting Presentation Slides
Annual General Meeting Presentation Slides
 
BEST Call Girls In Greater Noida ✨ 9773824855 ✨ Escorts Service In Delhi Ncr,
BEST Call Girls In Greater Noida ✨ 9773824855 ✨ Escorts Service In Delhi Ncr,BEST Call Girls In Greater Noida ✨ 9773824855 ✨ Escorts Service In Delhi Ncr,
BEST Call Girls In Greater Noida ✨ 9773824855 ✨ Escorts Service In Delhi Ncr,
 
Corporate Profile 47Billion Information Technology
Corporate Profile 47Billion Information TechnologyCorporate Profile 47Billion Information Technology
Corporate Profile 47Billion Information Technology
 
8447779800, Low rate Call girls in Kotla Mubarakpur Delhi NCR
8447779800, Low rate Call girls in Kotla Mubarakpur Delhi NCR8447779800, Low rate Call girls in Kotla Mubarakpur Delhi NCR
8447779800, Low rate Call girls in Kotla Mubarakpur Delhi NCR
 
NewBase 19 April 2024 Energy News issue - 1717 by Khaled Al Awadi.pdf
NewBase  19 April  2024  Energy News issue - 1717 by Khaled Al Awadi.pdfNewBase  19 April  2024  Energy News issue - 1717 by Khaled Al Awadi.pdf
NewBase 19 April 2024 Energy News issue - 1717 by Khaled Al Awadi.pdf
 
Case study on tata clothing brand zudio in detail
Case study on tata clothing brand zudio in detailCase study on tata clothing brand zudio in detail
Case study on tata clothing brand zudio in detail
 
FULL ENJOY Call girls in Paharganj Delhi | 8377087607
FULL ENJOY Call girls in Paharganj Delhi | 8377087607FULL ENJOY Call girls in Paharganj Delhi | 8377087607
FULL ENJOY Call girls in Paharganj Delhi | 8377087607
 
Digital Transformation in the PLM domain - distrib.pdf
Digital Transformation in the PLM domain - distrib.pdfDigital Transformation in the PLM domain - distrib.pdf
Digital Transformation in the PLM domain - distrib.pdf
 
Call US-88OO1O2216 Call Girls In Mahipalpur Female Escort Service
Call US-88OO1O2216 Call Girls In Mahipalpur Female Escort ServiceCall US-88OO1O2216 Call Girls In Mahipalpur Female Escort Service
Call US-88OO1O2216 Call Girls In Mahipalpur Female Escort Service
 

Derivatives market in india

  • 1. 1-INTRODUCTION: Among all the innovations that have flooded the international financial markets, financial derivatives occupy the driver's seat. These specialized instruments facilitate the shuffling and redistribution of the risks that an investor faces. Thus aids in the process of diversifying ones portfolio. The volatility in the equity markets over the past years has resulted in greater use of equity derivatives. The volume of the exchange traded equity futures and options in most of the mature markets have seen a significant growth. It goes beyond that the local derivative in the emerging markets have witnessed widespread use of the derivative instrument for a variety of reasons. This continuous growth and development by the emerging market participants has resulted in capital inflows as well as helped the investors in risk protection through hedging. Derivatives trading commenced in India in June 2000 after SEBI granted the approval to this effect in May 2000. SEBI permitted the derivative trading on two stock exchanges, i.e. and BSE, and NSE, their clearing house/corporation to commence trading and settlement in approved derivative contracts. Begin with SEBI’s approved trading in index futures contracts based on S&P CNX Nifty Index and BSE-30 (Sensex) Index. This was followed by approval for trading in options based on these two indices and options on individual securities. The trading in index options commenced in June 2001 and trading in options on individual securities would commence in July 2000. While trading in futures of individual stocks started from November 2001. In June 2003, SEBI and/RBI approved the trading on interest rate derivative instruments only in NSE. Introduced trading of interest rate futures contracts on June 24, 2003 on 91-day Notional T-Bills and 10-year Notional 6% coupon bearing as well as zero coupon Bonds. Futures and Options were also introduced on CNX IT Index in August 2003. The total exchange traded derivatives witnessed a value of Rs.5, 423, 333 million during 2002-03 as against Rs. 1,038,480 million during the preceding year. While NSE accounted for about 99.5% of total turnover, BSE accounted for less than 1% in2002-03. The market witnessed higher trading levels from June 2001 with introduction of index options, and still higher volumes with the introduction of stock options in July 2001. In the year 2002 has been a remarkable year for the global derivatives market. This year witnessed NSE making huge strides and also moved upward in the global ranking. According to the Futures Industry Associations in the year 2002, NSE ranked 30th in the global futures and options volume, whereas it ranks 2nd in the world, in terms of stock futures. 1
  • 2. Securities and exchange Board of India (SEBI) signed a memorandum of understanding (MOU) with United States Commodity Futures Trading Commission (CFTC) in Washington on April 28, 2004. The MOU was signed by Mr. G. N. Bajpal, Chairman, SEBI and Mr. James E.Newsome, Chairman, CFTC. The MOU aims to strengthen communication channels and establish a framework for assistance and mutual cooperation between the two organizations. The MOU marks the beginning of greater collaboration between SEBI and CFTC too effectively Regulate and develop futures markets, in view of greater cross-border trade and cross- market linkages brought about by the globalization of financial markets. The two authorities intend to consult periodically about matters of mutual interest in order to promote cooperation and market Integrity and to further the protection of futures and options market participants. In furtherance of the objective of promoting the development of futures and options regulatory mechanisms would also provide technical assistance for development of futures markets in India. In India, the statutory, basis for regulating commodity futures’ trading is found in the Forward Contracts (Regulation) Act. 1952, which (apart from being an enabling enactment, laying down certain fundamental ground rules) created the permanent regulatory body known as the Forwards Markets Commission. This commission holds overall charge of the regulation of all forward contracts and carries out its functions through recognized association. Too much regulation and too little regulation are both bad in respect of these markets. Too much regulation will have a throttling effect and prevent the entry and growth of the market. Too little regulation will lead to lack of enough protection to investors and fear of failures in the market. The role of regulator has many objectives the purpose of regulation is to protect the interests of investors, infuse confidence in the market and prevents unfair trade practices. 2
  • 3. 1.2-STATEMENT OF PROBLEM  The study analyses Various Derivatives Used to Minimise Risk in Indian Capital Market.  It foresees the difficulties facial to choose the underlying assets in the derivatives and to analyze the current scenario of Derivative markets in India 1.3-OBJECTIVES OF THE STUDY 1. To understand the concept and to study the current scenario of derivatives market in India. 2. To analyze whether the purpose for which derivatives are used has been actually achieved or not 3. To study the purpose for which financial institutions adopt derivatives 4. To know pricing of derivatives. 5. To know about future of derivative trading in India 6. To find the growth of derivatives in India 7. To suggest suitable methods based on the observations of the study 1.4-Data collection: The study is exclusively based on secondary data. Secondary data is collected from various sources such as text books, reports, annual reports of various organisations , research articles, papers presented at various national and international seminars, conferences, workshops etc., Secondary data was also used to to conceptualise the term risk and the degree of risk involved. This apart of Websites of companies, Stock exchanges, NSE and BSE were used. Newspaper such as Economic Times, Business Line, Magazines such as Business World and Capital Market were also used. 3
  • 4. 1.5-PLAN OF ANALYSIS TECHNIQUE The collected data has been carefully classified, tabulated and interpreted on the basis of which, tables, charts and graphs are drawn .Percentages are drawn from the tabulated frequencies and the data should be analyzed. The analysis of data helped in drawing inferences and better understanding, charts are plotted. 1.6-SCOPE OF THE STUDY  Derivative deals with equity, derivatives, mutual funds, etc. in this we are find out which is the once is best and analyze the customer awareness in derivatives Market and it also covers the recent changes in derivatives Market.  It gives the information about Forward, Future Option, & swaps. It gives more concentrate on how Securities traded in derivative markets 1.7- LIMITATIONS OF THE STUDY The study was carried out only on secondary information and it is carried out only for a short period of three months hence the findings of the study cannot be generalized. 4
  • 5. Theoretical Review of Literature 2-DERIVATIVES With the opening of the economy to multinational and the adoption of the liberalized economic policies the economy is driven more towards the free market economy. The complex nature of the financial structuring is self involves the utilization of multicurrency transaction. It exposes the clients, particularly corporate clients to various risks such as exchange rate risk, interest risk, economic risk & political risk In the present state of the economy there is an imperative need for the corporate clients to protect their operating profits by shifting some of the uncontrollable financial risk to those who are able bear and manage them. Thus, risk management becomes a must for survival since there is a high volatility in the present’s financial markets In the context, derivatives occupy an important place as a risk reducing machinery. Derivatives are useful to reduce many of the risks. In fact, the financial service companies can play a very dynamic role in dealing with such risk. They can ensure that the above risks are hedged by using derivatives like forwards, futures, options, swaps In a broad sense, many commonly used instruments can be called derivatives since they derive their value from underlying assets. For instance, equity share its self is a derivatives, since it derives its value from the underlying assets. Similarly one takes an insurance against his house covering all risks DEFINITION Derivatives are the financial instruments, which derive their value from some other financial instruments, called the underlying. The foundation of all derivatives market is the underlying market, which could be spot market for gold, or it could be a pure number such as the level of the wholesale price index of a market price. A derivative is a financial instrument whose value depends on the Value of other basic underlying variables. “John c hull” 5
  • 6. According to the Securities Contract (Regulation) Act, 1956, derivatives include: • A security derived from a debt instrument, share, and loan whether secured or unsecured, risk instrument or contract for differences or any other form of Security. • A contract, which derives its value from the prices or index of prices of underlying securities. Therefore, derivatives are specialized contracts to facilitate temporarily for hedging which is protection against losses resulting from unforeseen price or volatility changes. Thus, derivatives are a very important tool of risk management. Derivatives perform a number of economic functions like price discovery, risk transfer and market completion. The simplest kind of derivative market is the forward market. Here a buyer and seller write a contract for delivery at a specific future date and a specified future price. In India, a forward market exists in the form of the dollar- rupee market. But forward market suffers from two serious problems; Counter party risk resulting in comparatively high rate of contract noncompliance And poor liquidity. Futures markets were invented to cope with these two difficulties of forward markets. Futures are standardized forward contracts traded on an organized stock exchange. In essence, a future contract is a derivative instrument whose value is derived from the expected price of the underlying security or asset or index at a pre-determined future date. Derivatives are financial contracts that are designed to create market price exposure to changes in an underlying commodity, asset or event. In general they do not involve the exchange or transfer of principal or title. Rather their purpose is to capture, in the form of price changes, some underlying price change or event. The term derivative refers to how the prices of these contracts are derived from the price of some underlying security or commodity or from some index, interest rate, exchange rate or event. Examples of derivatives include futures, forwards, options and swaps, and these can be combined with each other or traditional securities and loans in order to create hybrid instruments or structured securities 6
  • 7. 2.1- Players of trading in Futures & Option The minimum quantity trade in is one market lot. The market lot is different for on NSE Derivatives stocks/index. Time to time list will keep changing CNXIT ICICI Oriental Bank NIFTY Infosys PNB ACC IOC Polaris Andhra Bank MTNL Ranbaxy Bajaj Auto ONGC Wipro Bank of Baroda Nalco REL Bank of India Tisco Union Bank BEL M&M TCS Bank of India Maruti Tata TEA HCL Tech Grasim Ind ITC BHEL IPCL RIL BPCL Hero Honda i-flex Canada Bank HDFC Bank HPCL Cipla HLL Tata Power GAIL Hindalco Gujarat Abuja 7
  • 8. 2.2-DERIVATIVES IN INDIA A derivative is a security or contract designed in such a way that its price is derived from the price of an underlying asset. For instance, the price of a gold futures contract for October maturity is derived from the price of gold. Changes in the price of the underlying asset affect the price of the derivative security in a predictable way. The term derivatives can simply be understood as those items that do not have their own independent values. Rather they have derived values. Derivatives have a significant place in finance and risk management. A Derivative is financial instrument whose pay-off is derived from some other asset which is called an underlying asset. Evolution of derivatives In the 17th century, in Japan, the rice was been grown abundantly; later the trade in rice grew and evolved to the stage where receipts for future delivery were traded with a high degree of standardization. This led to forward trading. In 1730, the market received official recognition from the “Tokugawa Shogunate” (the ruling clan of shoguns or feudal lords). The Dojima rice market can thus be regarded as the first futures market, in the sense of an organized exchange with standardized trading terms. The first futures markets in the Western hemisphere were developed in the United States in Chicago. These markets had started as spot markets and gradually evolved into futures trading. This evolution occurred in stages. The first stage was the starting of agreements to buy grain in the future at a pre-determined price with the intension of actual delivery. Gradually these contracts became transferable and over a period of time, particularly delivery of the physical produce. Traders found that the agreements were easier to buy and sell if they were standardized in terms of quality of grain, market lot and place of delivery. This is how modern futures contracts first came into being. The Chicago Board of Trade (CBOT) which opened in 1848 is, to this day the largest futures market in the world. 8
  • 9. 2.3 Kinds of financial derivatives 1) Forwards 2) Futures 3) Options 4) Swaps 1) Forwards A forward contract refers to an agreement between two parties, to exchange an agreed quantity of an asset for cash at a certain date in future at a predetermined price specified in that agreement. The promised asset may be currency, commodity, instrument etc, In a forward contract, a user (holder) who promises to buy the specified asset at an agreed price at a future date is said to be in the ‘long position’. On the other hand, the user who promises to sell at an agreed price at a future date is said to be in ‘short position’. 2) Futures A futures contract represents a contractual agreement to purchase or sell a specified asset in the future for a specified price that is determined today. The underlying asset could be foreign currency, a stock index, a treasury bill or any commodity. The specified price is known as the future price. Each contract also specifies the delivery month, which may be nearby or more deferred in time. The undertaker in a future market can have two positions in the contract: - a) Long position is when the buyer of a futures contract agrees to purchase the underlying asset. b) Short position is when the seller agrees to sell the asset. Futures contract represents an institutionalized, standardized form of forward contracts. They are traded on an organized exchange, which is a physical place of trading floor where listed contract are traded face to face. A futures trade will result in a futures contract between 2 sides- someone going long at a negotiated price and someone going short at that same price. Thus, if there were no transaction costs, futures trading would represent a ‘Zero sum game’ what one side wins, which exactly match what the other side loses. 9
  • 10. Types of futures contracts a) Agricultural futures contracts: These contracts are traded in grains, oil, livestock, forest products, textiles and foodstuff. Several different contracts and months for delivery are available for different grades or types of commodities in question. The contract months depend on the seasonality and trading activity. b) Metallurgical futures contract:- This category includes genuine metal and petroleum contracts. Among the metals, contracts are traded in  gold,  silver,  platinum and  Copper. Of the petroleum products, only heating oil, crude oil and gasoline is traded. c) Interest rate futures contract These contracts are traded on treasury bills, notes, bonds, and banks certification of deposit, as well as Eurodollar. d) Foreign exchange futures contract These contracts are trade in the British Pound, the Canadian Dollar, the Japanese Yen, the Swiss Franc and the Deutsche Mark. Contracts are also listed on French Francs, Dutch Guilders and the Mexican Peso, but these have met with only limited success. 1) Options An option contract is a contract where it confers the buyer, the right to either buy or to sell an underlying asset (stock, bond, currency, and commodity) etc. at a predetermined price, on or before a specified date in the future. The price so predetermined is called the ‘Strike price’ or ‘Exercise price’. Depending on the contract terms, an option may be exercisable on any date during a specified period or it may be exercisable only on the final or expiration date of the period covered by the option contract. 10
  • 11. Option Premium In return for the guaranteeing the exercise of an option at its strike price, the option seller or writer charges a premium, which the buyer usually pays upfront. Under favorable circumstances the buyer may choose to exercise it. Alternatively, the buyer may be allowed to sell it. If the option expires without being exercised, the buyer receives no compensation for the premium paid. Writer In an option contract, the seller is usually referred to as “writer”, since he is said to write the Contract. If an option can be excised on any date during its lifetime it is called an American Option. However, if it can be exercised only on its expiration date, it is called an European Option. Option instruments a) Call Option A Call Option is one, which gives the option holder the right to “buy” an underlying asset at a pre-determined price. b) Put Option A put option is one, which gives the option holder the right to “sell” an underlying asset at a pre-determined price on or before the specified date in the future. c) Double Option A Double Option is one, which gives the Option holder both the right to “buy” and “sell” Underlying asset at a pre-determined price on or before a specified date in the future. 2) SWAPS A SWAP transaction is one where two or more parties exchange (swap) one pre- determined Payment for another. There are three main types of swaps:- a) Interest Rate swap An Interest Rate swap is an agreement between 2 parties to exchange interest obligations or Receipts in the same currency on an agreed amount of notional principal for an agreed period of time. 11
  • 12. b) Currency swap A currency swap is an agreement between two parties to exchange payments or receipts in One currency for payment or receipts of another. c) Commodity swap A commodity swap is an arrangement by which one party (a commodity user/buyer) agrees to Pay a fixed price for a designated quantity of a commodity to the counter party (commodity producer/seller), who in turn pays the first party a price based on the prevailing market price (or an accepted index thereof) for the same quantity. Derivatives are financial instruments whose values depend on the values of other, more basic underlying assets. Exchange traded financial derivatives were introduced in India in June 2000 at the two major stock exchanges, NSE and BSE. Derivatives are used by : 1. Hedgers: For protecting against adverse movement. Hedging is a mechanism to reduce price risk inherent in open positions. Derivatives are widely used for hedging. A Hedge can help lock in existing profits. Its purpose is to reduce the volatility of a portfolio, by reducing the risk. 2. Speculators: To make quick fortune by anticipating/forecasting future market movements. Hedgers wish to eliminate or reduce the price risk to which they are already exposed. Speculators, on the other hand are those class of investors who willingly take price risks to profit from price changes in the underlying. While the need to provide hedging avenues by means of derivative instruments is laudable, it calls for the existence of speculative traders to play the role of counter-party to the hedgers. It is for this reason that the role of speculators gains prominence in a derivatives market. 3. Arbitrageurs: To earn risk-free profits by exploiting market imperfections. Arbitrageurs profit from price differential existing in two markets by simultaneously operating in the two different markets. 12
  • 13. 2.4 DERIVATIVE MARKET IN INDIA An important step towards introduction of derivatives trading in India was the Promulgation of the Securities Laws (Amendment) Ordinance, 1995, which lifted the Prohibition on "options in securities" (NSEIL, 2001). However, since there was no Regulatory framework to govern trading of securities, the market could not develop. SEBI Set up a committee in November 1996 under the chairmanship of Dr. L.C. Gupta to Develop appropriate regulatory framework for derivatives trading. The committee suggested that if derivatives could be declared as "securities" under SCRA, the appropriate regulatory framework of "securities" could also govern trading of derivatives. SEBI also set up a group under the chairmanship of Prof. J.R. Varma in 1998 to recommend risk containment measures for derivatives trading. The Government decided that a legislative amendment in the securities laws was necessary to provide a legal framework for derivatives trading in India. Consequently, the Securities Contracts (Regulation) Amendment Bill 1998 was introduced in the LokSabha on 4th July 1998 and was referred to the Parliamentary Standing Committee on Finance for examination and report thereon. The Bill suggested that derivatives may be included in the definition of "securities" in the SCRA whereby trading in derivatives may be possible within the framework of that Act. The said Committee submitted the report on 17th March 1999. The Committee was of the opinion that the introduction of derivatives, if implemented, with proper safeguards and risk containment measures, will certainly give a fillip to the sagging market, result in enhanced investment activity and instill greater confidence among investors/participants. The Committee was of the view that since cash settled contracts could be classified as "wagering agreements" which can be null and void under Section 30 of the Indian Contracts Act, 1872, and since index futures are always cash settled, such futures contracts can be entangled in legal controversy. The Committee, therefore, suggested an overriding provision as a matter of abandoned caution- "Notwithstanding anything contained in any other Act, contracts in derivatives as per the SCRA shall be legal and valid". Further, since Committee was convinced that stock exchanges would be better equipped to undertake trading in derivatives in sophisticated environment it would be prudent to allow trading in derivatives by such stock exchanges only. The Committee, therefore, suggested a clause- "The derivative shall be traded and settled on stock exchanges and clearing houses of the stock exchanges, respectively in accordance with the rules and bye-laws of the stock exchange". The Proposed Bill, which 13
  • 14. incorporated the recommendations of the said Parliamentary Committee, was finally enacted in December 1999. Equity Derivatives in India  Equity index futures are the most widely traded futures contract while single stock futures on the whole contribute to a larger percentage of the traded volumes  Equity index options are the most widely traded options contract in the exchange  FII’s are very active in the equity derivative markets in India . Retail presence is also high in the equity derivative market Interest Rate and Currency Derivatives in India  The market for Overnight Index Swaps (OIS) is the most active interest rate derivative  OIS is based on the overnight call money benchmark, NSE Mibor  Other interest rate derivatives include swaps on government bond benchmarks Currency derivatives is dominated by forward market though options are picking up 2.5-DERIVATIVES PRODUCTS LEGALLY PERMITTED TO BE TRADED IN INDIAN 1. Equity Derivatives (Index/stock futures/options) - Legally permitted to be traded through stock exchanges approved by SEBI 2. Commodity Trading - Commodity futures are permitted. Commodity futures permitted only for trading in commodities approved by the Government in Commodity Exchanges recognized by Forward Markets Commission. Option contracts in commodities trading are not permitted. 3. Foreign Exchange Derivatives - Forward Contracts as approved by RBI permitted to be transacted by Banks and other approved foreign-exchange dealers. 4. OTC rupee derivatives in the form of Forward Rate Agreements (FRAs)/Interest Rate Swaps (IRS) - These were introduced by RBI in India in July 1999 in terms powers vested with it Foreign Exchange Management Act, 2000. These derivatives enable banks, primary dealers (PDs) and all-India financial institutions (FIs) to hedge interest 14
  • 15. 5. Rate risk for their own balance sheet management and for market-making purposes. Banks/PDs/FIs can undertake different types of plain vanilla FRAs/IRS. Swaps having explicit/implicit option features such as caps/floors/collars are not permitted now. 6. Exchange Traded Interest Rate Derivatives were introduced by RBI/SEBI during June, 2003. These can be traded through stock exchanges by primary dealers subject to conditions stipulated by RBI. OTC Rupee derivatives are presently not permitted. 2.6-CATEGORIES OF DERIVATIVES TRADED IN INDIA 1. Commodities Futures for Coffee, Oil Seeds, Oil (Castor, Palmolein), Pepper, Cotton, Jute and Jute Goods are traded in the Commodities Futures. Forward Markets Commission regulates the trading of commodities futures. 2. Index futures based on Sensex and Nifty Index are also traded under the supervision of SEBI. 3. RBI has permitted Banks, FIs and PDs to enter into forward rate agreement (FRAs)/interest rate swaps in order to facilitate hedging of interest rate risks and ensuring orderly development of the derivatives market 4. NSE became the first exchange to launch trading in options on individual securities. Trading in options on individual securities commenced from July 2, 2001. Option contracts are American style and cash settled and are available on 41 securities stipulated by the Securities & Exchange Board of India (SEBI) 5. NSE commenced trading in futures on individual securities on November 9, 2001. The futures contracts are available on 41 securities stipulated by the Securities & Exchange Board of India (SEBI).BSE also has started trading in individual stock options & futures (both Index & Stocks) around the same time as NSE. 15
  • 16. 2.7-Trading Strategies of Derivatives • Buy downside put as insurance when long stocks • Sell upside call to collect premium when upside is limited • Buy call spread expecting limited upside • Buy put spread expecting limited downside • Buy strangle or straddle expecting volatility ahead • Synthetic short – buy put sell call • Most PMs buy options not sell Trading Strategies Buy Straddle • Buy both ATM call and put • Max gain: unlimited • Max loss: time decay (theta) • Buy gamma and kappa, pay theta • Short dated straddle – buy more gamma • Long dated straddle – buy more kappa Trading Strategies Buy strangle • Buy both OTM call and put • Max gain: unlimited • Max loss: time decay, theta • You buy gamma and kappa, earn theta • Short dated strangle – buy more gamma • Long dated strangle – buy more kappa • Diversify your risk comparing to straddle and cheaper 16
  • 17. Trading Strategies John Murphy is a very popular author, columnist, and speaker on the subject of StockCharts.com is very glad to include his trading in our educational material. If you find this information useful, please visit the Murphy Morris web site for additional examples of John's insight.  Buy downside put as insurance when long stocks  Sell upside call to collect premium when upside is limited  Buy call spread expecting limited upside  Buy put spread expecting limited downside  Buy strangle or straddle expecting volatility ahead  Synthetic short – buy put sell call Buy call option  Expecting more upside 17
  • 18. Sell put option  Expecting limited downside 2.8-Derivative Based Instruments  Derivative Instruments are instruments at which their values are derived from the value of an underlying physical or financial assets  Derivative Instruments include: Forward Contracts Futures Contracts Salam Contracts Swap Contracts Option Contracts (Call & Put) Combination & Embedded Contracts  Derivative Instruments are mainly used as risk management tools  Participation in risk and reward is an important feature of Islamic finance & investments  Management of risk is an integral part of Islamic mode of financing 18
  • 19. Call Options  Call Options are contracts at which the owner of the Call (buyer or long position holder) after paying a premium (option premium) to the seller of the Call, gains the right but not the obligation to buy a given asset with a specific quality at a specific price (strike price) at or until a specific date (strike date).  A Call Option is not an obligation  The seller of a Call Option (short position holder) has no obligations to sell the asset until the Call is exercised by the Option buyer  When the Call is exercised the seller is obliged to sell the asset at the strike price  Call Option buyer thinks the asset price will rise and the seller thinks the opposite  A Call Option buyer usually uses this instrument to insure or hedge the cost of the needed raw materials or the maximum price he/she wants to pay for the purchase of an asset  Call Options are mainly traded in the organized exchanges and to some degree in the OTC markets 19
  • 20. Long Call Option Long Call Value Break-Even Price Underlying Asset Price 20
  • 21. Short Call Option Value Break-Even Price Underlying Asset Price Short Call Put Options:  Put Options are contracts at which the owner of the Put (buyer or long position holder) after paying a premium (option premium) to the seller of the Put, gains the right but not the obligation to sell a given asset with a specific quality at a specific price (strike price) at or until a specific date (strike date).  A Put Option is not an obligation  The seller of a Put Option (Short Position holder) has no obligations to buy the asset until the Put is exercised by the Option buyer  When the Put is exercised the seller is obliged to buy the asset at the strike price  Put Option buyer thinks the asset price will fall and the seller thinks the opposite  A Put Option buyer usually uses this instrument to insure or hedge the income resulting from the sale of an asset or the minimum price he/she receives from the sale of an asset  Put Options are mainly traded in the organized exchanges and to some degree in the OTC markets 21
  • 22. Long Put Option Long Put Value Break-Even Price Underlying Asset Price 22
  • 23. Short Put Option Break-Even Price Value Short Put Underlying Asset Price • An option gives its owner the right to buy or sell an underlying asset on or before a given date at a fixed price. • Option belong to a broader class of assets called contingent claims • The most popular model for pricing options is the block-scholes model which was published in 1973 the year in which the Chicago board of options exchange the first organized options exchange in the world was also setup – it was a rare occurrence in the field of finance when a seminal theoretical breakthrough coincided with a major institutional development. 23
  • 24. HOW OPTIONS WORK • The options to buy is a call option & the option to sell is a put options • The options holder is the buyer of the option & the option writer is the seller of the option. • The fixed price at which the option holder can buy & sell the underlying asset is called the striking price. • The date when the option expires is referred to as the expiration date. • The act of buying or selling the underlying asset as per the option contract is called exercising the option. • Options traded on an exchange are called exchange-traded options. • Options are said to be 1. ATM-At The Money 2. ITM-In The Money 3. OTM-Out of The Money  Call option put option • ATM exercise price=market price exercise price=market price • ITM exercise price<market price exercise price>market price • OTM exercise price>market price exercise price<market price • The value of an option if it were to expire immediately is called its intrinsic value. • The excess of the market price of any option over its intrinsic value is called the time value of the option. • Exchange traded options are standardized in terms of quantity cycle, expiration date, strike prices, type of option, & mode of settlement. 24
  • 25. 2.9-EQUITY OPTIONS IN INDIA There are two popular types of equity options index options and options on individual securities. Types of Equity Option • Bombay Stock Exchange • National Stock Exchange INDEX OPTION: Index options are options on stock market indices. Currently the most popular index options option in India is the option on the S&P CNX Nifty which is traded on the NSE. The salient features of this contract are as follows 1. The contract size is 200 times the underlying index. 2. The options contracts have a maximum of three month trading cycle • Near month • Next month • Far month A new contract will be introduced on the next trading day 3. It is a European style option contract 4. The expiry day is the last Thursday of the expiry month or previous trading day if the last Thursday is a trading holiday 5. The contract is cash settled. The settlement is done a day after the expiry day based on the expiration price as may be decided by the exchange. 25
  • 26. Futures & Forward contract forward future 1.traded on phone 1.traded in a competitive arena 2.self-regulating 2.regulated by authority like the exchange 3.tailor made sizes 3.standardised sizes 4.delivary on any date and as per the 4.delivary on specific dates fixed before requirements of the party hand 5.settlements on the due date 5.settlement on a daily basis 6.Margins are not required 6.mergins are required 26
  • 27. 3- INDUSTRY PROFILE The growth of financial sector in India at present is nearly 8.5% per year. The rise in the growth of the economy. The financial policies and the monetary policies are able to stable growth rate. The reforms, pertaining to the monetary policies and the macroeconomic policies over the last five years has influenced the Indian economy to the core. However global economic activity decelerated towards the end of the calendar year resulting in investment concerns on account of the sub-prime crisis in the US and other developed nations. Naturally the effects of this slowdown spilled over into developing economies also and we are looking ahead with some degree of concern over the prospects in the near future. The economic environment and prospects of India got the attention of global investors and the FII inflows continued even in the current financial year. The net FII investors peaked at USD 7 billion in September 2007. The increased liquidity combined with excellent performance of the corporate sector helped growth of equity market significantly. The Sensex touched the peak level of 21,206 in the month of January 2008. As a resulted volume in the market also went up to unprecedented level. The combined daily market turnover touched the record level of Rs 1 lakh crore for the first time in the history of capital market. The average daily turnover in the cash segment of NSE which was 7,812 crore in the year 2006-07 crossed was Rs 20,000 crore in October, 2007. Similarly the average volume in the derivative segment which was Rs 29,543 crore in 2006-07 reached a high of Rs 83,348 crore in October 2007. There has been a considerable increase in other areas of the industry such as mutual funds. IPOs and insurance products also, 612 mutual fund schemes were launched during the year against 413 last year. In recent days economic collapsed in variation of the foreign investors fund main effect of the Indian economy in 2008-2009 the Bombay Stock Exchange (BSE) the Sensex was 13,400 in the month of 13th july 2009 . In other side National Stock Exchange (NSE) 3,974 is in the same month of 2009 . However the market witnessed deep corrections in the end of January 2009 as a fall out of sub-prime crisis and related economic concerns in 27
  • 28. the US. Consequently volumes went down below half of the peak and the index corrected by more than 30% from its peak level. The dark clouds caused by global events and its possible impact on Indian economy continue to cast a shadow on the outlook of the markets in the near future. However global economic activity decelerated towards the end of the calendar year resulting in investment concerns on account of the sub-prime crisis in the US and other developed nations. Naturally the effects of this slowdown spilled over into developing economies also and we are looking ahead with some degree of concern over the prospects in the near future. The economic environment and prospects of india got the attention of global investors and the FII inflows continued even in the current financial year. The net FII investors peaked at USD 7 billion in September 2007. The increased liquidity combined with excellent performance of the corporate sector helped growth of equity market significantly. The Sensex touched the peak level of 21,206 in the month of January 2008. As a resulted volume in the market also went up to unprecedented level. The combined daily market turnover touched the record level of Rs 1 lakh crore for the first time in the history of capital market. The average daily turnover in the cash segment of NSE which was 7,812 crore in the year 2006-07 crossed was Rs 20,000 crore in October, 2007. Similarly the average volume in the derivative segment which was Rs 29,543 crore in 2006-07 reached a high of Rs 83,348 crore in October 2007. There has been a considerable increase in other areas of the industry such as mutual funds. IPOs and insurance products also , 612 mutual fund schemes were launched during the year against 413 last year. In recent days economic collapsed in variation of the forign investors fund main effect of the Indian economy in 2008-2009 the Bombay Stock Exchange (BSE) the sensex was 13,400 in the month of 13th july 2009 . In other side National Stock Exchange (NSE) 3,974 is in the same month of 2009 . However the market witnessed deep corrections in the end of January 2009 as a fall out of sub-prime crisis and related economic concerns in the US. Consequently volumes went down below half of the peak and the index corrected by more than 30% from its peak 28
  • 29. level. The dark clouds caused by global events and its possible impact on Indian economy continue to cast a shadow on the outlook of the markets in the near future. 3.1- COMPANY PROFILE 3.1a- Background and Inception of the company Mr.C.J.George and Mr.Ranajit Kanjilal founded Geojit as a partnership firm in the year 1987 in 1993. Mr.Ranajit kanjilal retired from the firm and Geojit became a proprietary concern of Mr. C.J.George. In 1994, it became a public limited company by the name Geojit securities Ltd. The Kerala state industrial Development Corporation Ltd. (KSIDC),IN 1995, became a co-promoter of Geojit by acquiring 24% stake in the company, the only instance in india of a government entity participating in the equity of a stock broking company. 22yearsof history in Indian Capital Market Geojit BNP Paribas has 22 years of in-depth broking experience in the Indian Capital Market. More than 4.5 lakh clients and over Rs 5,400 crores (as of 31st Mar.’09) in Assets Under Management reflect the trust reposed in our expertise. Pioneer in Online Trading in Feb. 2000 In the year 2000, Geojit BNP Paribas pioneered the simple concept of providing individuals with the facility to trade online. This revolution has given the company the first mover advantage in online trading. As a creative innovator, Geojit BNP Paribas uses advanced technology in online trading to meet client requirements such as customized online trading platforms and many other services. Strong Shareholders Geojit BNP Paribas is backed by strong shareholders. In 2007, global banking major BNP Paribas joined the company’s other major shareholders - Mr. C.J.George, KSIDC (Kerala State Industrial Development Corporation) and Mr.Rakesh Jhunjhunwala – when it took a stake to become the single largest shareholder. Wide range of products Geojit BNP Paribas offers a wide range of trading and investment products and solutions. Certified financial advisors help clients to arrive at the right financial solution to meet 29
  • 30. their individual needs. The wide range on offer includes - Equities | Derivatives | Currency Futures | Custody Accounts | Mutual Funds | Life Insurance & General Insurance | IPOs | Portfolio Management Services | Property Services | Margin Funding | Loans against Shares Learn the craft You too can develop your trading skills by availing of the effective guidance by our research department. We offer-Daily mails delivered to our client’s mailbox on market conditions and recommendations Technical analysis of BSE 200 Index scrip’s Free monthly investment magazine Services of professionally qualified executives at 500 offices across India. Our strong research ideas have been instrumental in converting our clients into successful traders. Multichannel service-  Internet,  Phone,  Branch trading  Trade the way that you want to by selecting from multiple channel options- Internet, Phone or Branch. First mover advantage Geojit BNP Paribas through its first mover advantage in different areas has been the first to serve investors with its innovative offerings. 1st to launch internet trading in the year 2000. 1st to launch integrated internet trading system for cash and derivative segments in the year 2002. 1st Indian stock broking company to commence domestic retail broking operations in any foreign country. 1st in the industry to have a global player offering its name thereby creating Geojit BNP Paribas. 30
  • 31. 1st to launch exclusive branches for women in 2005. Wide range of fund options Geojit BNP Paribas gives you the option to choose from the 700 plus Mutual Fund schemes offered by over 35 Asset Management companies such as • SBI Mutual Fund, • Reliance Mutual Fund, • Franklin Templeton India Mutual Fund, • Tata Mutual Fund, • Sundaram BNP Paribas Mutual Fund, • Fidelity Mutual Fund, and • HDFC Mutual Fund. 3.1b-Geojit Securities is now Geojit BNP Paribas Financial services Mumbai March 13 BNP Paribas S.A. has become the single largest shareholder in Geojit Financial Services Ltd through a preferential allotment of 5.68 crore shares and 2.28 crore warrants. Geojit will now be rechristened `Geojit BNP Paribas Financial Services Ltd.' The allotments follow shareholders' approval at the Extra Ordinary General Meeting held on November 22, 2006 and other statutory approvals, the company informed the BSE. BNP Paribas will acquire 27.18 per cent stake in the company at Rs 26 per share and after the conversion of warrants into shares within 18 months at the same price, will increase its holding to 34.35 per cent. BNP Paribas will make an open offer for acquiring an additional 20 per cent stake in Geojit. The price for the open offer has not yet been decided, said Mr Olivier Le Grand, Head of BNP Paribas Personal Investors. Shares of Geojit Financial Services rose 5.21 per cent to close at Rs 38.35 on the BSE. However, even post-open offer there are no plans to delist Geojit from the stock exchanges, said Mr. C.J. George, Managing Director, Geojit Financial Services Ltd. 31
  • 32. The promoters' stake in Geojit will come down to around 30 per cent from around 45 per cent (going by BSE). For BNP Paribas the deal will cost around Rs 207 crore and the fund infusion will be done in stages. It will fund expansion of business in the Middle East, branch expansion in India and strengthen the distribution of financial products. The company will continue to be managed by the current team with Mr George as the Managing Director. Three members from BNP Paribas will be nominated on the board, namely Mr Olivier Le Grand, Mr. Frederic Amoudru - Chief executive and Country Manager of BNP Paribas in India and Mr. Rousseau - Head of BNP Paribas Securities, Asia. "By joining the global network of BNP Paribas, Geojit will be in a position to serve the large Indian population living outside India, apart from gaining knowledge from BNP Paribas' position as the market leader in online brokerage in continental Europe," said Mr George. Geojit wants to become a strong distribution platform for brokerage and savings products, increase margin lending in equities, develop institutional business and strengthen the business of Geojit Technologies Ltd. 32
  • 33. 3.2- Nature of the Business A Geojit securities limited /Geojit Financial BNP service limited is the holding company for the subsidieries .The principal subsidieries include: Geojit Financial BNP Services limited Geojit Credits (p) Geojit Commodities Geojit financial services & limited limited management Limited Geojit Technologies (p) Geojit Financial Distribution Limited (p) Limited 33
  • 34. Sigma system International FZ LLC Area of operation STATES No of Branches Andhra Pradesh 39 Bihar 1 Chandigarh 1 Chaattisgarh 1 Goa 1 Gujarat 23 Haryana 3 Jammu & Kashmir 1 Karnataka 62 Kerala 121 Madhya Pradesh 7 Maharashtra 54 Delhi 12 Panjab 4 Rajasthan 6 Tamilnadu 94 Uttar Pradesh 15 Uttaranchal 1 West Bengal 7 TOTAL 453 34
  • 35. OWNERSHIP PATTERN Sl No. Category of share holders Total no of % to Total shares shares 1 Indian individuals 45,606,760 21.82% 2 Indian bodies corporate 20,000,000 9.57% 3 Foreign bodies corporate 56,804,870 27.18% 4 Mutual funds 7,568,040 3.62% 5 Foreign institutional investors 6,001,465 2.87% 6 Non institutional bodies corporate 8,189.114 3.92% 7 Non institutional Individuals 26,587,130 12.72% 8 Trust 525 0.06% 9 Directors & their relatives 29,362,000 14.05% 10 Nonresident Indians 6,617,951 3.17% 35
  • 36. 11 Overseas Corporate Bodies 300 0.045 12 Clearing members 1,823,211 0.87% 13 Hindu undivided families 429,504 0.21% TOTAL 208,990,870 100% 3.3 Vision and Mission Statement VISION To be a leading financial and commodities intermediary for individual and institutional clients from india and overseas Company will continually strive to raise the product and service standard by intelligent application of technology and processes MISSION Company understands and respects customer needs to consistently deliver total quality solutions through constant skills up gradation Company believes that there culture helps to attract and retain the best talent Company upholds uncompromising ethical standards and strives to maintain a distinctive identity in public mind through innovation and quality Company is committed to achieve profitable progress, consistently. Company freely shares investment experience across all ages and strata of society to encourage wise investment for a better future. 36
  • 37. CODE OF CONDUCT FOR THE DIRECTORS AND SENIOR OFFICERS As per Clause 49 of the Listing Agreement with the Stock Exchanges, it shall be obligatory for the Board of Directors of all listed Companies to lay down a code of conduct for all Board members and senior management of the Company in order to ensure good Corporate Governance. I. CORPORATE GOVERNANCE Corporate governance is about commitment to values and about ethical business conduct. It is about how an organization is managed. This includes its corporate and other structures, its culture, its policies and the manner in which it deals with various stakeholders. Accordingly, timely and accurate disclosure of information regarding the financial situation, performance, ownership and governance of the company, is an important part of corporate governance. This improves public understanding of the structure, activities and policies of the organization. Consequently, the organization is able to attract investors, and to enhance the trust and confidence of the stakeholders. We believe that sound corporate governance is critical to enhance and retain investor trust. Accordingly, we always seek to attain our performance rules with integrity. The Board extends its fiduciary responsibilities in the widest sense of the term. Our disclosures always seek to attain the best practices in international corporate governance. We are also responsible to enhance long term shareholder value and respect minority rights in all our business decisions. II. INTRODUCTION OF CODE (Preamble) This Code of Ethics for Directors and Senior Executives (the “Code”) helps to maintain the standards of business conduct for Geojit BNP Paribas Financial Services Limited (the “Company”) and ensures compliance with legal requirements particularly of Companies Act, SEBI Regulations and the Listing Agreement with Stock Exchanges. The purpose of the Code is to deter wrongdoing and promote ethical conduct. The matters covered in this Code are of utmost importance to the Company, our shareholders and our business partners. Further, these are essential so that we can conduct our business in accordance with our stated values. The Code is applicable to the following persons, referred to as “Officers” : • Directors of the Company • Our Senior Management • Members of the Board of Subsidiary Company Ethical business conduct is critical to our business. Accordingly, Officers are expected to read and understand this Code, uphold these standards in day-to-day activities, and comply with all applicable laws, rules and regulations, the Geojit BNP Paribas Code of Conduct, Service rules and all applicable policies and procedures adopted by the Company that govern the conduct of its employees. 37
  • 38. Because the principles described in this Code are general in nature, Officers should also review the Company’s other applicable policies and procedures. Officers should sign the acknowledgment form at the end of this Code and return the form to the HR department indicating that they have received, read and understood, and agree to comply with the Code. The signed acknowledgement form should be available with officers concerned. Each year, as part of their annual review, Officers will be asked to sign an acknowledgement indicating their continued understanding and adherence of the code. III. HONEST AND ETHICAL CONDUCT We expect all Officers to act in accordance with highest standards of personal and professional integrity, honesty and ethical conduct, while working on the Company’s premises, at offsite locations where the Company’s business is being conducted, at Company sponsored business and social events, or any other place where Officers are representing the Company. We consider honest conduct to be conduct that is free from fraud or misrepresentation or deception. We consider ethical conduct to be conduct conforming to the accepted professional standards of conduct. Ethical conduct includes ethical handling of actual or apparent conflicts of interest between personal and professional relationships. This is discussed in more detail in Section IV below. IV. CONFLICTS OF INTEREST an Officer’s duty to the Company demands that he or she avoids and discloses actual and apparent conflicts of interest. A conflict of interest exists where the interests or benefits of one person or entity conflict with the interests or benefits of the Company. Examples include: A. Employment/Outside employment: With regard to the employment with the Company, Officers are expected to devote their full attention to the business interests of the Company. Officers are prohibited from engaging in any activity that interferes with their employment with the Company. Our policies prohibit Officers from accepting simultaneous employment with suppliers, customers, developers or competitors of the Company, or from taking part in any activity that enhances or supports a competitor’s position. Additionally, Officers must disclose to the Company’s Audit Committee, any interest that they have that may conflict with the business of the Company. B. Outside directorships: It is a conflict of interest to serve as a director of any company that competes with the Company. Officers must first obtain approval from the Company’s audit committee before accepting a directorship. 38
  • 39. C. Business Interests: If an Officer is considering investing in any customer, supplier, developer or competitor of the Company, he or she must first take care to ensure that these investments do not compromise on their responsibilities to the Company. Our policy requires that Officers first obtain approval from the Company’s Audit Committee before making such an investment. Many factors should be considered in determining whether a conflict exists, including the size and nature of the investments, the Officer’s ability to influence the Company’s decisions, his or her access to confidential information of the Company or of the other company, and nature of the relationship between the Company and the other company. At the time of application for approval, full facts of the proposed investment shall be placed before the Committee. D. Related parties: As a general rule, Officers should avoid conducting Company’s business with a relative, or have business in which a relative is associated in any significant role. A relative means and includes spouse, children, parents, grandparents, grandchildren, aunts, uncles, nieces, nephews, cousins, step relationships, and in-laws. Subject to the rules and regulation, the Company discourages the employment of relatives of Officers in key positions or assignments within the same department. Further, the Company prohibits the employment of such individuals in positions that have a financial dependence or influence (e.g. an auditing or control relationship, or a supervisor/subordinate relationship). Every employee drawing a monthly salary of Rs.10,000/- or more shall disclose whether he is a relative or not of any of our directors. E. Payments or gifts from others: Under no circumstance the Officers shall accept any offer, payment, promise to pay, or authorisation to pay any money, gift, or anything of value from customers, vendors, consultants, etc., that is perceived as intended, directly or indirectly, to influence any business decision, any act or failure to act, any commitment of fraud, or opportunity for the commitment of any fraud. Inexpensive gifts, infrequent business meals, celebratory events and entertainment, provided that they are not excessive or create an appearance of impropriety, do not violate this policy. Questions regarding whether a particular payment or gift violates this policy are to be directed to Finance Department. Gifts given by the Company to suppliers or customers should be appropriate to the circumstances and should never be of a kind that could create an appearance of impropriety. The nature and cost must always be accurately recorded in the Company’s books and records. F. Corporate opportunities: Officers may not exploit for their own personal gain, opportunities that are discovered through the use of corporate property, information or position, unless the opportunity is disclosed fully in writing to the Company’s Board of Directors and the Board declines to pursue such opportunity. 39
  • 40. G. Interested Contracts: Except with the consent of the Board of Directors of the Company, any of the Director or his relative or a firm in which a director or his relative is a partner, any other partner in such a firm, or a private company of which the director is a member or director shall enter into any contract with the Company for sale, purchase or supply of goods, materials or services, or for underwriting the subscription of any shares in or debentures of the Company except for purchase or sale of goods for market price or such contracts which either party regularly trades or does business. For any clarification in this regard, the officers are requested to contact to the Finance Department / Secretarial Department / Legal Department. H. Whistle Blower Policy: Employees who came across any unethical or improper practice (not necessarily a violation of law) shall be free to approach the Audit Committee without necessarily informing their supervisors. All officers are requested to inform their subordinates about their this right through an effective manner. For any clarification in this regard please contact Finance Department / Secretarial Department / Legal Department. I. Other Situations: It would be impractical to attempt to list all possible situations. If a proposed transaction or situation raises any questions or doubts, please contact Finance Department. 3.4 ACHIVEMENT AND AWARDS The company crossed the following milestone to reach its present position as a leading retail broking house in India. 1986 Geojit became the member of the Cochin stock exchange. 1994 The Kerala state industrial development corporation an arm of the government of Kerala became a co promoter of the company by acquiring 24% equity stake in Geojit financial services ltd. Based on the evaluation report of this is the only venture in India where a state owned development institution is participating in the equity of a stock broking company. Geojit became a corporate broking house. 1995 40
  • 41. Geojit comes out with a small initial public offer of rs-95 million which was oversubscribed by 15 million and KSIDC equity stake comes down to 17%. Geojit become a member of the NSE and installs its first trading terminal in Cochin, Kerala. 1996 The company launches portfolio management services after obtaining required registratration from SEBI. 1997 Geojit become a depository participant under national depository securities depository ltd (NSDL) and begins providing depository services through its branches. 1999 Geojit becomes a member of the BSE In MUMBAI and activities Bombay Online Trading in different branches. The customer’s base of Geojit crosses the 50000 mark 2000 Geojit become the first broking firm in the country to offer online trading facility. The then SEBI chairman, Mr.D.R.Mehta the facility on 1-2-2000 Commences Derivative Trading after obtaining registration as a clearing and trading member in NSE. 2001 Geojit’s customer base crosses 100,000 Become Indian first DP to launch depository transaction through Internet. The company issues bonus shares in the ratio of 1:1 41
  • 42. 2002 Geojit ties up with Met life for the marketing 7 distribution of insurance products across the country. The company becomes the first online brokerage house to launch integrated internet trading system for both cash and derivative segments. 2003 Geojit commodities ltd, a wholly owned subsidiary of Geojit became member of National Multi commodity exchange ltd. National commodity Exchange ltd. Geojit raises more than Rs-100 million through issue of preferential shares. 2005 Barjeel Geojit Securities LLC becomes a member of Dubai Gold Commodity Exchange. Customer base of Geojit croses 2,50,000 Geojit reach speeds through a network of more than 300 branches. The company gets listed on NSE of India ltd. The company implements Employees stock option scheme. The company opens a first of its kind all woman’s branch in Cochin. 2006 Geojit launches Internet Trading on Reuters TIB Mercury platform. 2007 42
  • 43. On 13-3-2007 the formation of geojit BNP Paribas Financial Services ltd. was announced in Mumbai and Paris. Through a preferential allotment BNP Paribas had taken 27% stake in Geojit which will eventually increases to 34.35% .with the final step the French banking major has become the largest share holder in Geojit Financial services Ltd. With presence in more than 85 countries the bank has a headcount of more than 1,38,000. 3.5WORK FLOW MODEL Geojit a member of NSE & BSE has a network of over 450 branches in India and abroad, rendering quality equity trading services. Geojit not only has a strong offline presence but also provides automated online trading services. Geojit also provides a call & trade facility to its customers wherein they can place and track their orders through our dedicated call centre Desk. Geojit’s retail spread caters to the need of individuals investors Trading in equities is made simple, safe and interesting with smart advice from the research desk through daily SMS alerts, market pointers , periodical research reports stock recommendations and customer meets organised frequently. There are 3 types of trading platform offered by Geojit bnp financial for its customer SILVER PLATINUM 43 GOLD
  • 44. 1) SILVER: Silver platform is browser based solution where in one can enquire and get the stock prices market depth, etc. For each scrip at a time. Minimum brokerage concept does not apply for silver platform. 2) GOLD: This Platform is a web based solution and the customer can login to the trading platform from anywhere in the world. 3) PLATINUM: The platinum version acts as a virtual dealers terminal providing live up dates and confirmation. 44
  • 45. 3.4 - SWOT ANALYSIS STRENGTHS WEAKNE THREAT SS SWOT 45
  • 46. OPPORTUNITIES STRENGTHS:  Geojit is one of the leading retail financial service companies in the country and in the Middle East with membership in NSE and BSE.  Company continues to achieve cost efficiencies through the application of technology.  Geojit is a charter member of the financial planning standards board of India and is one of the largest brokers in the country.  It is listed on the BSE & NSE and its market capitalization is over Rs.777.6 crores  It is the first Indian stock broking company to commence domestic retail brokerage operations in any foreign country through its joint venture Aloula Geojit.  Geojit renders quality equity trading services.  It is a highly innovative company and among many industries first to its credit prominent is the launch of internal trading in 2000.  It launched branches exclusively for women investors.  It brand is popular and the brand image can be capitalized.  It has well experienced staff and good infrastructure.  It follows corporate governance norms and adopts best management practices.  Wide number of products and services and also branches. 46
  • 47. WEAKNESS:  Unable to market their products & services more efficiently  Many of their competitors have significantly greater financial, technical, marketing and other resources than available to Geojit.  Unable to compete with the brokerage rates of their competitors.  Less number of branches in north India.  Lack of efficient and effective strategies in attracting customers. OPPORTUNITIES: The India financial market has a vary high growth potential. The macro economic fundamental are sound to allow the economy to make rapid strides. Economic expansion will result in greater disposable incomes and larger number of investors.  The manifold increase in capital mobile station from the primary market.  Increase the resource mobilization by mutual funds  Phenomenal growth in secondary market volumes.  Introduction of new products like mini derivative contracts and securities lending and borrowing scheme.  Introduction of new instruments in the F&O segment etc.  Trapping new markets.  Target the rural and sub urban areas.  Growing India economy opens up huge market for stock broking companies.  Company believes that their culture helps to attract and retain the best talent.  Company is committed to achieve profitable progress consistently. 47
  • 48. THREATS:  The stock broking industry has recently witnessed intense competition falling brokerage rates & the entry of several big player.  Increased level of competition is a cause of concerns.  Competition from financial institution like banks investing firms etc.  Uncertainty in the market.  Changes in India political economic conditions.  Changes in government policies and regulation.  Dependency on international market. 4-ANALYSIS AND INTERPRETATION OF DATA 48
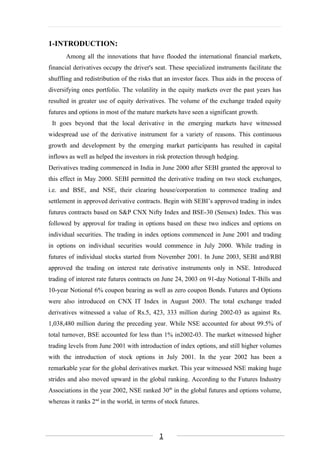
  • 49. The analysis and interpretation of data conducted in Geojit BNP Paribas financial services ltd Hassan, covers on overview of the Derivatives (F&O) segment month wise, product wise, trade wise, with traded value analysis Trend analysis supported by charts and Tables from the information collected during the project study Table 1: The following table showing the trading Contracts from Oct 2009 to Mar 2010 Particulars Oct-09 Nov-09 Dec-09 Jan-10 Feb-10 Marc-10 Stock Futures 14044526 13260546 11307332 12546679 10725789 12657646 Index Futures 13615447 15178552 13337833 12056359 13891843 14379982 Stock Options 1378569 1360703 1252898 1414178 1223627 1384453 Index Options 26671252 32965274 29525940 27084605 34588704 30199846 Graph:1 The following Graph Showing the Derivatives trading Contracts at NSE from Oct 2009 to Mar 2010 49
  • 50. Derivatives Contracts 40000000 34588704 35000000 32965274 30199846 29525940 30000000 26671252 27084605 25000000 Stock Future 20000000 Index Future Stock Option 15178552 1500000014044526 13891843 14379982 Index Option m N 13260546 13337833 o n b u C e a c s r t f 12546679 12657646 13615447 11307332 1205635910725789 10000000 5000000 1378569 1360703 1252898 1414178 1223627 1384453 0 Oct/09 Nov/09 Dec/09 Jan/10 Feb/10 Mar/10 Analysis Above graph shows that stock future was 14044526 Contract on October 2009 where as it Increased to 30199846 Contracts in March 2010. Index Future in October 2009 was 13615447 Contracts and it decreased to 12657646 Contracts in the month of March 2010. Stock Option in October 2009 was 1378569 Contracts and it increased to 1384453 Contracts in the month of March 2010. And Index Option in October 2009 was 26671252 Contracts and it increased to 30199846 Contracts in the month of March 2010. Interpretation 50
  • 51. It can be interpreted that The Index futures are having more trade value compare to stock Future. Index Option are having more trade value compare to stock options. From the October 2009 to March 2010 Number Contract decreased due to the market decline, economic exposure and Operational exposure Table: 2 The following table Showing the Number of Contracts And average daily Contracts from October-2009 to March-2010 Months Total Avg. Daily Trading Oct-2009 55709794 2932094 Nov-2009 62765075 3138254 Dec-2009 55424003 2639238 Jan-2010 53101821 2794833 Feb-2010 60429963 3021498 Mar-2010 58621927 2791521 Working Note Average Daily Trading = Total Contracts ------------------------------------------ No. Of trading days in month Oct-2008 =55709794/19=2932094 Nov-2009=62765075/20=3138254 Dec-2009=55424003/21=2639238 Jan-2010=53101821/19=2794833 Feb-2010=60429963/20=3021498 Mar-2010=58621927/21=2791521 Analysis The above table shows Number of Contracts from October-2009 to March -2010, 55709794, 62765075, 55424003, 53101821, 60429963, 58621927, respectively. Interpretation It can be interpreted that from October-2009 to November-2009 ontracts are increased (55709794 to 62765075). And in Nov-2009 to Mar-2010 it decreased (58621927) due to the market decline 51
  • 52. Table 3: The following table showing the Derivatives Trading Volume at .NSE. From Oct-2009 TO Mar -2010 (in core) Particulars Oct-20 Nov-20 Dec-20 Jan-20 Feb-20 Mar-20 09 09 09 10 10 10 Stock 465829 438220 395954 444134 354485 413257 Futures Index 329610 363523 329496 298849 326871 292038 Futures Stock 45387 43666 42855 51454 41285 38467 Options Index 669591 816408 756677 695860 847236 753739 Options Graph:2 The following Graph Showing the Derivatives trading volume at NSE from Oct 2009 to Mar 201 52
  • 53. Derivatives Trading Volume 900000 847236 816408 800000 756677 753739 695860 700000 669591 Stock Futures 600000 500000 465829 Index Futures 438220 444134 413257 395954 400000 363523 354485 m V R o u C e 329610 329496 s Stock Options r 326871 ) ( l 298849 292038 300000 Index 200000 Options 100000 45387 43666 42855 51454 41285 38467 0 Oct/09 Nov/09 Dec/09 Jan/10 Feb/10 Mar/10 Analysis Above graph shows that stock future Turnover was 4,65,829 crore on October 2009 Where as it decreased to 4,13,257 crore in March 2010. Index Future in October 2009 was 3,29,610 and it decreased to 2,92,038 in the month of March 2010. Stock Option in October 2009 was 45,387 crore and it decreased to 38,467 crore in the month of March 2010. And Index Option in October 2009 was 6, 69, 591 cores and it increased to 7,53,739 crore in the month of March 2010 Interpretation 53
  • 54. It can be interpreted that The Stock Futures are having more trade value compare to Index Future. Index Option is having more trade value compare to stock options. From the October 2009 to March 2010 trade value decreased (except Index Option) due to the market decline, economic exposure and Operational exposure Graph: 4 The following Graph Showing the Derivatives trading volume at NSE of Nov 2009 Analysis Above graph shows that the Volume of Stock Future is 438220 crore (26.37%), Index Future is 363523 crore(21.88%), Stock Option is 45666 crore (2.63%) & Index Option is 816408 crore (49.12%) in the month of October Interpretation It can be interpreted The Stock Futures are having more trade value compare to Index Future. Index Option are having more trade value compare to stock options. 54
  • 55. Graph:5 The following Graph Showing the Derivatives trading volume at NSE of Dec 2009 Analysis Above graph shows that the Volume of Stock Future is 395954 crore (25.97%) , Index Future is 329496 crore (21.61%), Stock Option is 42855 crore (2.81%) & Index Option is 756677 crore (49.61%) in the month of October Interpretation It can be interpreted that The Stock Futures are having more trade value compare to Index Future. Index Option are having more trade value compare to stock options. 55
  • 56. Graph:6 The following Graph Showing the Derivatives trading volume at NSE of Jan 2010 Analysis Above graph shows that the Volume of Stock Future is 444134 crore (29.80%) , Index Future is 298849 crore (20.05%), Stock Option is 51454 crore (3.45%) & Index Option is 695860 crore (46.70%) in the month of October Interpretation It can be interpreted that The Stock Futures are having more trade value compare to Index Future. Index Option are having more trade value compare to stock options. Graph:7 The following Graph Showing the Derivatives trading volume at NSE of Feb 2010 56
  • 57. Analysis Above graph shows that the Volume of Stock Future is 354485 crore (22.58%), Index Future is 326871 crore(20.82%), Stock Option is 41285 crore (2.63%) & Index Option is 847236 crore (53.97%) in the month of October Interpretation It can be interpreted that The Stock Futures are having more trade value compare to Index Future. Index Option are having more trade value compare to stock options. Graph:8 The following Graph Showing the Derivatives trading volume at NSE of Mar 2010 57
  • 58. Analysis Above graph shows that the Volume of Stock Future is 413257 crore (27.60%), Index Future is 292038 crore (19.50%), Stock Option is 38467 crore (2.56%) & Index Option is 753739 crore (50.33%) in the month of October Interpretation It can be interpreted that the Stock Futures are having more trade value compare to Index Future. Index Option are having more trade value compare to stock options. 4.2-Growth of Derivative Market in India 58
  • 59. Table: 5 the following table showing the Growth of the derivatives in India Index Futures Stock Index Stock Futures Options Options Year No. of Turnov No. of Turnov No. of Turnov No. of Turn contract er (Rs. contract er (Rs. contract er (Rs. contract over s cr.) s cr.) s cr.) s (Rs. cr.) 2009-1 1783068 393438 1455912 5195247 3413795 802796 1401627 50606 0 89 9 40 23 4 0 5.2 2008-0 2104281 357011 2215779 3479642 2120884 373150 1329597 22922 9 03 1 80 44 2 0 6.8 200 7-0 156598 38206 203587 754856 553660 13621 946063 3591 8 579 67 952 3 38 11 1 36.6 2006- 814874 25395 104955 383096 251574 79190 528331 1937 07 24 74 401 7 38 6 0 95 2005- 585378 15137 809054 2791 1293 338 5240 1802 06 86 55 93 697 5116 469 776 53 200 16 4-0 2163 772 4704 1484 3293 121 5045 88 5 5449 147 3066 056 558 943 112 36 200 130 21 3-0 1719 554 3236 593 1732 528 5583 72 4 1668 446 8842 9 414 16 071 07 200 10 2-0 2126 439 1067 286 4422 924 3523 01 3 763 52 6843 533 41 6 062 31 200 25 1-0 1025 214 1957 515 1759 376 1037 16 2 588 83 856 15 00 5 529 3 Graph:9 The following Graph Showing the Growth of Derivative Market In India(Turnover) 59
  • 60. Analysis Above graph shows that the Growth of derivatives in India. Index Future Turnover was 2365 Crore on 2000-01 Where as it increased to 3934389 Crore in 2009-2010. Stock Future in 2001-2002was 51515 Crore and it increased to 5195247 Crore in the 60
  • 61. 2009-2010. Index Option in 2001-2002 was 3765 Crore and it increased to 8027964 Crore in the 2009-2010. And Stock Option in 2001-2002 was 25163 Crore and it increased to 506065.2 Crore in the 2009-2010. Interpretation It can be interpreted that in the 2000-2001 only Index Future are started & reaming Three Could not open i.e. (Stock Option, Stock Future and Index Option). In 2001-2002 starting all the Four Derivatives. In 2000 is very low turnover but after constantly increasing. In 2009-2010 Index Option having more trade value but 2007-2008 Stock Future is more Than the Index Option. And 2009-2010 good position & rapidly increasing the derivative Market in India. Graph:10 The following Graph Showing the Growth of Derivative Market In India(Contract) 61
  • 62. Growth of Derivative Market 35000000 30000000 25000000 20000000 Index Future 15000000 Stock Future m N o n b u C e a Index Option c r t f 10000000 Stock Option 50000000 0 Year Analysis Above graph shows that the Growth of derivatives in India. Index Future was 90580 Contract on 2000-01 where as it Increased to 178306889 Contracts in 2009-2010. Stock Future in 2001-2002was 1957856 Contract and it increased to 145591240 62
  • 63. Contract in the 2009-2010. Index Option in 2001-2002 was 175900 Contract and it increased to 341379523 Contract in the 2009-2010. And Stock Option in 2001-2002 was 1037529 Contract and it increased to 14016270 Contract in the 2009-2010. Interpretation In can be interpreted that in the 2000-2001 only Index Future are started & reaming Three Could not open i.e. (Stock Option, Stock Future And Index Option). In 2001-2002 starting all the Four Derivatives. in 2000 is very Less number of contract but after constantly increasing. And 2009-2010 good position & Rapidly increasing the derivative Market in India. 4.3-Comparative Analysis – World Exchanges 63
  • 64. Table: 6 the following table showing the Top 10 Derivatives Exchanges ranked by Number of Contracts Traded and/or Cleared. Exchanges that operate under common ownership are combined. Rank Exchange 2008 Rank Exchange 2008 1 CME Group (includes CBOT and Nymex) * 3,277,645,351 2 Eurex (includes ISE) * 3,172,704,773 3 Korea Exchange 2,865,482,319 4 NYSE Euronext (includes all EU and US 1,675,791,242 markets) * 5 Chicago Board Options Exchange (includes 1,194,516,467 CFE) * 6 BM&F Bovespa * 741,889,113 7 Nasdaq OMX Group (includes all EU and US 722,107,905 markets) * 8 National Stock Exchange of India 590,151,288 9 JSE South Africa 513,584,004 10 Dalian Commodity Exchange 313,217,957 Graph: 11 The following Graph Showing the Top 10 Derivatives Exchanged in the World (2008) 64
  • 65. Analysis Above graph shows that the Top 10 derivatives Exchanges in the World. The CME Group was more Exchanged and 1st Rank in the World Eurex is 2nd Rank in the World Korea Exchange, NYSE Euronext, markets)*, Chicago Board Options Exchange, BM&F Bovespa *, Nasdaq OMX Group are 3rd, 4th, 5th, 6th & 7th Respectively. National Stock Exchange of India (NSE) 8th Ranked in the World. And JSE South Africa, Dalian Commodity Exchange was 9th&10th respectively. 65
  • 66. Interpretation It can be interpreted that in the 2008 The NSE Turnover is 59,01,51,288 Crore but CME Group turnover is 3,277,645,351 Crore. Big difference between both, According to this data NSE got 8th Rank & CME Group got 1st Rank Table: 7 The following table showing the Comparative analysis of the Traded Value in the F&O Segment with the Cash Segment: From Spt-2009 to Feb-2010 months Cash Segment F&O Segment Spt-20 365063 1388378 09 Oct-20 362969 1510417 09 Nov-20 324477 1661816 09 Dec-20 292900 1524982 09 Jan-20 338443 1490297 10 Feb-20 245143 1569877 10 Graph:12 The following Graph Showing the Traded Value in the F&O Segment with the Cash Segment: 66
  • 67. Analysis Above graph shows that Cash Segment Turnover was 365063 crore on September 2009 where as it decreased to 245143 crore in Feb 2010.F&O Segment was 1388378 Crore on September 2009. Whereas it increased to 1569877 Crore in Feb 2010 Interpretation It can be interpreted that The F&O Segment are having more trade value compare to Cash Segment. Because F&O have more Flexible . 4.4-FUTURES SEGMENT 67
  • 68. Table: 8 the following table showing the Top 5 Traded Symbols on February 2010 Symbols Turnover (Rs Percentage Cr) (%) NIFTY 275349 42.29 BANKNIFTY 24027 3.69% MINIFTY 13219 2.03% TATAMOTORS 12471 1.92% TATASTEEL 18357 2.82% OTHERS 307555 47.25% Graph :13 The following Graph Showing the FUTURES SEGMENT of Top 5 Traded Symbols on February 2010 68
  • 69. 50.00% 47.25% 45.00% 42.29% 40.00% 35.00% Sales 30.00% 25.00% 20.00% Column1 15.00% 10.00% 5.00% 0.00% 3.69% 2.03% 1.92% 2.82% Analysis Above graph shows that Top 5 Traded Symbols on Feb 2010. NIFTY Turnover was 275349 crore (42.29%), BANKNIFTY was 24027 (3.69%), MININIFTY was 13219 (2.03), TATAMOTORS was 12471(1.92%), TATASTEEL was 18357 (2.82%), & 0THERS was 307555 (47.25%). Interpretation It can be interpreted that The NIFTY are having more trade value compare to others The F&O are more traded in NSE. Other Four Symbols are important role in the Future Market Table: 9 the following table showing the Top 5 Symbols by Open Interest (number of contracts) on February 2010 69
  • 70. Symbols Number of Percentage (%) Contract NIFTY 642864 34.65% MINIFTY 79006 4.26% RELIANCE 49335 2.66% BHARTIARITEL 44162 2.38% ICICIBANK 37054 2.00% OTHERS 1003022 54.06% Graph:14 The following Graph Showing the Top 5 Symbols by Open Interest (number of contracts) on February 2010 70
  • 71. 120000000.00% 100000000.00% 80000000.00% Number of % 60000000.00% Contracts 40000000.00% 20000000.00% 34.65% 54.06% 0.00% 2.00% 2.66% 2.38% 4.26% Analysis Above graph shows that Top 5 Traded Symbols by open Interest on Feb 2010. NIFTY was 642864 (34.65%), MININIFTY was 79006 (4.26%), RELIANCE was 49335 (2.66%), BHARTIARTEL was 44162(2.38%), ICICI was 37054 (2%) & 0THERS was 1003022 (54.06%). Interpretation It can be interpreted that The NIFTY are having more trade value compare to others Other Four Symbols are important role in the Future Market 4.5-OPTIONS SEGMENT 71
  • 72. Table:10 The following table showing the Top 5 Traded Symbols on February 2010 Symbols Turnover (Rs Percentage (%) CR) NIFTY 8216393.57 95.26% TATASTEEL 5764.04 0.65% RELIANCE 4717.45 0.53% HINDALCO 3474.30 0.39% UNITECH 2815.05 0.32% OTHERS 25356.67 2.85% Graph:15 The following Graph Showing the OPTIONS SEGMENT of Top 5 Traded Symbols on February 2010 72
  • 73. 120.00% 100.00% 95.26% 80.00% NIF TY TA TA S TE E L 60.00% R E L IA NC E HINDA L C O UNITE C H 40.00% O THE R S 20.00% 0.65% 0.53% 0.39% 0.32% 2.85% 0.00% NIF TY R E L IA NC E UNITE C H Analysis Above graph shows that Top 5 Traded Symbols on Option Segment Feb 2010. NIFTY was 95.26%, TATASTEEL was 0.65%, RELIANCE was O.53%, HINDALCO 0.39% , UNITECH was O.32% & 0THERS was 2,85%. Interpretation It can be interpreted that The NIFTY are having more trade value compare to others. The most of the people prefer Nifty Reason is less flexibility. The Nifty are important Role in the Option Segment Table:11 The following table showing the Top 5 Symbols by Open Interest (number of contracts) on February, 2010 Call Options 73
  • 74. Symbols Number of Percentage Contracts (%) NIFTY 1394840 88.48% RELIANCE 23486 1.49% BHARTIARTEL 16283 1.03% SBIN 9956 0.63% NTPC 9326 0.59% OTHERS 122520 7.77% Graph:16 The following Graph showing the Showing the Top 5 Symbols by Open Interest (number of contracts) on February, 2010 Call Option 100.00% 88.48% 88.48% 80.00% S ales 60.00% 40.00% 20.00% 7.77% 7.77% 1.49% 1.03% 0.63% 0.59% 1.49% 1.03% 0.63% 0.00% 0.59% C olumn1 NIF TY S B IN Analysis Above graph shows that Top 5 Traded Symbols by Option Segment (CALL OPTION) Feb 2010. NIFTY was 1394840 (88.48%), RELIANCE was 23486 (1.49%), BHARTIARTEL was 16283 (1.03%), SBIN 9956 (0.63%), NTPC was 9326 (0.59%) & 0THERS was 122520 (7.77%). 74