Vietnam Fertilizer Market Fact Sheet
•
1 j'aime•420 vues

Factsheet with basic information about fertilizer industry in Vietnam
Recommandé

Recommandé
Contenu connexe
Tendances
Tendances (18)
En vedette
En vedette (20)
Similaire à Vietnam Fertilizer Market Fact Sheet
Similaire à Vietnam Fertilizer Market Fact Sheet (20)
Plus de Hieu Nguyen
Plus de Hieu Nguyen (12)
Dernier
Dernier (20)
Vietnam Fertilizer Market Fact Sheet
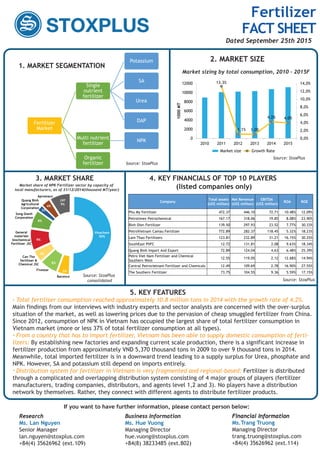
- 1. 5. KEY FEATURES 2. MARKET SIZE 1. MARKET SEGMENTATION Source: StoxPlus 13.3% 1.1% 1.0% 4.2% 4.0% 0,0% 2,0% 4,0% 6,0% 8,0% 10,0% 12,0% 14,0% 0 2000 4000 6000 8000 10000 12000 2010 2011 2012 2013 2014 2015 1000MT Market size Growth Rate Fertilizer Market Single nutrient fertilizer Potassium SA Urea DAP Multi nutrient fertilizer NPK Organic fertilizer Total fertilizer consumption reached approximately 10.8 million tons in 2014 with the growth rate of 4.2%. Main findings from our interviews with industry experts and sector analysts are concerned with the over-surplus situation of the market, as well as lowering prices due to the pervasion of cheap smuggled fertilizer from China. Since 2012, consumption of NPK in Vietnam has occupied the largest share of total fertilizer consumption in Vietnam market (more or less 37% of total fertilizer consumption at all types). From a country that has to import fertilizer, Vietnam has been able to supply domestic consumption of ferti- lizers: By establishing new factories and expanding current scale production, there is a significant increase in fertilizer production from approximately VND 5,370 thousand tons in 2009 to over 9 thousand tons in 2014. Meanwhile, total imported fertilizer is in a downward trend leading to a supply surplus for Urea, phosphate and NPK. However, SA and potassium still depend on imports entirely. Distribution system for fertilizer in Vietnam is very fragmented and regional-based: Fertilizer is distributed through a complicated and overlapping distribution system consisting of 4 major groups of players (fertilizer manufacturers, trading companies, distributors, and agents level 1,2 and 3). No players have a distribution network by themselves. Rather, they connect with different agents to distribute fertilizer products. Source: StoxPlus Market sizing by total consumption, 2010 – 2015F 4. KEY FINANCIALS OF TOP 10 PLAYERS (listed companies only) Vinachem 50% Baconco 5%Fivestar 8% Can Tho fertilizer & Chemical JSC 5% General materials biochemical Fertilizer JSC 9% Song Gianh Corporation 8% Quang Binh Agricultural Corporation 2% Apromaco 4% JVF 9% 3. MARKET SHARE Source: StoxPlus consolidated Market share of NPK Fertilizer sector by capacity of local manufacturers, as of 31/12/2014(thousand MT/year) Company Total assets (US$ million) Net Revenue (US$ million) EBITDA (US$ million) ROA ROE Phu My Fertilizer 472.37 446.10 72.71 10.48% 12.09% Petrolimex Petrochemical 167.17 318.06 19.85 8.08% 23.90% Binh Dien Fertilizer 139.50 297.93 23.52 7.77% 30.33% PetroVietnam Camau Fertilizer 772.89 282.37 118.45 5.32% 18.23% Lam Thao Fertilizers 123.81 232.89 31.21 16.15% 30.25% SouthEast PVFC 12.72 131.81 2.08 9.63% 18.34% Quang Binh Import And Export 72.89 124.04 4.63 6.48% 25.39% Petro Viet Nam Fertilizer and Chemical Southern West 12.55 119.05 2.12 12.68% 14.94% Central Petrovietnam Fertilizer and Chemicals 12.49 109.69 2.78 16.90% 27.55% The Southern Fertilizer 73.75 104.55 9.36 5.59% 17.15% Source: StoxPlus If you want to have further information, please contact person below: Research Ms. Lan Nguyen Senior Manager lan.nguyen@stoxplus.com +84(4) 35626962 (ext.109) Business Information Ms. Hue Vuong Managing Director hue.vuong@stoxplus.com +84(8) 38233485 (ext.802) Financial Information Ms.Trang Truong Managing Director trang.truong@stoxplus.com +84(4) 35626962 (ext.114) Research Business Information Financial InformationResearch Business Information Financial Information Fertilizer FACT SHEET Dated September 25th 2015