Impact of Sales Team Engagement [INFOGRAPHIC]
•
3 likes•3,943 views

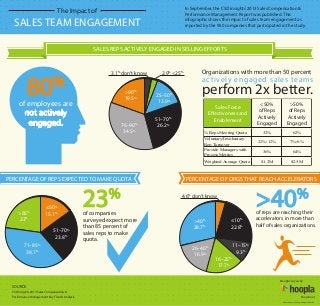
In September, the CSO Insights 2013 Sales Compensation & Performance Management Report was published. This infographic shows the impact of sales team engagement as reported by the 950 companies that participated in the study.
Recommended

Recommended
More Related Content
Viewers also liked
Viewers also liked (11)
Impact of Sales Team Engagement [INFOGRAPHIC]
- 1. In September, the CSO Insights 2013 Sales Compensation & Performance Management Report was published. This infographic shows the impact of sales team engagement as reported by the 950 companies that participated in the study. The Impact of SALES TEAM ENGAGEMENT SALES REPS ACTIVELY ENGAGED IN SELLING EFFORTS 3.1% don’t know 80 % >90% 19.5% of employees are not actively engaged. 76–90% 34.5% 2.9% <25% 25–50 13.9% % Organizations with more than 50 percent actively engaged sales teams perform 2x better. Sales Force Effectiveness and Enablement 51–70% 26.2% % Reps Meeting Quota Voluntary/Involuntary Rep Turnover Provide Managers with Process Metrics Weighted Average Quota PERCENTAGE OF REPS EXPECTED TO MAKE QUOTA 23 % ≤50 15.1% % >85% 23% 51–70% 23.8% 71–85% 38.1% of companies surveyed expect more than 85 percent of sales reps to make quota. <50% of Reps Actively Engaged >50% of Reps Actively Engaged 32% 62% 22%/12% 7%/6% 36% 64% $1.2M $2.5M PERCENTAGE OF ORGS THAT REACH ACCELERATORS >40 % 4.6% don’t know >40% 28.7% 26–40% 16.9% ≤10% 22.8% of reps are reaching their accelerators in more than half of sales organizations. 11–15% 9.3% 16–25% 17.7% brought to you by: SOURCE: CSO Insights 2013 Sales Compensation & Performance Management Key Trends Analysis hoopla.net ©2013 Hoopla Software. All Rights Reserved.