

Recommandé
Contenu connexe
Similaire à Gannt chart (to do list)
Similaire à Gannt chart (to do list) (20)
Plus de Confidential
Plus de Confidential (20)
Gannt chart (to do list)
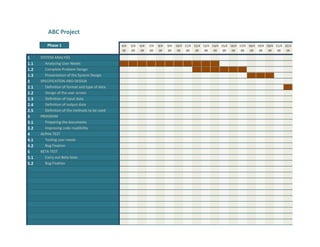
- 1. ABC Project 1 2 3 4 5 6 7 8 9 10 11 12 13 14 15 16 17 18 19 Phase 1 4/4 5/4 6/4 7/4 8/4 9/4 10/4 11/4 12/4 13/4 14/4 15/4 16/4 17/4 18/4 19/4 20/4 21/4 22/4 09 09 09 09 09 09 09 09 09 09 09 09 09 09 09 09 09 09 09 1 SYSTEM ANALYSİS 1.1 Analyzing User Needs ██████████████████████████████████ █ █ █ █ █ █ █ █ █ █ 1.2 Complete Problem Design ███████████████████ █ █ █ █ █ 1.3 Presentation of the System Design ██████████ █ █ 2 SPECİFİCATİON AND DESİGN 2.1 Definition of format and type of data ████ 2.2 Design of the user screen 2.3 Definition of input data 2.4 Definition of output data 2.5 Definition of the methods to be used 3 PROGRAM 3.1 Preparing the documents 3.2 Improving code readibility 4 ALPHA TEST 4.1 Testing user needs 4.2 Bug Fixation 5 BETA TEST 5.1 Carry out Beta tests 5.2 Bug Fixation
- 3. 20 21 22 23 24 25 26 27 28 29 30 31 32 33 34 35 36 23/4 24/4 25/4 26/4 27/4 28/4 29/4 30/4 1/5 2/5 3/5 4/5 5/5 6/5 7/5 8/5 9/5 09 09 09 09 09 09 09 09 09 09 09 09 09 09 09 09 09 1 ## ## 1 ## ## 1 ## ## 1 ## ## 1 ## ## ████████████████████████████████████████████████████ 1 █ █ █ █ █ █ █ █ █ █ █ █ █ █ █ █ ## ## ████████████████████████████████████████ 1 █ █ █ █ █ █ █ █ █ █ █ █ ## ## █████████████ █ █ █ 1 ## ## ████████████████ 1 █ █ █ █ ## ## 1 ## ## 1 ## ## 1 ## ## 1 ## ## 1 ## ## 1 ## ## 1 ## ## 1 ## ## 1 ## ## 1 ## ## 1 ## ## 1 ## ## 1 ## ## 1 ## ## 1 ## ## 1 ## ## 1 ## ## 1 ## ## 1 ## ## 1 ## ##
- 4. 1 ## ##
- 5. Follow the steps to enable your online Gannt Chart(To Do List). 1) Type the name of the project: ABC Project 2) Enter the planned beginning and ending date of the project: Beginning: 4/4/2009 Ending: 7/7/2009 Duration: 94 3) Select the time unit that you want to display your project progress. There are 36 columns available. Hence if the necessary number o your project will be divided into phases (at most 5). Since, it is better to view the whole project progress at a time, with your beginning and ending dates, selecting Weeks is suggested. Days Weeks Months Quarters Years 3 page(s) is necessary for displaying your project. 4) Type the number of main items of the project and the number of sub items of them. Total number of items need not exceed 30. Number of Main Items: 1 2 3 4 5 6 Main Item Nb. Number of Sub Items Total number of 19 rows. 1 3 2 5 3 2 4 2 5 2 5) Type the project item descriptions that you want to keep track of (fill only the white cells): Description 1 System Analysis 1.1 Analyzing User Needs 1.2 Complete Problem Design 1.3 Presentation of the System Design 2 Specification and Design 2.1 Definition of format and type of data 2.2 Design of the user screen 2.3 Definition of input data 2.4 Definition of output data 2.5 Definition of the methods to be used 3 Program 3.1 Preparing the documents 3.2 Improving code readibility 4 Alpha Test 4.1 Testing user needs 4.2 Bug Fixation 5 Beta Test 5.1 Carry out Beta tests 5.2 Bug Fixation
- 6. >> Your Gannt Chart (To Do List) is ready to use, further steps are for online use. 6) Visit the site below: http://www.spreadsheetweb.com/getting_started.htm You will only need the username and password to create your online Gannt Chart (To Do List). 7) Visit the site below: https://www4.spreadsheetweb.com/SpreadsheetWEB// Login to page with your new account information. 8) Click "Add Web Application" to upload this file. Your online Gannt Chart (To Do List) will be created automatically. You can simply use the Gannt Chart (To Do List) from that link or place it on your website. >> Your online Gannt Chart (To Do List) will look like: http://www1.spreadsheetweb.com/SpreadSheetWEB/Output.aspx?ApplicationId=539ed3b9-a1fe-4ac7-bfd0-bdda9a7eaa20 >> In order to see more online applications created with PSW you can check the link below: http://www.spreadsheetweb.com/demos.htm Copyright (c) 2009 Pagos, Inc., http://www.pagos.com/
- 7. 94 days nce if the necessary number of columns exceeds 36 columns, electing Weeks is suggested. tems need not exceed 30. Beginning Date Ending Date 4/4/2009 4/14/2009 4/12/2009 4/17/2009 4/18/2009 4/20/2009 4/22/2009 5/10/2009 4/27/2009 5/9/2009 5/1/2009 5/4/2009 5/5/2009 5/15/2009 5/10/2009 5/17/2009 5/16/2009 6/1/2009 5/27/2009 6/3/2009 6/6/2009 6/10/2009 6/9/2009 6/21/2009 6/23/2009 6/29/2009 6/25/2009 7/7/2009
- 9. 1 nb sheet 0 36 Days 94 3 Phase 1 Phase 1 1 37 252 Weeks 14 1 Phase 2 Phase 2 2 1 253 1080 Months 3 1 Phase 3 Phase 3 3 #### 1081 3240 Quarters 1 1 Phase 4 4 3241 131400 Years 0 0 Phase 5 5 5 1 1 3 1 2 FALSE 1 5 5 3 FALSE 1 2 11 4 FALSE 1 2 14 5 FALSE 1 2 17 6 TRUE 0 0 0 Main Sub Main Sub Main 1 TRUE FALSE 1 0 1 FALSE 2 FALSE TRUE 0 1 1 FALSE 3 FALSE TRUE 0 2 1 FALSE 4 FALSE TRUE 0 3 1 FALSE 5 TRUE FALSE 2 0 2 FALSE 6 FALSE TRUE 0 1 2 FALSE 7 FALSE TRUE 0 2 2 FALSE 8 FALSE TRUE 0 3 2 FALSE 9 FALSE TRUE 0 4 2 FALSE 10 FALSE TRUE 0 5 2 FALSE 11 TRUE FALSE 3 0 3 FALSE 12 FALSE TRUE 0 1 3 FALSE 13 FALSE TRUE 0 2 3 FALSE 14 TRUE FALSE 4 0 4 FALSE 15 FALSE TRUE 0 1 4 FALSE 16 FALSE TRUE 0 2 4 FALSE 17 TRUE FALSE 5 0 5 FALSE 18 FALSE TRUE 0 1 5 FALSE 19 FALSE TRUE 0 2 5 FALSE
- 10. 20 FALSE FALSE 0 0 5 TRUE 21 FALSE FALSE 0 0 5 TRUE 22 FALSE FALSE 0 0 5 TRUE 23 FALSE FALSE 0 0 5 TRUE 24 FALSE FALSE 0 0 5 TRUE 25 FALSE FALSE 0 0 5 TRUE 26 FALSE FALSE 0 0 5 TRUE 27 FALSE FALSE 0 0 5 TRUE 28 FALSE FALSE 0 0 5 TRUE 29 FALSE FALSE 0 0 5 TRUE 30 FALSE FALSE 0 0 5 TRUE
- 11. ████ 1 2 3 4 5 6 7 8 9 10 11 12 13 14 15 16 17 1 ######### #### #### #### #### #### #### #### #### #### #### #### #### #### #### #### 2 #### #### #### #### #### #### #### #### #### #### #### #### #### #### #### #### #### 3 #### #### #### #### #### #### #### #### #### #### #### #### #### #### #### #### #### 4 5
- 13. 18 19 20 21 22 23 24 25 26 27 28 29 30 31 32 33 34 35 36 #### #### #### #### #### #### #### #### #### #### #### #### #### #### #### #### #### #### #### #### #### #### #### #### #### #### #### #### #### #### #### #### #### #### #### #### #### #### #### #### #### #### #### ####