The Fit for Passkeys for Employee and Consumer Sign-ins: FIDO Paris Seminar.pptx
Mh gw relative study of ground water dynamics in earth quake affected area in latur district
1. 1
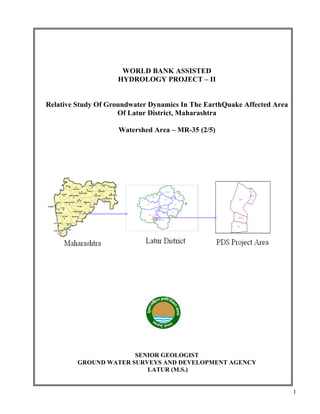
WORLD BANK ASSISTED
HYDROLOGY PROJECT – II
Relative Study Of Groundwater Dynamics In The EarthQuake Affected Area
Of Latur District, Maharashtra
Watershed Area – MR-35 (2/5)
SENIOR GEOLOGIST
GROUND WATER SURVEYS AND DEVELOPMENT AGENCY
LATUR (M.S.)
2. 2
CONTENTS
Sr. No. Subject Page No.
I Introduction 03
II Location and Demography 06
III Rainfall and Climate 07
IV Physiography And Drainage 07
V Geomorphology 08
VI Geology 09
VII Baseline Hydrogeological Survey 11
i) Objective 11
ii) Methodology 12
iii) Hydrogeology 13
iv) Cropping pattern 21
v) Geophysical Investigation studies 22
vi) Water Quality studies 28
vii) Isotope and hydrochemical investigation 36
VIII Conclusions and recommendations 42
3. 3
ANNEXURE
Sr.No. Subject Page No.
I Photo House near Epicentre of Earthquake 44
II Photo Surface Rupture Developed Near Epicentre of Earthquake 44
III Photo ESR Fallan at Kawtha 45
4. 4
RELATIVE STUDY OF GROUNDWATER DYNAMICS IN THE
EARTHQUAKE AFFECTED AREA OF LATUR DISTRICT, MAHARASHTRA
INTRODUCTION:
The 1993, earthquake, in central peninsular India in Latur district, of Maharashtra is one of the
latest intra tectonic event, responsible for a large disaster. In spit of heavy losses of human and animal
lives as well as property, a positive side of this tragedy, provided new insights into Geologic,
Engineering and Cultural factor that controlled the distribution and degree of damage.
*This earthquake nucleated at a shallow depth (5 Km) was associated with hundred of after
shocks. The rupture area was fairly small 38.5 Sq.km involving only a fault length of 5.5 km.
Deeper trenches exposed layers of Basalt, thrust in similar fashion, suggesting repetiton of
movements. A wide impact zone comprising minute fragments of rocks and grounded mass with
yellowisth clay was an indication of repeated faulting- evidences of thrusting were observed in few
quarries and open wells.
LATUR EARTHQUAKE 1993. A GLIMPSE:
On 30 Th September 1993 the main shock centered near the village Killari, in Latur district at
local time 00:03:053 (22:25:53 GMT, September 29)
Ma-6.4, Mb-6.3, Mw-6.1, centroid depth 5 Km, moment tensor solution, yielding an almost
pure thrust, with Quasi - horizontal P-axis striking N 31 E.
A widespread death and destruction, death toll about 10,000 or even more and more than
15,000 injured highest relative death toll 35 % in Killari (Latur) and chincholi (Osmanabad).
Historic seismicity suggests, that casualties and damages, from earthquakes with magnitude of
5.5 or greater occur, relatively offen in cratonic India. Thus the Ma-6.4 event is satisfactorily
consistent, with general level of seismicity in cratonic India, but is unusual in the larger number of
casualties.
SURFACE RUPTURE:
The shallow depth of rupture which reached the surface and cultural and typical rural setting
combined with traditional housing design of the epicentral area,as well as the timing of the earthquake,
(in the middle of the night) when most of the people were indoor, is particularly vulnerable. There was
a complete destruction of Stone/Mud structures in an area of about 15.0 Kms wide.
5. 5
From the investigations of the surface rupture after a few weeks, the main shock,
discontinuous scarps were discernible along W-NW Zone about 1 Km long, starting 1.5 KM west of
village Killari. The surface trace of the rupture was very complex, multibranched, double vergent and
discontinous. Most scarps trend approximately E-W, a few N - NE trending scarps showed evidence of
predominant horizontal components of motion. The sense of movements was consistent in each case,
with the interpretation as Transform Faults connecting diffrent branches of system.
STRUCTURAL DEFORMATION:
From investigations along the exposures along 3 Trenches (1-1.5m deep) two distinct modes
of faulting would be identified in the weathered basalt and shearing in the pre existing fractures, was
accomplished where pre-existing and newly splintered fragments were rotated these zones had lost
cohesion (and probably density as well) and were easily identified on the trench walls.
As surface ruptre was identified and mapped near the village Killari and inferred to extend, at
least to the village of Talani. Surface deformation features reflect a Reverse Fault dipping to the SW.
It was noted that the zone of highest relative fatalities (20-30 %) is centered South West of the trace of
the”Thrust” above the infered Rupture. Also this rupture was centered about 10.00 Km from the lower
Terna Dam (at Makani).
Except for the precursory activity in 1992* The area was not known for prior earthquakes
during the historic, period neither any evidence of Holocene ruptures nor accumulated neocene
deformation in the form of prehistoric scarps or a topographic rise. No evidence of pre – 1993 faulting
of the late cretaceous Deccan traps has been reported. Hence the 1993 rupture might have represented
as a new fault. All though it could have reactivated a pre-cenozoic fault in the basement below the
traps.
A very active swarm between August and October 1992 (125 events in Killari) the largest
event on 18 Th October 1992 (Mb 4.5) caused damage to many stone & mad buildings in Killari.
Reference: - From EERI SPLEQ Report EERI News Letter vol/28.No-1 Jan 1994
6. 6
HISTORY OF EARTHQUAKES IN THE STUDY AREA
On September 29, 1993 (local time Sep. 30, 4.29 h) an earthquake of magnitude Ms=6.3 struck
the Latur region of Maharashtra, India and claimed about 10,000 lives and injured 30,000 people. This
is the highest death toll due any stable continental region earthquake, so far. After Mohan and Rao
(1994) the earthquake had severely damaged the villages Killari, Sastur, Holli, Yekundi, Kawtha,
Rajegaon, Mudgar, Makni and others (Figure 1).There is some evidence for the occurrence of
earthquakes in this region in historical times (Rajendran,
et al.1996, Gupta et al., 1998). The closest seismological observatory in Hyderabad, about 200 km east
of the epicentre, is in operation since December 11, 1967. This observatory did not record any tremors
from the Latur region till 1992. In 1992, 26 tremors with magnitudes ranging from 2.0 to 4.0 were
recorded from this region.
A team of the German Task Force for earthquakes installed in co-operation with the National
Geophysical Research Institute Hyderabad (NGRI) a temporary seismic network that recorded
aftershocks from Oct. 10, 1993 till Jan. 20, 1994. The network consisted of three 3-channel digital data
acquisition systems with a dynamic range of 114 dB (PDAS), 9 analogue data acquisition system
(MLR, Frankfurt University) which recorded the vertical component continuously on magnetic tape at
3 different gains, thereby increasing the dynamic range of the system. These two recording system
were equipped with short-period 1-Hz seismometer MARK L4-3D or MARK L4, respectively. Four
strong motion recording instruments (SYSCOM MR2002) lent by the Swiss Seismological Service
were installed. These are three-component digital instruments with a 12 Bit AD converter. The NGRI
installed five single component drum recorder with a vertical 1-Hz seismometer S-13.The following
important conclusions can be drawn from the German-Indian studies:
1. The p-value, a characteristic feature describing the decay of the aftershock activity with time is
estimated as 0.8 for the 1992 sequence and 0.9 for the aftershock sequence of 1993. Nearly the same
p-values for both 1992 and 1993 sequence indicated that the stress regime did not change in the Latur
region remarkably. It can also be inferred that the 1992 sequence cannot be assumed to be a precursor
to the 1993 sequence.
1. A total of 187 aftershocks were located in this study. The majority of aftershocks clustered close to
the point of confluence of the two tributaries of the Terna River south of Killari village.
2. The high precision determination of the hypocentres of 72 micro-earthquakes with a small aperture
network (Figure 1) shows that the aftershocks lie on a plane striking 125°E and dipping 45° towards
7. 7
SW. They are assumed to mark the fault plane of the main shock. When extended to the surface, the
plane reaches the surface deformation zone. (Figure 2). The two angels estimated agree well with the
strike of 134° and the dip of 47° as derived by Dziewonski et. al (1994) from the centroid moment
tensor solution.
Figure 1 : Village (O) in a densely populated area of about 6 km radius completely destroyed during
the Killari main shock ( ). The small aperture seismic network ( ) used for the high precision
determination of aftershock hypocentres. The red curve encircles the aftershocks that occured on the
main shock fault plane.
LOCATION AND DEMOGRAPHY:
The project area selected for study of dynamics of groundwater under the hydrology project is
located at a distance of about 50 km from district headquarters due SW Latitude 18°04’50” N to 18°
9’ 51” , Longitude 76°33’19” E to 76° 37’ 37”E and are accessible throughout the year by metalled
road. It is located in Manjara sub basin which is a part of Godavari basin in Latur district of
Maharashtra.The Watershed no. MR-35 in the Manjara Subbasin (Godavari Basin) has been selected
and the detailed study confined to the Mini Watershed 2/5 is considered comprising 4 villages namely-
Rajewadi, Lamjana, Sirsal and Chincholi Jogan and two Wadis Gotewadi and Hatkarwadi (Map 1).
Covering an area of 39.52 Sq.Km. Out of a total area of 179.64 Sq.Km. of the watersheds.It is exactly
due north of the epicentral area at Killari. The area falls in Toposhet No 56 B/2 the concept of study is
8. 8
to establish the changes in the Geomorphology, Drainage network and the Structural controls in the
area and their reflection on the Water Table Flucuation and the Chemical quality changes in the
ground water (both in shallow and deep aquifers) and to find out the suitable remedial measures to
restore the groundwater table and Chemical quality potable for drinking water and allied purposes.
MAP 1: Index Map Of Project Area.
RAINFALL AND CLIMATE:
The nearest Rainguage Station is at Ausa Taluka place and the normal rainfall as per the IMD
recording is 813.90 mm and the actual rain this year only 517 mm. The rainfall is mainly from the
SW-NE Monsoon during the months June to October with very low or rare rainfall in the non
monsoon season.
The climate is Arid to Semiarid with temperatures 25-40 degrees.The maximum temperature is
during the month of May.
PHYSIOGRAPHY AND DRAINAGE:
The topography in the study area exhibits a low steep to moderate gentle sloping terrain. The
general slope being towards South.The maximum Altitude is about 675 mt in Rajewadi and lowest is
585 mt in Sirsal village.The local hillock in Rajewadi is due to lateritic cappings extending to about
half a km almost EW. The whole study area is almost a plateau with small local structural outcrops of
massive basalt capping. The gradient is more in the northern part from Rajewadi to Lamjana and low
in the southern part in Chincholi Jogan and Sirsal village area.
9. 9
Map 2 : Drainage Map Of Project Area.
The drainage pattern in the area of study is typical dendritic ( Map 2) starting with Ist order
stream in Rajewadi and Tamberwadi,flowing towards SW and meeting the main nala at Lamjana
flowing NS and onwards, the same nala flows towards south towards Chincholi Jogan and Sirsal that
altimately meets Terana River down to East of Killari village. This nala is only seasonal and flows
upto December.However in the sourtern part of the project area in Sirsal and Chincholi Jogan the local
nalas meet the main nala at almost right angles showing their courses along the lineaments (Joints).In
majority of the area the nala courses are controlled by lineaments.
GEOMORPHOLOGY:
The Geomorphology of the area indicates the plateau comprising a EW running lateritic
outcrops in Rajewadi gaothan and one or two local structural outcrops of massive basalt in the western
and south western part otherwise majority of the area comprises a plateau type of terrain. The terrain
falls under Recharge morphozone. (Map 3)
10. 10
Map 3: Geomorphology Map Of Project Area.
GEOLOGY:
The surface geology denotes except for single outcrops of laterite in Rajewadi the shallow
black cotton soil of 0.3 mt -1.5 mt and a deep soil cover upto 6 m in the nala banks at Chincholi J and
Sirsal villages. The rest of the area is covered by weathered and fractured massive basalt.From the
well sections and nala cuttings it is observed that the massive basalt is underlaid by vesicular basalt
mix with red bole and clay which is about 15 -20 m thick at places. Only single flow of Deccan trap is
observed in the open dugwells in the area. (Map 4)
12. 12
BASELINE HYDROGEOLOGICAL SURVEY
OBJECTIVE:
The objective of this project is to study groundwater dynamics after the earthquake of Latur in
1993.
1) To study the changes in the lateral and vertical movement of groundwater after the earthquake
event through different parameters.
2) The changes in the quality of groundwater after the earthquake event and present status of
Quality for drinking and Irrigation purpose.
3) The study of long term water level trend and also yield from dug wells and bore wells after the
1993 earthquake.
4) Changes in the cropping pattern and also economic status of the peoples affected.
5) Action plan for improving the groundwater conditions by studying recharge conditions of area.
6) Investigation of ground water of deep bore wells in the study by carbon 14 method.
7) To study ground water dynamics in earth quack affected areas of Manjara basin in Latur
district.
8) To study chemical quality of water and to compare it with standards prescribed by Beauro of
Indian Standards.
9) To find suitability of water in the aquifer system for drinking and irrigation purposes.
10) To study Hydro geochemical aspects of the present aquifer.
13. 13
METHODOLOGY:
1) Four Rain gauge units install in 4 villages.
2) Under this project at the dist.level various field investigations have been carried out, to study
the shallow aquifer conditions, Systematic Hydro geological survey through 100% well
inventories of dugwells (both Domestic & Irrigation) in 4 villages Namely Lamjana,
Rajewadi, Chincholi (Jo) and Sirsal, covering about 40.00 sq.Km and investigation of about
354 dug wells in the study area, where in the depth, winter and summer static water levels,
discharge and recuperation parameters along with the study of surface and subsurface
lithology has been carried out. These wells have been connected to MSL for the mapping
purpose.
3) Construction of 4 piezometers and fixing of 8 observations well in 4 villages.
4) Aquifer performance tests of about 8 dug wells have been carried out in the pre monsoon
period of 2010 to study the aquifer parameters like transmissivity, storage capacity and
specific yield, in the study area. Again the same test has been (of the 8 dug wells in the
project area) conducted during the Rabi season of this year to get an overall idea about the
behavior of ground water.
5) Water level monitoring is being carried out by establishing 4 piezometers and 8 observation
wells in the 4 villages, where the water level monitoring is done every month since January
2009, apart from periodical observation of pre & post monsoon water levels in the Taluka.
6) Chemical quality monitoring of the above piezometers and observation wells(by collection of
water samples) is being done during the post monsoon and pre monsoon periods by collection
of water samples & analysis at the Regional lab G.S.D.A.Aurangabad & detail report from
the concerned.
7) Geophysical investigations in the 4 villages have been carried out by making grids of 1*1
Km. on the composite map. In all about 6 VLF profiles and 44 VES have been carried out in
May 2010. The maps & reports have been completed.
8) MOU was done with NGRI, Hyderabad for the one time Isotope study & Hydro chemical
investigations of deep groundwater in project area. Accordingly 10 water samples from the
deep irrigation bore wells in the project area were collected by their technical team led by
Dr.D.V.Reddy, Scientist “F” NGRI during May 2011 & June 2011. The analytic result and
report have been completed in Nov- December 2011.
14. 14
HYDROGEOLOGY:
In four villages namely- Rajewadi, Lamjana, Chincholi J and Sirsal a detailed hydrogeological
study by observation/survey of domestic and agricultural wells have been carried out.
Table 1
Details Of Drinking Water Sources In The Project Area
Sr. No Village
Population
(2001)
Pipe Water
Supply Scheme
Hand
Pumps
Power
Pumps
Remarks
1 Lamjana 7289 1 11 9
2 Rajewadi 491 1 0 0
3 Chincholi J. 862 1 3 0
4 Sirsal 1767 1 2 0
Table 2
Dugwell Surveryed in Project Area.
Sr.No. Village Taluka WS No.
Area of Survey
Sq.Km
Dugwell surveyed Rem.
1 Rajewadi Ausa MR-35 2.40 24
2 Lamjana &
Hatkawadi
Ausa MR-35 21.87 199+16
3 Chincholi J &
Gotewadi
Ausa MR-35 5.42+2.25 58+13
4 Sirsal Ausa MR-35 3 Sq.km part 34
Table 3
Performance Of Dugwells in Project Area.
Sr.No Village Depth of
Wells in Mtrs
Aquifer
thickness in
Mtrs
Yield range in
KLPN
Winter/Summer
Percentage of
Seasonal wells
1 Rajewadi 5.80-17.50 1.00-7.60 30-300/15-150 30%
2
Lamjana/
Hatkarwadi
6.00-26.00 0.50-15.50 50-600/15-100 68%
3 Chincholi Jo.
/Gotewadi
6.00-19.40 1.00-6.50 30-200/15-120 58%
4 Sirsal 9.00-35.00 1.00-8.60 50-600/15-80 25%
15. 15
The detailed investigations of the domestic shown in (Table No1) and irrigation wells Shown
in (Table No 2 & 3) reveals that majority of wells are functioning only seasonally due to desaturation
of the shallow aquifer by the end of January i.e.Rabi season and only a few of the wells are perennial
and some of the dugwells being augumented through moderate to deep borewells for the cultivation
crops in summer season.This is mainly due to the scanty rainfall in the area and overexploitation of
groundwater for perennial crops like Sugarcane and Grapes. Even the supporting borewells are not
yielding to the expectation due to poor recharge condition and desaturation of deeper aquifer. (Map
No. 5 & 6). This shows a deteriorating depleting trend of water levels of both shallow and deep
aquifers.
Table 4
Observation Well Data of Project Area.
Chincholi Jo Karla Killari
1990 2.3 0.8 1990 5.4 2.9 1990 13 8.3
1991 7.9 3.78 1991 5.2 2.9 1991 14.65 8.3
1992 9.2 4.95 1992 3 1.7 1992 18.7 16.4
1993 13.9 1.65 1993 9.3 6.1 1993 18.7 18.7
1994 13.9 7 1994 9.3 8.55 1994 18.7 18.7
1995 13.9 3.6 1995 9.3 4.4 1995 18.7 18.7
1996 9.6 1 1996 7.2 3.1 1996 16.1 15.3
1997 7.4 7.85 1997 5.3 6.8 1997 16.1 18.7
1998 9.05 0.9 1998 9.3 3.4 1998 18.7 9
1999 7.2 1.25 1999 6.2 4.05 1999 18.7 11.8
2000 8.5 3.1 2000 9.3 4 2000 18.7 10.65
2001 9.3 2.7 2001 9 3.65 2001 18.7 18.7
2002 8.85 6 2002 9.3 4.2 2002 18.7 18.7
2003 13.9 2.05 2003 9.3 4.15 2003 18.7 18.7
16. 16
Map 5: Winter Static Water Level (2010-11) of Project area
Map 6: Summer Static Water Level Map Year (2010-11) Of Project Area
17. 17
Drastic fluctuations in the water table conditions in the pre and post monsoon static water
levels recorded in the observation wells in Ausa Taluka as well as the observation wells fixed in four
villages,shown in (Table 4&5) indicate a significant change in the water table conditions after the
main earthquake event followed by a few small scale tremors afterwards in the almost every year in
this area.Though this situation is partly refered to as, due to the fluctuating rainfall conditions year
after year which are seasonal,repeated tremors have affected in the opening and closing up the
fractures and joints already disturbed during the main event and after shocks, which must have
resulted in the desaturation of aquifer even before the onset of summer in this area as shown in (Map
No 7) Table 5
Water Table Fluctuation in the Observation Wells Of Project Area Taluka Ausa
Sr.
No.
OBW
village
SWL May
2009
(mt bgl)
Avg of
SWL of
May
2004-2008
Diff.
SWL
SWL Oct.
2009
(mt bgl)
Avg of SWL
of Oct 2004-
2008
Diff.
SWL
1 Masurdi 9.60 8.44 1.16 8.10 5.85
2.25
2 Ausa 10.50 9.68 0.82 4.80 2.69
2.11
3 Borfal 18.40 16.30 2.10 4.90 3.40
1.50
4 Talni 17.00 16.14 0.86 13.40 11.42
1.98
5 Chincholi J 9.30 9.00 0.30 3.55 2.18
1.37
Map: 7 Water table Fluctuation Map Post & Pre Monsoon season of the Project area.
20. 20
Hydrograph No. 5 & 6
Village Talani – SWL gone down 12 to 16 m and Waterlevel trend change from rising to falling
21. 21
Likewise a drastic depletion in water yields and depth of water struck (Water bearing zone)
have been reported in the area of study.From the statistics of domestic borewells taken in four villages
for the drinking water purpose,depth of borewells after the earthquake events seem to have increased
from 60-90 mt to as deep as 184 mt.bgl., and yield from such deep borewells have minimized in
contrast to the yields that were reported earlier to the main earthquake event.This year deep borewells
upto 200 mt are being dug in the area for the irrigation purpose with very low success ratio.
Table 6
Details Borewell Taken Before & After Earthquake
Sr.No Village
Details of BW taken before
1993
No./Depth/yield(lph)
Details of BW taken after 1993
No./Depth/yield(lph)
Rem.
1 Sirsal 10 /39-91 / 3378-9310 5 / 58-120 / 597
2 Chincholi J 4 / 60-80 / 33505-42494 6 / 60-120 /597-1250
3 Lamjana 5 / 71-93 / 3378-33570 25 / 49-184 / 597-3382
4 Rajewadi 4 / 75-84 / 597-9376 5 / 75-120 / 1648
CROPPING PATTERN:
In project area kharif, Rabbi and Summer Crops are also taken by villagers. The change in
cropping is observed in the comparative statement given below.
Table 7
Comparision of Cropping pattern Before and After Earthquake event
Sr. No. Village Kharip
Crops
Rabbi
Crops
Summer
Crops
Sprinkler
Sets
Rem.
Cropping pattern after Earthquake event
1 Lamjana 2290 1160 65 Main summer crop
was sugarcane on
flood irrigation from
dugwell with 200 to
300 ft deep borewell
2 Sirsal 700 235 33
3 Chincholi
Jo
329 160 12
4 Rajewadi 210 58 6
Total 3529 1613 116
Cropping pattern after Earthquake event
1 Lamjana 1608 1050 62 54 Sugarcane crop is
shift to Horticulture
and sprinkler use and
lift irrigation through
chincholi Tank
2 Sirsal 627 340 45 162
3 Chincholi
Jo
380 150 22 158
4 Rajewadi 243 82 8 7
Total 2858 1592 137 381
22. 22
GEOPHYSICAL INVESTIGATION STUDIES:
Vertical Electrical Soundings were carried out in the project area Watershed no 35, Mini
Watershed no 2/5 of Manjara Sub basin, Ausa Taluka, District Latur to understand the subsurface geo-
electrical layer distribution. Total six villages namely Lamjana, Chincholi (J), Sirsal, Rajewadi,
Hatkarwadi and Goewadi fall in the study area,.The entire area is covered by 43 Vertical Electrical
Soundings. Schlumberger electrode array with a maximum half current electrode separation of 200 m
(AB/2) was used in carrying out Vertical Electrical Soundings. (Map No) A pre determined set of
current electrode separations with calculated geometric factors is used for collection of sounding data.
The instrument for the collection of data used is CRM 500 (make of ANVIC systems Pune). The
instrument directly gives the resistance value for each current electrode separation which is further
multiplied with the geometric factor gives the apparent resistivity. The sounding data is interpreted
by partial curve matching technique, using Orellana and Mooney Standard Graphs for Schlumberger
sounding data. The raw data and the interpreted results are used for qualitative and quantitative
interpretation. The raw data is used in preparing the Iso-resistivity maps using the values of particular
separation, which gives the variation of resistivity values within the area, in terms high and low
resistivity zones.The interpreted results show the true resistivity values and its thickness. The results
are further utilized for preparing geo-electric section, which gives the idea of subsurface formations.
ISO RESISTIVITY MAPS
Iso Resistivity maps for different half current electrode separations namely 1.5m, 2m, 10m,
15m, 20m, 30m, 40m, 50m, 60m, 70m, 80m, 90m, 100m, 120m, 150m, 180m and 200m were
prepared using the obtained apparent resistivity values. The obtained apparent resistivity values are in
the range of 8 ohm-m to 535 ohm-m. Four resistivity zones were marked based on the resistivity
ranges. Table 8
Resistivity Range, Type Zone & Colour Code Used.
Resistivity Range ( ohm-m ) Type of Zone Colour code used
> 20 ( ohm-m ) Very Low Yellow
20 to 50 ( ohm-m ) Low Green
50 to 70 ( ohm-m ) Medium Blue
< 70 ( ohm-m ) High Red
23. 23
Map 8: Iso Resistivity Maps of Project Area
AB/2 –80m
ISORESISTIVITYMAP,PDS,LATURISORESISTIVITYMAP,PDS,LATUR
AB/2 –150m
AB/2 –50mAB/2 –15m
24. 24
GEO-ELECTRIC CROSS SECTION A-AL
A geo-electric cross section is drawn along A-Al
direction comprising of 8 Vertical Electrical
soundings (namely VES 2, VES 6, VES 12, VES 18, VES 24, VES 31, VES 37 and VES 41) passing
through the villages Lamjana, Chincholi and Sirsal. The Reduced level of these VES spots varies
from 602 m to 640 m above Mean sea level.
The thickness of the top layer comprising of topsoil is in the range of 1.2 to 4.7 m. The second
layer is highly conductive (in the range of 9 to 39 ohm-m) upto VES No. 12 having thickness from 8
to 23 m. But from VES No. 12 to VES 31 there exists a highly resistive zone ( 91 to 245 Ohm-m)
having thickness of 13 to 20 m. At VES No. 37 a low resistive zone of 16 Ohm-m having thickness
29 m is observed. Again at VES No. 41 a very high resistive zone in the range of 260 ohm-m having
thickness of 14 m is observed.
The third layer up to VES No. 12 is highly resistive in the range of 80 to100 ohm-m. The third
layer from VES no 18 to VES no 31 is highly conductive in the resistive range of 28 to 33 Ohm-m.
The third layer at VES No. 37 is highly resistive in the range of 85 Ohm-m. The third layer at
VES No. 41 highly conductive with resistivity value at 40 m.
Section No 1 :
Geo Electrical Section Along A-A’ of Project Area.
25. 25
GEO-ELECTRIC CROSS SECTION B-BL
A Geo-electric cross section is drawn along B-Bl
comprising of 6 Vertical Electrical soundings
namely VES 22, VES 23, VES 24, VES 25, VES 26 and VES 27 passing through the villages
Lamjana and Hatkarwadi. Reduced levels’s of these VES spots varies from 614 m to 642 m above
mean sea level.
The thickness of the top layer comprising of top soil varies from 1.6 to 2.7 m.The second layer
is highly resistive (in the range of 91 to 600 ohm-m ) having thickness in the range of 10 to 35 m.
Third layer is of low resistive zone in the range of 20 to 64 ohm-m.
Section No-2
Geo- electrical section Along B-B’
26. 26
INTERPRETATION OF VERTICAL ELECTRICAL SOUNDING CURVES USING FACTOR
INTERPRETATION TECHNIQUE
The obtained VES curves have also been interpreted using Factor interpretation technique. Few
prominent deeper low resistivity zones have been picked up by this technique. The flat portion in the
FACTOR plots gives prominent low resistive zones. The different low resistivity zones obtained
through this interpretation technique is shown in the below table.
GEO-ELECTRIC CROSS SECTION A-A.
A geo-electric cross section is drawn along A-A direction comprising of 8 vertical Electrical
sounding’s (nameiy VES 2,VES 6, VES 12, VES 18, VES 24, VES 31, VES 37 and VES 41) passing
through the village Lamjana, Chincholi and Sirsal. The Reduced level of these VES spots varies from
602 m to 640m above mean sea level.
The thickness of the top layer comprising of topsoil is in the range of 1.2 to 4.7m. the second
layer is highly conductive (in the range of 9 to 39 ohm-m) upto VES No.12 having thickness from 8
to 23m. But from VES No.12 to 31 there exists a highly resistive zone (91 to 245 ohm-m) having
thickness of 13 to 20m. At VES No.37 a low resistive zone of 16 ohm-m having thickness 29 m is
observed. Again at VES No.41 a very high resistive zone in the range of 260 ohm-m having thickness
of 14 m is observed.
The third layer up to VES No.12 is highly resistive in the range of 80 to 100 ohm-m. The third
layer from VES no 18 to VES no 31 is highly conductive in the resistive range of 28 to 33 ohm-m.
The third layer at VES No.37 is highly resistive in the range of 85 ohm-m. The third layer at
VES No 41 highly conductive with resistivity value at 40 m.
GEO-ELECTRIC CROSS SECTION B-B.
A geo-electric cross section is drawn along B-B comprising of 6 vertical Electrical sounding’s
nameiy VES 22,VES 23, VES 24, VES 25, VES 26, and VES 27 passing through the village Lamjana
and Hatkarwadi. Reduced level’s of these VES spots varies from 614 m to 642m above mean sea
level.
The thickness of the top layer comprising of top soil varies from 1.6 to 2.7m. The second layer is
highly resistive (in the range of 91 to 600 ohm-m) having thickness in the range of 10 to 35m.
Third layer is of low resistive zone in the range of 20 to 64 ohm-m.
27. 27
INTERPRETATION OF VERTICAL ELECTRICAL SOUNDING CURVES USING FACTOR
INTERPRETATION TECHNIQUE.
The obtained VES curves have also been interpreted using Factor interpretation technique. Few
prominent deeper low resistive zones have been picked up by this technique. The flat portion in the
Factor plots gives prominent low resistive zones. The different low resistive zones obtained through
this interpretation technique is shown in the below table.
Table 8
Different Low Resistive Zones Obtained Through This Interpretation Technique
VES.No Village Low Resistive Zones in m
1 Lamjana 8-10,95-120
2 Lamjana 40-50,80-90
3 Lamjana 45-50,80-90,105-120
4 Lamjana 30-35,100-110,140-150
5 Lamjana 70-80,100-120
6 Lamjana 8-10,20-30
7 Lamjana 18-22
8 Lamjana 140-150
9 Lamjana 20-30,60-70,140-150
10 Lamjana 70-80,90-130
11 Lamjana 95-120
12 Lamjana 60-70,90-120
13 Lamjana 20-30
14 Rajewadi 20-30,50-60
15 Rajewadi 20-30
16 Lamjana 40-50,140-150
17 Lamjana 60-70,140-150
18 Lamjana 90-110
19 Lamjana 140-150
20 Lamjana 60-70
21 Lamjana 20-30,140-150
22 Lamjana 70-90
23 Lamjana 40-50,60-70,100-120
24 Lamjana 60-70
25 Lamjana 20-30
26 Hatkarwadi 20-30,80-90
27 Hatkarwadi 20-30,70-80
28 Gotewadi 140-150
29 Gotewadi 85-95,140-150
30 Chincholi (J) 20-30,60-70
31 Chincholi (J) -
32 Chincholi (J) 140-150
33 Gotewadi 140-150
34 Gotewadi 10-15,90-100
35 Gotewadi 90-110
28. 28
36 Gotewadi 12-15
37 Sirsal 20-30
38 Sirsal -
39 Sirsal 60-65,90-100,140-150
40 Sirsal 60-70,90-110
41 Sirsal 85-95,105-120,130-140
42 Sirsal 140-150
43 Sirsal 20-30,40-50,100-120
WATER QUALITY ANALYSIS REPORT:
Chemical quality parameters of the drinking water wells mainly observation wells are tested
periodically by the regional laboratory situated at Aurangabad.Recently the water samples of 7
observation wells in 4 villages of the study area have been analyzed for the period 2005-2009.
METHODOLOGY:
Total four villages namely Sirsal, Rajewadi, Lamjana and Chincholi jogan of Ausa Taluka from
Latur District were selected for the study. In all 15 water samples covering 4 bore well (deeper
aquifer) and 11 water samples from dug well (shallow aquifer) for premonsoon and postmonsoon
(Feb. and Dec.-10) period were collected by District Senior Geologist Office Latur and accordingly
all samples were analysed for chemical parameters i.e. pH, Electrical conductivity, TDS, Total
Hardness, Ca, Mg, Fe, Total Alkalinity, F, CO3, HCO3, Na, K, Cl, SO4, NO3 etc in regional chemical
laboratory, G.S.D.A., Aurangabad.
In order to find suitability of water for irrigation purposes Percent Sodium and SAR were
calculated. The analyses of various parameters were carried out using standard procedures prescribed
by APHA.
Map No-09 Iso Nitrate Map Dugwell of Project area.
29. 29
Map No- 10 Iso Nitrate Map Borewell of Project area
Map No-11 showing Quality of Ground Water – Nitrate (Source Wise) of Project area
30. 30
Map No-12 Total Dissloved Solid from Dugwell of Project area
Map No-13 Total Dissloved Solid from Borewell of Project Area
31. 31
Table 9
Groundwater quality type in the studied watershed
S.N. village/owner well depth, m
Water type
L-1b Lamjana Surface Water Ca-Mg-Na-HCO3
L-1a Lamjana Drug well 12 Ca-Mg-HCO3
L-4a Sirsal Arvind Drug Well 10 Ca-Mg-HCO3
L-3 Chincholi J. Bhima R.Patil 91 Ca-HCO3
L-2 Chincholi J.Vithal Bhujbal 146 Ca-Na-HCO3-Cl
L-4b Sirsal VenkatBivaji Hande Ca-Mg-HCO3-SO4
L-10 Rajwadi SanjayBajugal 177 Na-Ca-Mg-HCO3
L-10a Rajwadi SanjayBajugal 2 122
Na-Mg-Ca-HCO3
32. 32
L-9 Rajwadi Padmakar 160
Na-Mg-Ca-HCO3
L-7 Sirsal Vijayanad Hagre 125 Na-Ca-HCO3-Cl
L-6 Sirsal Shashikant Dhanure 123 Na-Ca-Cl-HCO3
L-8 Yelwat Sachin F.Shinde 177 Na-Cl-CO3
L-1 Lamjana Thamboli 210 Na-Cl-SO4
L-4 Sirsal, Arvind Dhanure 198 Na-Cl-SO4
OBSERVATIONS:
1) PH- pH varies from 7.36 to 8.2 for borewell and 7.67 to 8 for dug well samples suggests alkaline
in nature of water.
2) TDS – TDS varies from 313 mg/L to 437 mg/L for shallow aquifer (BW) and 247 mg/L to 689
mg/L for deeper aquifer (DW) indicating water is in the permissible limit for potability and
irrigation.(Map No-12 &13).
3) TH – TH observed in the range of 168 mg/L to 224 mg/L for borewell and 172 mg/L to 460 mg/L
for dug well indicating that water is suitable for potability.
4) Ca – Calcium content in the study area varies in between 34 mg/L to 66 mg/L for borewell and
19.2 mg/L to 149 mg/L for dug well .
5) Mg – Magnesium content varies from 14 mg/L to 29 mg/L for borewell and 9 mg/L to 85 mg/L
for dug well . Which are in the permissible limit?
6) Na & K- Sodium concentration varies from 13 mg/L to 16 mg/L for borewell and 11 mg/L to
90.9 mg/L for dug well and potassium concentration varies from 25 mg/L to 33 mg/L for
borewell and 0.4 mg/L to 34 mg/L for dug well .
7) Fe – Maximum concentration found is 0.30 mg/L in dug well and 0.21 mg/L in borewell which
are within permissible range.
33. 33
8) TA –Almost all samples have alkalinity value both for borewell and dug well are in permissible
range.
9) Cl – The chloride content of the area varies from 22 mg/L to 24 mg/L for borewell and 20 mg/L to
140 mg/L for dug well which are within the permissible range.
10) SO4 – The sulphate content varies from 7 mg/L to 22 mg/L for borewell and 14 mg/L to 154
mg/L for dug well which are in desirable limit.
11) NO3 – The presence of NO3 in ground water particularly in shallow aquifer (DW) may be linked
with excessive use of NO3 based fertilizer to increase agricultural product and improper disposal
of human and animal wastes. The maximum value found in dug well samples is 120 mg/L from
village Sirsal-2 of taluka Ausa.(Map No- 9,10 & 11)
12) F- The maximum fluoride concentration found in borewell sample is 2.30 mg/L from village
Sirsal-03 and 1.23 mg/L from village Chincholi jogna of dug well sample of taluka Ausa.
It is observed that Percent sodium values for deeper aquifer (BW) is 12 % and for shallow
aquifer (DW) maximum value found is 38 % ( i.e. Chi-02).
Similarly, the SAR and RSC values for deeper aquifer (BW) is very low while for shallow
aquifer ( DW) the SAR values lies between 0 to 2 and RSC values is very low.
Water quality data has been plotted on Hill Piper diagram and Hydrochemical facies have
evaluated it shows that the predominant cation facies for deeper aquifer (BW) and for shallow aquifer
(DW) is Ca++
+ Mg++
, Na+
+ k+
suggesting recharge to ground water from surface to water bodies.
Majority of the study area is covered for borewell by CO3
--
+ HCO3
-
, Cl-
+ SO4
- -
and for Pre
mansoon 4 dug well samples & Post mansoon 3 samples shows CO3
--
+ HCO3
-
, Cl-
+ SO4
- -
and for
Pre mansoon 3 dug well samples & Post mansoon 1 sample shows Cl-
+ SO4
- -
, CO3
--
+ Hco3
-
indicating the hard water.
Similarly, 4 samples for Pre mansoon & 3 samples for Post mansoon covered in C2S1 for
Dug well and 3 samples of Dug well for Pre mansoon & 1 sample for Post mansoon of Dug well
shows C3S1. 3 samples for Post mansoon of bore well in Post mansoon is in C2S1 & 1 sample for bore
well is in C3S1 for Post mansoon.
34. 34
Table 10
Pre EarthQuake Chemical quality Analysis Report
S N
Pa
ra-
m
et
er
s
Water
sample
collectio
n Year
Pre - Earthquake Chemical quality Analysis report
1982 1982 1982 1887 1887 1887 1990 1990 1990 1990 1993
Name of
Village
Karla
Bore-
gaon
Talni Karla
Bore-
gaon
Talni Karla
Sangav
i
Jawli
Lamj
ana
Chinchol
i Jo
1 pH 8 8.7 8.6 8.1 7.8 8.1 8.8 8.5 8.8 8.7 7.4
2
Conductivity/
Micromos/
cms
865 645 1093 839 615 297 316 487 654 518 405
3 TDS mg/l 554 413 700 537 394 191 202 312 413 332 259
4 Hardness mg/l 496 340 440 360 388 176 140 128 340 80 84
5 Calcium mg/l 114 - 88 65.6 102 35.2 24 28.8 - 11.2 20.8
6
Magnesium
mg/l
50.9 - 52.8 47 35.5 21.1 19.2 13.4 - 12.4 7.7
7 Sodium mg/l 6.6 3.3 4.45 - - - 10 19.5 3.3 100 110
36. 36
7 Sodium mg/l 40 22 13.6 85
16
16 13 13
8 Potassium mg/l 1.6 1.3 0.4 2.3
25
28 30 33
9 Iron mg/l 0.21 0.2 0.24 0.21
0.06
0.11 0.21 0.1
10 Alkalinity mg/l 200 228 192 236
264
228 184 180
11 Carbonate mg/l 0 0 0 0
0
0 0 0
12 Bicarbonate mg/l 200 228 192 236
264
228 184 180
13 Chloride mg/l 60 32 20 134
22
24 24 24
14 Sulphate mg/l 14.08 23.6 24.4 101
7
20 19 22
15 Flouride mg/l 0.91 0.7 1.23 0.97
0.33
0.01 0.45 2.3
16 Turbidity NTU 0.3 0.1 0.2 0.3
0.6
0.2 0.8 0.6
17 Nitrate mg/l 83 57 5 105
28
40 32 38
ISOTOPIC AND HYDROCHEMICAL INVESTIGATION OF DEEP GROUNDWATER IN
PROJECT AREA, TALUKA AUSA, LATUR DISTRICT
C14
dating of groundwater was carried out by NGRI in response to PDS project. NGRI carried
out isotope studies of deep groundwater (maximum of 8 samples) and for one time study. No repeat
samples and analyses. In consultation with GSDA hydrologist, the well locations were finalized (Map
No- 14) and sampling was carried out for isotope analyses during May/June 2011.
SAMPLE COLLECTION
In order to assess the deep groundwater residence time in the aquifer and connectivity between
aquifers, 10 samples are collected from the private deep agricultural wells. The well details are given
in (Table 12). As can be seen from the table, the well depths are ranging from minimum 75 m to
maximum 210 m.
Map No- 14 locations for carbon-14 dating in Project Area
37. 37
Table 12
Details of Bore wells sampled for carbon-14 dating in project area, Ausa Taluka, Latur District.
.Sr.
No
Village/ Owner Depth
mts
Yield
Lit/hr
Water
Struck m
Sampling
Dt.
Sample
Quan., lts.
1 Lamjana Sri Tamboli 210 7770 198 19/05/11 170
2 Chincholi J Sri Vitthal Nhubal 146 750 110 19/05/11 170
3 Chincholi J Sri Bhima R. Patil 91 930 72 19/05/11 120
4 Sirsal Sri Arvind Dhanure 198 7770 183 18/05/11 1010
4b Sirsal Sri Venkat B. Hande 75 15/06/11 100
6 Sirsal Sri Shashikant Dhanure 123 1656 75 15/06/11 230
7 Sirsal Sri Vijayanand Hagre 125 1656 80 15/06/11 230
8 Yelwat
(Killari)
Shi Sachin F. Shinde 177 4930 140
20/05/11
560
9 Rajewadi Sri. Padmakar Rudbe 160 7770 107
18/05/11
300
10 Rajewadi Sri. Sanjay Bajulge 177 15950 122 19/05/11 100
FIELD AND LABORATORY PROCESSING
38. 38
In general, about 100 liters of sample is enough for the C-14 dating. Due to the low bi-
carbonate content in these deep groundwaters, quantity of samples increased to as high as 1000 liters
(Table 1). Even after a few hundred liters of water sample collection, no CO2 was yielded for two
samples. The collected samples are chemically treated in the field and the bicarbonate precipitation
transferred to the laboratory. 14
C activity is measured using the low-level Liquid Scintillation Counter
at NGRI with Benzene as the measuring medium. The sample collection, processing, and
measurement are discussed by Sukhija et al., (2006) and Gupta and Polach (1985).
About 100 ml water sample also collected to measure the hydrochemistry and ~100 ml sample for
stable isotope (oxygen-18 and deuterium) analyses. pH, conductivity, and total dissolved solids (TDS)
were measured immediately after samplings and dissolved anions (F, Cl, NO3 and SO4) and cations
(Na, K, Ca, Mg) were measured using Ion chromatography (Dionex IC-90 and IC-2500) in our lab at
NGRI with an analytical uncertainty of <3%. The Oxygen-18 (δ18
O) and Deuterium (δD) in water
samples were determined using Isoprime stable isotope ratio mass spectrometer and values are
reported relative to standard mean ocean water (SMOW) with uncertainty of ±0.1‰ for δ18
O and
±1‰ for δD.
Based on the different chemical parameters in the collected groundwater samples, over all
chemical quality is assessed using the aquachem software and presented in Fig. 2. As can be seen from
the Table the surface water, dug well waters and shallow bore well waters are calcium - bicarbonate
type indicating the recent rainfall recharge contribution. The remaining borewell waters are dominated
by sodium from the cations and bicarbonate / chloride from anions. These waters may have small
residence time in the aquifer as the ionic exchange from calcium to sodium will take some time.
Relatively the waters of sodium – bicarbonate type indicate some recent recharge contribution, where
as the waters of sodium chloride or sodium – chloride – sulphate may have little longer residence time.
However, due to the mixing of water from different basaltic flows may change its chemical properties.
39. 39
Fig. 2 Piper diagram indicating water quality distribution of different samples
Table 13
Groundwater Quality Type in Project Area.
S.no Village /owner Well depth, meter Water type
L-1b Lamjana / Surface Water Ca-Mg-Na-HCO3
L-1a Lamjana / Drug well 12 Ca-Mg-HCO3
L-4a Sirsal / Arvind Drug Well 10 Ca-Mg-HCO3
L-3 Chincholi J. / Bhima R.Patil 91 Ca-HCO3
L-2 Chincholi J./ Vithal Bhujbal 146 Ca-Na-HCO3-Cl
L-4b Sirsal / VenkatBivaji Hande Ca-Mg-HCO3-SO4
L-10 Rajwadi / SanjayBajugal 177 Na-Ca-Mg-HCO3
L-10a Rajwadi / SanjayBajugal 2 122 Na-Mg-Ca-HCO3
L-9 Rajwadi / Padmakar 160 Na-Mg-Ca-HCO3
L-7 Sirsal / Vijayanad Hagre 125 Na-Ca-HCO3-Cl
L-6 Sirsal/ Shashikant Dhanure 123 Na-Ca-Cl-HCO3
L-8 Yelwat / Sachin F.Shinde 177 Na-Cl-CO3
L-1 Lamjana / Thamboli 210 Na-Cl-SO4
L-4 Sirsal,/ Arvind Dhanure 198 Na-Cl-SO4
The relation between δ18
O and δD of the sampled groundwaters (Fig 3) indicate that, except two
samples all other samples are grouped down side of the Global Meteoric Water Line (GMWL)
indicating rainwater recharge with evaporation. The sample Arvid Dhanure from Sirsal with δ18
O -
3.14‰ and δD -17.45‰ show relatively less evaporation in comparison to other studied groundwaters.
However, the sample Tamboli from Lamjana village is quite different from all other samples with
highly depleted delta values. Though carbon-14 dating was tried for all the 10 groundwater samples
40. 40
from the study area, we could not date the two samples Tamboli and Arvind Dhanure, due to their low
bicarbonate content and poor CO2 yield. Rest of 8 samples, yielded modern age (≤ 60 yr BP).
However, few of them may have short residence time in the aquifer which cannot be resolved through
C-14 dating. Incidentally, the two wells (Tamboli and Arvid Dhanure) deeper than the other wells and
met the water yielding zones at much greater depths i.e., 198 and 183 m respectively than others
(Table 13), and it may not have direct contribution from the recent recharge.
Mixing of groundwater from different flow regimes can be possible, by considering the well
depths, where each well might have penetrated more than two basaltic lava flows. Between these
flows, there exist weathered medium from which groundwater flow takes place. Existence of various
basaltic layers in the studied region is evident from the 617 m deep bore well drilled at Killari by the
National Geophysical Research Institute (NGRI), Hyderabad and Atomic Minerals Directorate
(AMD), Hyderabad (Gupta et al., 2003). It was observed that 338 m thick Deccan trap sequence
covered with eight lava flows. Based on the density measurements on samples from entire borehole
depth, it was assessed that the basaltic flows contain 53% of massive variety and the remaining 47%
vesicular and amygdaloidal (non-massive) variety. Due to this high porosity, there is scope for
connectivity between different flows. Hence the studied bore wells whose depth ranging from 75 to
210 m might have encountered more than two flows and might have encountered the different fracture
systems. Due to the different flows contacts and the fracture network encountered by each well, there
may be some possibility of mixing of groundwater. Due to this mixing, the measurements made on
these waters may show mixed characteristics and the ages may be younger.
41. 41
Fig. 3 δ18
O and δD values of groundwaters from the studied mini-watershed.
RESULTS AND DISCUSSIONS
The chemical and isotopic data of the collected samples is presented in Table 2. In general, the
quality of groundwater in the watershed is quite good with the total dissolved solids raging from 200
to 500 mg/l. The groundwater pH varies between 7 and 8 except 3 samples (Tamboli, A. Dhanure and
Sachin F. Shinde) whose values are 8 to 9.5. Sodium values are ranging from 20 to 160 mg/l and
calcium from 8 to 100 mg/l (but in one sample Ca measured as 150 mg/l). Magnesium and potassium
42. 42
concentrations are relatively low, where its concentrations ranged from 0.1 to 37 mg/l, and 0.5 to 2.4
mg/l respectively. In general, bicarbonate is dominating anion among collected samples ranging from
140 to 567 mg/l, except 3 samples (mentioned under pH) whose concentrations are quite low (18 – 40
mg/l). Chloride and sulphate concentrations are almost same where its rages are 15 to 120 mg/l, and
18 to 120 mg/l respectively. Considerable concentrations of nitrates measured in all the samples i.e., 6
to 74 mg/l, except one sample for which it is zero. Fluoride concentration is ranging from 0.2 to 1.4
mg/l (within permissible limits of drinking water standards, BIS, 2003), except one sample Arvind
Dhanure where it is 1.9 mg/l.
The stable isotope values i.e., oxygen-18 (δ18
O) measured in the groundwaters (barring two wells)
ranging from -0.31‰ to -2‰ and the deuterium (δD) values varies from -8.5‰ to -11.5‰. Two
samples, Thamboli from Lamjana village and Arvind Dhanure from Sirsal village deeper than other
wells have highly depleted δ18
O (-7.27‰ and -3.14‰) and δD (-39.1‰ and -17.5‰) values
respectively (Fig 3). As expected, the stable isotope value for the surface water is more positive side
(δ18
O +4.49 and δD +16.51‰) due to evaporation. Out of 10 samples collected for carbon-14 dating,
only 8 samples were dated due to the less CO2 yield from other 2 samples (Thamboli and Arvind
Dhanure). The measured 8 samples also yielded modern age. i.e., the actual age anything between 0 to
60 years before present.
CONCLUSION:
Inferences drawn after the various investigations
1. Water level depletion observed in shallow and Deeper aquifers after the earthquake May one of
the cause by earthquake.
2. Decline in the water level trend in the observation wells in the taluka pre and post earthquake
periods (Hydrographs No 1 to 6 ).
3. Sudden change in the depth & yields of borewells not observed after the earthquake events
43. 43
4. A significant change observed in the chemistry of groundwater in the regard to the component
like Ca, Mg, Na, K, Hco3, Cl, So4 & total Hardness (CaCo3). (Table No. 9 &13)
5. No drastic change in the Temperature after the earthquake event however an increase of about
0.5o
C temperature of groundwater in the earthquake affected area has been reported after the
study water sample immediately after the earthquake.
6. Significiant change in the crop patterns due to change in yields of wells & borewells (Table –
7 Crop patterns page No. 20 ).
7. Water level rise in bore wells in few locations reported by villagers immediately after the
earthquake event.
8. Based on the density measurement of samples from entire area it was observed that the zeolitic
formations contain 53 % of massive basalt and 47% of vesicular amygdolydal basalt.
9. It is observed that in the study area the ground water quality is suitable for drinking and
irrigation purposes (Table No 10 &11).
10. 14
C dating of the sampled bore well waters showed most of them are of Modern age (≤ 60 yr
BP). Therefore the residence time of these groundwaters is short.
11. Stable isotope signatures depicted quite evaporation of rain water before entering the aquifer.
12. The deepest well among the sampled wells show different isotopic signatures, which may
indicate paleo-recharge (its 14
C date is not obtained to substantiate the stable isotope
signatures).
13. .Chemical parameters/species of groundwaters indicate recent recharge component and facies
evaluation during transit through fracture/intra Basaltic flow media.
RECCOMENDATIONS/REMEDIAL MEASURES
1. In the area where groundwater levels shows declining trend are proposed to be recouped by
undertaking artificial recharging measures like percolation trenches, cement bandharas.
44. 44
2. Chemical quality of ground water sources from study area can be improved by restricting the
pollution (due to use of Chemical Fertilizer and Sevage) and by artificial recharge method like
rain water harvesting etc.
FUTURE PLAN
1. Recharge measures and water management techniques to restore the water table in the
study area as well as the recharging of deeper aquifers in the study area.
2. Capacity building and awareness of the local people and non officials in the earthquake
affected area and develop their mind set the restoration of groundwater table and
planned used of shallow and deeper aquifer and to manage with water scarcity
conditions.
ANNEXURE - 1
45. 45
I
Photo No.-1 House Near Epicentre of Earthquake.
ANNEXURE - 2
Photo No 2 Surface Rupture developed Near Epicentre of Earthquake.
ANNEXURE - 3