
Recommandé
Contenu connexe
Similaire à Msexcel 11 Npv Irr Feasibility
Similaire à Msexcel 11 Npv Irr Feasibility (20)
Plus de Joe
Dernier
Dernier (20)
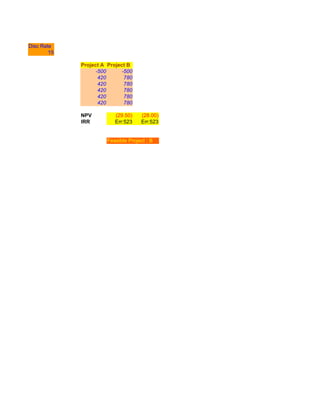
Msexcel 11 Npv Irr Feasibility
- 1. Disc Rate 15 Project A Project B -500 -500 420 780 420 780 420 780 420 780 420 780 NPV (29.50) (28.00) IRR Err:523 Err:523 Feasible Project : B
- 2. Project A Project B -1000 -1000 420 420 410 430 300 520 250 620 0 630 -100 650 IRR Err:523 Err:523 NPV 15% (60.75) (60.75) NPV14% (64.67) (64.66) NPV 13% (69.13) (69.11) NPV12% (74.24) (74.22) NPV 11% (80.16) (80.14) NPV 10% (87.11) (87.08) Feasible Project: B Feasible Projects 700 600 Discount Rate: 500 15 14 400 13 300 Output 12 Column B 200 11 Column C 10 100 0 -100 -200 Row 7 Row 8 Row 9 Row 10 Row 11 Row 12 Years