SlideShare une entreprise Scribd logo
1  sur  4
F-TEST (FRIEDMAN’S TEST)
 Friedman's Test is a nonparametric hypothesis test, meaning that it is used to
study populations with rankings but no clear numerical interpretation.
 It is used when no distributional assumptions are necessary.
 This is used for three or more groups of data and the variables measured are
ordinally scaled.
 It is used to test the null hypothesis that the samples have been drawn from the
same population.
To use the F-test or Friedman’s test:
 State the null hypothesis (samples come from populations with equal
distributions) and the alternative hypothesis (samples come from populations
with different distributions).
 State the level of significance. This is the error probability.
 Set up a table based on the data. The rows represent the number of samples
(the blocks), while the columns represent the sample treatments.
 In the table, rank the data within the blocks, giving the lowest value rank 1 and
tied values the average of the two ranks.
 Get the sum of the ranks per treatment.
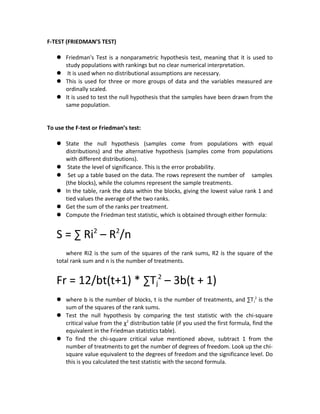
 Compute the Friedman test statistic, which is obtained through either formula:
S = ∑ Ri2
– R2
/n
where Ri2 is the sum of the squares of the rank sums, R2 is the square of the
total rank sum and n is the number of treatments.
Fr = 12/bt(t+1) * ∑Tj
2
– 3b(t + 1)
 where b is the number of blocks, t is the number of treatments, and ∑Tj
2
is the
sum of the squares of the rank sums.
 Test the null hypothesis by comparing the test statistic with the chi-square
critical value from the χ2
distribution table (if you used the first formula, find the
equivalent in the Friedman statistics table).
 To find the chi-square critical value mentioned above, subtract 1 from the
number of treatments to get the number of degrees of freedom. Look up the chi-
square value equivalent to the degrees of freedom and the significance level. Do
this is you calculated the test statistic with the second formula.
 If Fr is greater than or equal to the critical chi-square value/Friedman statistics
table value found, the null hypothesis is dropped.
EXAMPLE:
A nutritionist compared three treatments of squash-malunggay-banana baby food
preparations with the ingredients in different proportions. The three treatments
were subjected to a sensory evaluation using four evaluators. The treatments were
rated 1 to 4, 4 being the highest and best rating. Assume significance is 5%.
 State the hypotheses: Ho = samples are from same-distribution populations, Ha
= samples come from different-distribution populations.
 Create a table first, then list down all the data. Then rank the data across blocks
(in black) and find the sum (in red).
BlockTreatment Treatment
1
Treatment
2
Treatment
3
Block 1 3 (1.5) 4 (3) 3 (1.5)
Block 2 4 (3) 2 (1.5) 2 (1.5)
Block 3 3 (1.5) 4 (3) 3 (1.5)
Block 4 4 (3) 3 (2) 2 (1)
∑Rank 9 9.5 5.5
 Compute for the Friedman test statistic.
Fr = 12/bt(t+1) * ∑Tj
2
– 3b(t + 1)
Fr = 12/(4)(3)(3+1) * ∑Tj
2
– 12(3 + 1)
Fr = 12/(4)(3)(3+1) * ∑Tj
2
– 12(3 + 1)
Fr = 12/(4)(3)(3+1) * (92
+ 9.52
+ 5.52
) – 12(3 + 1)
Fr = 2.375
 Next, find the degrees of freedom.
DOF = treatments – 1 = 3 – 1 = 2
 Look for the chi-square value with DOF 2 and significance level 0.05 (5%). This is
5.991.
 Compare the Fr and the chi-square value.
Since Fr < 5.991, the null hypothesis is then true.
OR
 After constructing the table, use the formula S = ∑ Ri2
– R2
/n.
S = ∑ Ri2
– R2
/n
S = (92
+ 9.52
+ 5.52
) – (24) 2
/3
S = 9.5
 Here, use n instead of degrees of freedom. , and significance is 0.05.
 Look up the value of S5,3 and compare its value to S.
 Since the calculated S-value is less than S5,3 (S5,3 = 37), then the null hypothesis is
correct.
HOW TO PERFORM A FRIEDMAN TEST IN EXCEL
Note: You will need to install the Analyse-it toolbar for Microsoft Excel 2003/2007. The
instructions shown here are for Microsoft Excel 2003. For help on using the toolbar on
Excel 2007, refer to the documentation at: http://www.analyse-
it.com/support/documentation/220/Welcome.htm
Note: The Analyse-it toolbar has a limited trial of 30 days.
Given this data set:
 To perform the Friedman test, select the Analyse-it toolbar and drag the cursor
to “Compare Pairs”. Then select “Friedman”. (NOTE: There must be a variable
name across the blocks.)
 Select everything when the window pops out by clicking on the green figures.
 It will display a set of results for Friedman test.

Contenu connexe

Tendances

Infinite series-Calculus and Analytical Geometry
Infinite series-Calculus and Analytical GeometryInfinite series-Calculus and Analytical Geometry
Infinite series-Calculus and Analytical GeometryRabin BK
 
Suma de riemann
Suma de riemannSuma de riemann
Suma de riemannDiegomge
 
The Normal Distribution and Other Continuous Distributions
The Normal Distribution and Other Continuous DistributionsThe Normal Distribution and Other Continuous Distributions
The Normal Distribution and Other Continuous DistributionsYesica Adicondro
 
The Jacobi and Gauss-Seidel Iterative Methods.pdf
The Jacobi and Gauss-Seidel Iterative Methods.pdfThe Jacobi and Gauss-Seidel Iterative Methods.pdf
The Jacobi and Gauss-Seidel Iterative Methods.pdfTigabu Yaya
 
Trazadores cúbico spline
Trazadores  cúbico splineTrazadores  cúbico spline
Trazadores cúbico splinemat7731
 
Order of Operations (Algebra1 1_2)
Order of Operations (Algebra1 1_2)Order of Operations (Algebra1 1_2)
Order of Operations (Algebra1 1_2)rfant
 
Chapter 4: Linear Algebraic Equations
Chapter 4: Linear Algebraic EquationsChapter 4: Linear Algebraic Equations
Chapter 4: Linear Algebraic EquationsMaria Fernanda
 
Error Finding in Numerical method
Error Finding in Numerical methodError Finding in Numerical method
Error Finding in Numerical methodFazle Rabbi Ador
 
( Percents greater than 100% and less than 1%
( Percents greater than 100% and less than 1%( Percents greater than 100% and less than 1%
( Percents greater than 100% and less than 1%Amna Abunamous
 
Application of differentiation
Application of differentiationApplication of differentiation
Application of differentiationLily Maryati
 
Solution of matlab chapter 1
Solution of matlab chapter 1Solution of matlab chapter 1
Solution of matlab chapter 1AhsanIrshad8
 
Application of differentiation
Application   of   differentiationApplication   of   differentiation
Application of differentiationDhanush Kumar
 
Lesson 19: The Mean Value Theorem
Lesson 19: The Mean Value TheoremLesson 19: The Mean Value Theorem
Lesson 19: The Mean Value TheoremMatthew Leingang
 
Lu decomposition
Lu decompositionLu decomposition
Lu decompositiongilandio
 
Applied Calculus Chapter 3 partial derivatives
Applied Calculus Chapter  3 partial derivativesApplied Calculus Chapter  3 partial derivatives
Applied Calculus Chapter 3 partial derivativesJ C
 

Tendances (20)

Gauss sediel
Gauss sedielGauss sediel
Gauss sediel
 
Infinite series-Calculus and Analytical Geometry
Infinite series-Calculus and Analytical GeometryInfinite series-Calculus and Analytical Geometry
Infinite series-Calculus and Analytical Geometry
 
Suma de riemann
Suma de riemannSuma de riemann
Suma de riemann
 
Curve fitting
Curve fitting Curve fitting
Curve fitting
 
The Normal Distribution and Other Continuous Distributions
The Normal Distribution and Other Continuous DistributionsThe Normal Distribution and Other Continuous Distributions
The Normal Distribution and Other Continuous Distributions
 
Cramer's Rule
Cramer's RuleCramer's Rule
Cramer's Rule
 
R - Multiple Regression
R - Multiple RegressionR - Multiple Regression
R - Multiple Regression
 
The Jacobi and Gauss-Seidel Iterative Methods.pdf
The Jacobi and Gauss-Seidel Iterative Methods.pdfThe Jacobi and Gauss-Seidel Iterative Methods.pdf
The Jacobi and Gauss-Seidel Iterative Methods.pdf
 
Trazadores cúbico spline
Trazadores  cúbico splineTrazadores  cúbico spline
Trazadores cúbico spline
 
Order of Operations (Algebra1 1_2)
Order of Operations (Algebra1 1_2)Order of Operations (Algebra1 1_2)
Order of Operations (Algebra1 1_2)
 
Chapter 4: Linear Algebraic Equations
Chapter 4: Linear Algebraic EquationsChapter 4: Linear Algebraic Equations
Chapter 4: Linear Algebraic Equations
 
7 goal seek and solver
7 goal seek  and solver7 goal seek  and solver
7 goal seek and solver
 
Error Finding in Numerical method
Error Finding in Numerical methodError Finding in Numerical method
Error Finding in Numerical method
 
( Percents greater than 100% and less than 1%
( Percents greater than 100% and less than 1%( Percents greater than 100% and less than 1%
( Percents greater than 100% and less than 1%
 
Application of differentiation
Application of differentiationApplication of differentiation
Application of differentiation
 
Solution of matlab chapter 1
Solution of matlab chapter 1Solution of matlab chapter 1
Solution of matlab chapter 1
 
Application of differentiation
Application   of   differentiationApplication   of   differentiation
Application of differentiation
 
Lesson 19: The Mean Value Theorem
Lesson 19: The Mean Value TheoremLesson 19: The Mean Value Theorem
Lesson 19: The Mean Value Theorem
 
Lu decomposition
Lu decompositionLu decomposition
Lu decomposition
 
Applied Calculus Chapter 3 partial derivatives
Applied Calculus Chapter  3 partial derivativesApplied Calculus Chapter  3 partial derivatives
Applied Calculus Chapter 3 partial derivatives
 

En vedette

F Distribution
F  DistributionF  Distribution
F Distributionjravish
 
Anova (f test) and mean differentiation
Anova (f test) and mean differentiationAnova (f test) and mean differentiation
Anova (f test) and mean differentiationSubramani Parasuraman
 
Z-Test and Standard error
Z-Test and Standard errorZ-Test and Standard error
Z-Test and Standard errordharazalavadiya
 
F test Analysis of Variance (ANOVA)
F test Analysis of Variance (ANOVA)F test Analysis of Variance (ANOVA)
F test Analysis of Variance (ANOVA)Marianne Maluyo
 
Analysis of variance (ANOVA)
Analysis of variance (ANOVA)Analysis of variance (ANOVA)
Analysis of variance (ANOVA)Sneh Kumari
 
Student's T-test, Paired T-Test, ANOVA & Proportionate Test
Student's T-test, Paired T-Test, ANOVA & Proportionate TestStudent's T-test, Paired T-Test, ANOVA & Proportionate Test
Student's T-test, Paired T-Test, ANOVA & Proportionate TestAzmi Mohd Tamil
 
Hypothesis testing; z test, t-test. f-test
Hypothesis testing; z test, t-test. f-testHypothesis testing; z test, t-test. f-test
Hypothesis testing; z test, t-test. f-testShakehand with Life
 
Reporting Chi Square Test of Independence in APA
Reporting Chi Square Test of Independence in APAReporting Chi Square Test of Independence in APA
Reporting Chi Square Test of Independence in APAKen Plummer
 

En vedette (13)

F Distribution
F  DistributionF  Distribution
F Distribution
 
Anova (f test) and mean differentiation
Anova (f test) and mean differentiationAnova (f test) and mean differentiation
Anova (f test) and mean differentiation
 
Z-Test and Standard error
Z-Test and Standard errorZ-Test and Standard error
Z-Test and Standard error
 
F test Analysis of Variance (ANOVA)
F test Analysis of Variance (ANOVA)F test Analysis of Variance (ANOVA)
F test Analysis of Variance (ANOVA)
 
Anova ppt
Anova pptAnova ppt
Anova ppt
 
Data Analysis Using Spss T Test
Data Analysis Using Spss   T TestData Analysis Using Spss   T Test
Data Analysis Using Spss T Test
 
Analysis of Variance (ANOVA)
Analysis of Variance (ANOVA)Analysis of Variance (ANOVA)
Analysis of Variance (ANOVA)
 
Analysis of variance (ANOVA)
Analysis of variance (ANOVA)Analysis of variance (ANOVA)
Analysis of variance (ANOVA)
 
Student's T-test, Paired T-Test, ANOVA & Proportionate Test
Student's T-test, Paired T-Test, ANOVA & Proportionate TestStudent's T-test, Paired T-Test, ANOVA & Proportionate Test
Student's T-test, Paired T-Test, ANOVA & Proportionate Test
 
Student t-test
Student t-testStudent t-test
Student t-test
 
Chi square test
Chi square testChi square test
Chi square test
 
Hypothesis testing; z test, t-test. f-test
Hypothesis testing; z test, t-test. f-testHypothesis testing; z test, t-test. f-test
Hypothesis testing; z test, t-test. f-test
 
Reporting Chi Square Test of Independence in APA
Reporting Chi Square Test of Independence in APAReporting Chi Square Test of Independence in APA
Reporting Chi Square Test of Independence in APA
 

Similaire à Str f-test

ANOVA-One Way Classification
ANOVA-One Way ClassificationANOVA-One Way Classification
ANOVA-One Way ClassificationSharlaine Ruth
 
test_using_one-way_analysis_of_varianceANOVA_063847.pptx
test_using_one-way_analysis_of_varianceANOVA_063847.pptxtest_using_one-way_analysis_of_varianceANOVA_063847.pptx
test_using_one-way_analysis_of_varianceANOVA_063847.pptxRaquelMaacap
 
Anova by Hazilah Mohd Amin
Anova by Hazilah Mohd AminAnova by Hazilah Mohd Amin
Anova by Hazilah Mohd AminHazilahMohd
 
Analysis of variance(menong)
Analysis of variance(menong)Analysis of variance(menong)
Analysis of variance(menong)Maria Theresa
 
In the t test for independent groups, ____.we estimate µ1 µ2.docx
In the t test for independent groups, ____.we estimate µ1 µ2.docxIn the t test for independent groups, ____.we estimate µ1 µ2.docx
In the t test for independent groups, ____.we estimate µ1 µ2.docxbradburgess22840
 
EPS 525 – Introduction to StatisticsAssignment No. 5 – One-w.docx
EPS 525 – Introduction to StatisticsAssignment No. 5 – One-w.docxEPS 525 – Introduction to StatisticsAssignment No. 5 – One-w.docx
EPS 525 – Introduction to StatisticsAssignment No. 5 – One-w.docxYASHU40
 
Ch7 Analysis of Variance (ANOVA)
Ch7 Analysis of Variance (ANOVA)Ch7 Analysis of Variance (ANOVA)
Ch7 Analysis of Variance (ANOVA)Farhan Alfin
 
In a left-tailed test comparing two means with variances unknown b.docx
In a left-tailed test comparing two means with variances unknown b.docxIn a left-tailed test comparing two means with variances unknown b.docx
In a left-tailed test comparing two means with variances unknown b.docxbradburgess22840
 
13. single factor ANOVA crop.pptx
13. single factor ANOVA crop.pptx13. single factor ANOVA crop.pptx
13. single factor ANOVA crop.pptxdawitg2
 
non parametric tests.pptx
non parametric tests.pptxnon parametric tests.pptx
non parametric tests.pptxSreeLatha98
 
10.Analysis of Variance.ppt
10.Analysis of Variance.ppt10.Analysis of Variance.ppt
10.Analysis of Variance.pptAbdulhaqAli
 
Friedman's 2way ANOVA.pptx
Friedman's 2way ANOVA.pptxFriedman's 2way ANOVA.pptx
Friedman's 2way ANOVA.pptxDM Silongan
 
Week 5 Lecture 14 The Chi Square Test Quite often, pat.docx
Week 5 Lecture 14 The Chi Square Test Quite often, pat.docxWeek 5 Lecture 14 The Chi Square Test Quite often, pat.docx
Week 5 Lecture 14 The Chi Square Test Quite often, pat.docxcockekeshia
 
Parametric & non parametric
Parametric & non parametricParametric & non parametric
Parametric & non parametricANCYBS
 

Similaire à Str f-test (20)

ANOVA-One Way Classification
ANOVA-One Way ClassificationANOVA-One Way Classification
ANOVA-One Way Classification
 
Chi-square test.pptx
Chi-square test.pptxChi-square test.pptx
Chi-square test.pptx
 
test_using_one-way_analysis_of_varianceANOVA_063847.pptx
test_using_one-way_analysis_of_varianceANOVA_063847.pptxtest_using_one-way_analysis_of_varianceANOVA_063847.pptx
test_using_one-way_analysis_of_varianceANOVA_063847.pptx
 
Anova by Hazilah Mohd Amin
Anova by Hazilah Mohd AminAnova by Hazilah Mohd Amin
Anova by Hazilah Mohd Amin
 
Analysis of variance(menong)
Analysis of variance(menong)Analysis of variance(menong)
Analysis of variance(menong)
 
In the t test for independent groups, ____.we estimate µ1 µ2.docx
In the t test for independent groups, ____.we estimate µ1 µ2.docxIn the t test for independent groups, ____.we estimate µ1 µ2.docx
In the t test for independent groups, ____.we estimate µ1 µ2.docx
 
EPS 525 – Introduction to StatisticsAssignment No. 5 – One-w.docx
EPS 525 – Introduction to StatisticsAssignment No. 5 – One-w.docxEPS 525 – Introduction to StatisticsAssignment No. 5 – One-w.docx
EPS 525 – Introduction to StatisticsAssignment No. 5 – One-w.docx
 
Ch7 Analysis of Variance (ANOVA)
Ch7 Analysis of Variance (ANOVA)Ch7 Analysis of Variance (ANOVA)
Ch7 Analysis of Variance (ANOVA)
 
In a left-tailed test comparing two means with variances unknown b.docx
In a left-tailed test comparing two means with variances unknown b.docxIn a left-tailed test comparing two means with variances unknown b.docx
In a left-tailed test comparing two means with variances unknown b.docx
 
13. single factor ANOVA crop.pptx
13. single factor ANOVA crop.pptx13. single factor ANOVA crop.pptx
13. single factor ANOVA crop.pptx
 
non parametric tests.pptx
non parametric tests.pptxnon parametric tests.pptx
non parametric tests.pptx
 
Chapter12
Chapter12Chapter12
Chapter12
 
Stat sample test ch 12
Stat sample test ch 12Stat sample test ch 12
Stat sample test ch 12
 
10.Analysis of Variance.ppt
10.Analysis of Variance.ppt10.Analysis of Variance.ppt
10.Analysis of Variance.ppt
 
Friedman's 2way ANOVA.pptx
Friedman's 2way ANOVA.pptxFriedman's 2way ANOVA.pptx
Friedman's 2way ANOVA.pptx
 
Analysis of variance anova
Analysis of variance anovaAnalysis of variance anova
Analysis of variance anova
 
Week 5 Lecture 14 The Chi Square Test Quite often, pat.docx
Week 5 Lecture 14 The Chi Square Test Quite often, pat.docxWeek 5 Lecture 14 The Chi Square Test Quite often, pat.docx
Week 5 Lecture 14 The Chi Square Test Quite often, pat.docx
 
Parametric & non parametric
Parametric & non parametricParametric & non parametric
Parametric & non parametric
 
Two Variances or Standard Deviations
Two Variances or Standard DeviationsTwo Variances or Standard Deviations
Two Variances or Standard Deviations
 
Chapter 6 Ranksumtest
Chapter 6 RanksumtestChapter 6 Ranksumtest
Chapter 6 Ranksumtest
 

Plus de iamkim

Nat sci minerals part1
Nat sci   minerals part1Nat sci   minerals part1
Nat sci minerals part1iamkim
 
Nat Sci - Minerals
Nat Sci - MineralsNat Sci - Minerals
Nat Sci - Mineralsiamkim
 
Batch 2012 schedule of exit interview
Batch 2012 schedule of exit interviewBatch 2012 schedule of exit interview
Batch 2012 schedule of exit interviewiamkim
 
College test results b2012
College test results b2012College test results b2012
College test results b2012iamkim
 
Chem cations
Chem   cationsChem   cations
Chem cationsiamkim
 
Chem anions
Chem   anionsChem   anions
Chem anionsiamkim
 
Grad ball collections per section(01 28-12)
Grad ball collections per section(01 28-12)Grad ball collections per section(01 28-12)
Grad ball collections per section(01 28-12)iamkim
 
Congratulations to batch 2012 star scholar candidates
Congratulations to batch 2012 star scholar candidatesCongratulations to batch 2012 star scholar candidates
Congratulations to batch 2012 star scholar candidatesiamkim
 
Retreat consent form
Retreat consent formRetreat consent form
Retreat consent formiamkim
 
Retreat agreements
Retreat agreementsRetreat agreements
Retreat agreementsiamkim
 
Fil la loba negra
Fil   la loba negraFil   la loba negra
Fil la loba negraiamkim
 
Fil fray botod
Fil   fray botodFil   fray botod
Fil fray botodiamkim
 
Fil 3 q readings
Fil   3 q readingsFil   3 q readings
Fil 3 q readingsiamkim
 
Dasalan at tocsohan
Dasalan at tocsohanDasalan at tocsohan
Dasalan at tocsohaniamkim
 
Chem ps electrolysis
Chem   ps electrolysisChem   ps electrolysis
Chem ps electrolysisiamkim
 
Physics waves
Physics   wavesPhysics   waves
Physics wavesiamkim
 
Math 3 hw ps2
Math   3 hw ps2Math   3 hw ps2
Math 3 hw ps2iamkim
 
Memo circular # 4 dtd nov 4, 2011
Memo circular # 4 dtd nov 4, 2011Memo circular # 4 dtd nov 4, 2011
Memo circular # 4 dtd nov 4, 2011iamkim
 
Final creative shots hair & makeup evaluation (110211)
Final creative shots hair & makeup evaluation (110211)Final creative shots hair & makeup evaluation (110211)
Final creative shots hair & makeup evaluation (110211)iamkim
 
Creative shots hair & makeup evaluation (110211)
Creative shots hair & makeup evaluation (110211)Creative shots hair & makeup evaluation (110211)
Creative shots hair & makeup evaluation (110211)iamkim
 

Plus de iamkim (20)

Nat sci minerals part1
Nat sci   minerals part1Nat sci   minerals part1
Nat sci minerals part1
 
Nat Sci - Minerals
Nat Sci - MineralsNat Sci - Minerals
Nat Sci - Minerals
 
Batch 2012 schedule of exit interview
Batch 2012 schedule of exit interviewBatch 2012 schedule of exit interview
Batch 2012 schedule of exit interview
 
College test results b2012
College test results b2012College test results b2012
College test results b2012
 
Chem cations
Chem   cationsChem   cations
Chem cations
 
Chem anions
Chem   anionsChem   anions
Chem anions
 
Grad ball collections per section(01 28-12)
Grad ball collections per section(01 28-12)Grad ball collections per section(01 28-12)
Grad ball collections per section(01 28-12)
 
Congratulations to batch 2012 star scholar candidates
Congratulations to batch 2012 star scholar candidatesCongratulations to batch 2012 star scholar candidates
Congratulations to batch 2012 star scholar candidates
 
Retreat consent form
Retreat consent formRetreat consent form
Retreat consent form
 
Retreat agreements
Retreat agreementsRetreat agreements
Retreat agreements
 
Fil la loba negra
Fil   la loba negraFil   la loba negra
Fil la loba negra
 
Fil fray botod
Fil   fray botodFil   fray botod
Fil fray botod
 
Fil 3 q readings
Fil   3 q readingsFil   3 q readings
Fil 3 q readings
 
Dasalan at tocsohan
Dasalan at tocsohanDasalan at tocsohan
Dasalan at tocsohan
 
Chem ps electrolysis
Chem   ps electrolysisChem   ps electrolysis
Chem ps electrolysis
 
Physics waves
Physics   wavesPhysics   waves
Physics waves
 
Math 3 hw ps2
Math   3 hw ps2Math   3 hw ps2
Math 3 hw ps2
 
Memo circular # 4 dtd nov 4, 2011
Memo circular # 4 dtd nov 4, 2011Memo circular # 4 dtd nov 4, 2011
Memo circular # 4 dtd nov 4, 2011
 
Final creative shots hair & makeup evaluation (110211)
Final creative shots hair & makeup evaluation (110211)Final creative shots hair & makeup evaluation (110211)
Final creative shots hair & makeup evaluation (110211)
 
Creative shots hair & makeup evaluation (110211)
Creative shots hair & makeup evaluation (110211)Creative shots hair & makeup evaluation (110211)
Creative shots hair & makeup evaluation (110211)
 

Str f-test

  • 1. F-TEST (FRIEDMAN’S TEST)  Friedman's Test is a nonparametric hypothesis test, meaning that it is used to study populations with rankings but no clear numerical interpretation.  It is used when no distributional assumptions are necessary.  This is used for three or more groups of data and the variables measured are ordinally scaled.  It is used to test the null hypothesis that the samples have been drawn from the same population. To use the F-test or Friedman’s test:  State the null hypothesis (samples come from populations with equal distributions) and the alternative hypothesis (samples come from populations with different distributions).  State the level of significance. This is the error probability.  Set up a table based on the data. The rows represent the number of samples (the blocks), while the columns represent the sample treatments.  In the table, rank the data within the blocks, giving the lowest value rank 1 and tied values the average of the two ranks.  Get the sum of the ranks per treatment.  Compute the Friedman test statistic, which is obtained through either formula: S = ∑ Ri2 – R2 /n where Ri2 is the sum of the squares of the rank sums, R2 is the square of the total rank sum and n is the number of treatments. Fr = 12/bt(t+1) * ∑Tj 2 – 3b(t + 1)  where b is the number of blocks, t is the number of treatments, and ∑Tj 2 is the sum of the squares of the rank sums.  Test the null hypothesis by comparing the test statistic with the chi-square critical value from the χ2 distribution table (if you used the first formula, find the equivalent in the Friedman statistics table).  To find the chi-square critical value mentioned above, subtract 1 from the number of treatments to get the number of degrees of freedom. Look up the chi- square value equivalent to the degrees of freedom and the significance level. Do this is you calculated the test statistic with the second formula.
  • 2.  If Fr is greater than or equal to the critical chi-square value/Friedman statistics table value found, the null hypothesis is dropped. EXAMPLE: A nutritionist compared three treatments of squash-malunggay-banana baby food preparations with the ingredients in different proportions. The three treatments were subjected to a sensory evaluation using four evaluators. The treatments were rated 1 to 4, 4 being the highest and best rating. Assume significance is 5%.  State the hypotheses: Ho = samples are from same-distribution populations, Ha = samples come from different-distribution populations.  Create a table first, then list down all the data. Then rank the data across blocks (in black) and find the sum (in red). BlockTreatment Treatment 1 Treatment 2 Treatment 3 Block 1 3 (1.5) 4 (3) 3 (1.5) Block 2 4 (3) 2 (1.5) 2 (1.5) Block 3 3 (1.5) 4 (3) 3 (1.5) Block 4 4 (3) 3 (2) 2 (1) ∑Rank 9 9.5 5.5  Compute for the Friedman test statistic. Fr = 12/bt(t+1) * ∑Tj 2 – 3b(t + 1) Fr = 12/(4)(3)(3+1) * ∑Tj 2 – 12(3 + 1) Fr = 12/(4)(3)(3+1) * ∑Tj 2 – 12(3 + 1) Fr = 12/(4)(3)(3+1) * (92 + 9.52 + 5.52 ) – 12(3 + 1) Fr = 2.375  Next, find the degrees of freedom. DOF = treatments – 1 = 3 – 1 = 2  Look for the chi-square value with DOF 2 and significance level 0.05 (5%). This is 5.991.  Compare the Fr and the chi-square value. Since Fr < 5.991, the null hypothesis is then true. OR  After constructing the table, use the formula S = ∑ Ri2 – R2 /n.
  • 3. S = ∑ Ri2 – R2 /n S = (92 + 9.52 + 5.52 ) – (24) 2 /3 S = 9.5  Here, use n instead of degrees of freedom. , and significance is 0.05.  Look up the value of S5,3 and compare its value to S.  Since the calculated S-value is less than S5,3 (S5,3 = 37), then the null hypothesis is correct. HOW TO PERFORM A FRIEDMAN TEST IN EXCEL Note: You will need to install the Analyse-it toolbar for Microsoft Excel 2003/2007. The instructions shown here are for Microsoft Excel 2003. For help on using the toolbar on Excel 2007, refer to the documentation at: http://www.analyse- it.com/support/documentation/220/Welcome.htm Note: The Analyse-it toolbar has a limited trial of 30 days. Given this data set:  To perform the Friedman test, select the Analyse-it toolbar and drag the cursor to “Compare Pairs”. Then select “Friedman”. (NOTE: There must be a variable name across the blocks.)  Select everything when the window pops out by clicking on the green figures.
  • 4.  It will display a set of results for Friedman test.