What's New in Teams Calling, Meetings and Devices March 2024
Al33217222
1. Mohammed Ginaya, Adil Elkrail, Abdalla Farwa / International Journal of Engineering
Research and Applications (IJERA) ISSN: 2248-9622 www.ijera.com
Vol. 3, Issue 3, May-Jun 2013, pp.217-222
217 | P a g e
Numerical Modeling of the Groundwater Flow in Ennahud Basin,
Northern Kordofan state - Sudan.
Mohammed Ginaya1, Adil Elkrail 2 and Abdalla Farwa3
1Al Salam university-El Muglad – South Kordofan state –Sudan
2Department of hydrogeology, Faculty of Petroleum &Minerals, Al Neelain University, Khartoum – Sudan
3Khartoum University, Faculty of Science, Dept. of Geology
Abstract
The groundwater model techniques were
used to improve the understanding and evaluate
the complex hydrogeological situation of the
study area. Visual MODFLOW code was selected
to run the model scenarios. The aquifer hydraulic
conductivity, storativity, recharge, and constant
head boundary (CHB) were adjusted during
calibration to obtain acceptable match between
calculated and observed heads and fluxes. The
calibration of three-dimensional finite difference
flow model of Ennuhud sedimentary aquifer was
realized through the calibration which is
acceptable within the average Root Mean Square
error (RMS) of 1.482m, Residual Mean of
0.526m, and standard error of estimate to be 0.22
where the contour maps of the simulated heads
produced by visual MODFLOW show fair
similarity with those drawn using initial heads
which confirm acceptable model calibration. The
calculated zone budget reflects that volume of
aquifer storage for the three years varies from
3.57 to 8.3 million cubic meters (mcm). The
annual average pumpage was estimated through
the model run to be 6.73 mcm, whereas, the
annual historical pumpage was 6.2 mcm. The
annual recharge was estimated to be; 143.8, 579.9
and 867.5 mcm during the three successive years
(2005-2007) respectively, whereas the annual
average recharge was 530.4 mcm. The model
assigns the regional groundwater flow direction
towards the center where some water flow
diverges to localized cones of depression ascribed
to heavy pumping. The contour maps of the
simulated heads show fair similarity with those
generated from initial heads which confirm
acceptable model calibration. The predictive
simulation for 10 years starting from 2005 shows
that the continued pumping will create relatively
high changes in head distribution in the model
area, and gives a maximum drawdown of 5m at
2015.
Key words: simulation, Trial- and- Error,
zonebudget, aquifer, calibration
I. Introduction
Groundwater exploration and management
comprises application of different techniques;
geological, hydro-geological, geophysical and
hydrochemical well as modeling techniques.
Temporal and spatial changes of the hydrological
cycle as results of climatic changes have a
significant associated impact on water resources
(Stoll et al. 2011). In semi-arid and arid
environments, recharge is often heterogeneous
(Wood and Sanford 1995; Harrington et al.2002;
Scanlon et al. 2006). The greater the aridity of the
climate, the smaller and potentially more variable in
space and time is the recharge flux (Sibanda et al.
2009). Jyrkama and Sykes (2007) investigated the
future spatial variation of the groundwater recharge.
The results show increasing groundwater recharge in
the future due to reduced extent of ground frost in
tropical climate and increasing intensity of rainfall
in arid and semiarid climate. Different modeling
approaches have been used for the assessment of
groundwater resources. Building of theoretical
model for the optimal extraction of groundwater by
spatially distributed users reflected that some
aquifers may be more akin to private property rather
than open access and may be subject to significant
lagged effects from pumping (Brozovic et al. 2006,
2010). The groundwater modeling is a relatively
modern technique for the assessment and evaluation
of groundwater resources,(Elkrail, 2004,). The
groundwater problems related to water supply are
normally described by partial differential equation,
in terms of hydraulic head. The resulting model
providing a solution for this equation is related to
groundwater flow model. Groundwater flow models
have been extensively used for such problems of
regional aquifer studies, groundwater basin analysis
and near-well performance. Numerical models allow
analysis of flow if the complexity of the
mathematical model prevents an analytical analysis
(Anderson and Woessner 1992). In groundwater
flow modeling, the simplest numerical model
considers the groundwater system as a single control
volume. Changes in groundwater heads are
expressed as averages over the groundwater system
and are calculated by a global mass
balance,(Keidser et al,1990). The groundwater flow
modeling technique is introduced in this study to
assess and evaluate aquifer system of Ennahud basin
and predict the effect of increasing the extraction
from aquifer for future development. Special
attention is directed to delineate the geometry of
Ennahud basin.
2. Mohammed Ginaya, Adil Elkrail, Abdalla Farwa / International Journal of Engineering
Research and Applications (IJERA) ISSN: 2248-9622 www.ijera.com
Vol. 3, Issue 3, May-Jun 2013, pp.217-222
218 | P a g e
II. The study area:
The area lies between latitudes 12º 20´ - 13º 20N and longitudes 28º 00 - 30º 00E, covers an area of
approximately 24311 km¬¬2(Fig.1).
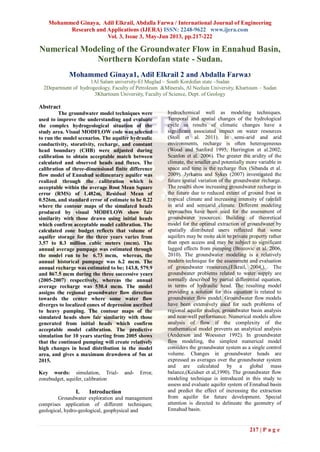
Fig.(1) Location and Geological map of the study area
On geological viewpoint the area is composed of Quaternary deposits, Mesozoic-Cretaceous sedimentary
formations and Precambrian – Cambrian Basement in descending order (Fig. 2).
Fig.2 Schematic geological cross-section through the Model Domain
The basement rocks comprise ortho- and Para-
gneisses, hornblende gneisses and amphibolites
which were recorded at J. Mondra and at the
boundary of the area. Graphitic schist, granite and
synite are found at Rahad Essopagh area.
Cretaceous Sedimentary rocks comprise the
principal water- bearing formation in the area. They
consist of sandstone and conglomerates. The
thickness of these layers in the study area varies
from 10 m to over 400m (Ginaya, 2001).
Groundwater is the main water sources for domestic
use for Ennahud and Abu Zabad towns. The
elevations of the top of the Basement rocks, detected
from borehole drilling, were used to define the
bottom of the aquifer (one aquifer system) based on
the lithological description and aquifer thickness.
The aquifer effective thickness varies from30m to
70m. The aquifer is characterized by good hydraulic
properties when it is not intercalated by siltstone or/
and mudstone. From stratigraphic and lithologic
point of view the Nubian aquifer in Ennahud basin
is considered as one aquifer system, with some
slight variations in lithological characteristics.
III. Material and Methods:
Visual MODFLOW code was used for
numerical model computation in the study area. A
LEGEND
Quaternary: Superficial deposits
Nubian Formation, mainly Psammitic - Psephitic sediments
Basement Complex, undifferenciated
Borehloe/ static water level in meter
Fualt line
700
400
0.0
-400
-800
-1200
-1600
-2000
0 5
10 Km
S
N
156
5574
124
700
400
0.0
-400
-800
-1200
-1600
-2000
sea level
Elevationinmeters
3. Mohammed Ginaya, Adil Elkrail, Abdalla Farwa / International Journal of Engineering
Research and Applications (IJERA) ISSN: 2248-9622 www.ijera.com
Vol. 3, Issue 3, May-Jun 2013, pp.217-222
219 | P a g e
conceptual model for Ennahud basin was
constructed, considering unconfined condition of the
Cretaceous sedimentary aquifer (Ginaya, 2001).The
grid network, used to cover the study area, has
constant spacing of 4195.4m by 1582.25m. The
model area is thus subdivided into 40 rows, 80
columns and 1 layer forming 3200 cells; covers an
area of 21236.7km2.The observed hydraulic heads
measured during June 2005 in the study area were
used as initial heads to calibrate the model. The
simulation time interval was divided into 22 stress
periods each discretized into ten time steps. One
hundred thirty boreholes were constructed in the
area for groundwater abstraction. Forty wells were
used as observation wells Fig. (2). Aquifer hydraulic
parameters were calculated through pumping test
using appropriate methods. The horizontal hydraulic
conductivity (K) of the sedimentary aquifer in
Ennahud basin was considered isotropic and ranged
between 0.66m /d and 25m/d, where vertical
hydraulic conductivities assigned as 10% of the
horizontal hydraulic conductivity in the model
domain. The bottom of the aquifer represents a
horizontal barrier boundary. The upper surface of
the aquifer represents a recharge boundary. For this
situation, Dirichlet boundary condition is the most
suitable boundary to be assigned for the model
simulation. The hydraulic properties, initial
conditions and boundary condition were assigned
and can be adjusted during calibration. Constant
head and No-flow boundary were assigned for
boundary conditions. The main calibration targets
are heads and mass balances. Groundwater budget
was prepared to estimate the amount of groundwater
inflow, outflow, and change in storage. The zone
budgets for first, second and third year respectively,
for the whole area were calculated (Table 1). The
calibration of the three – dimensional finite
difference flow model of the basin was performed
using the Root Mean Square error (RMS), Residual
Mean, standard error of estimate and mass balance
percent discrepancy. The parameters determined by
the model calibration were used for model
prediction. For the future response of the system on
the calibrated model, a time period of10years and
the calculated heads of year 2005 were used. The
prediction is done by changing the simulation period
from 1092 days to 3466 days, (year 2015) Fig.(18).
Keeping all other hydrogeologic and aquifer
parameters as prevailing during simulation period,
the change in the water levels through the time up to
year 2015 was obtained.
IV. Results and Discussions:
Groundwater model is an effective tool for
water evaluation. The groundwater discharge,
recharge, water budgets, fluctuations, aquifer
hydraulic properties and boundary condition can
precisely determine through model applications.
Accordingly, the historic total groundwater
discharge from pumping wells was calculated to be
6.2 million cubic meter per year(mcm/y) whereas
the average annual recharge to the sedimentary
aquifer was estimated to be 288 mcm. Therefore, the
recharge from precipitation is assumed to be
spatially uniform over the basin.
The model calbration criteria, using Root Mean
Square error (RMS), Residual Mean, and standard
error of estimate to be less than 1.482m, 0.526m
and 0.22 respectively (Fig. 3 A&B). Since the
precipitation, pumpage, and the lateral flow witnin
the study area varies from season to another, there is
a minor variation in the equipotential contours in
different stress periods within simulation time. In
the most central part of the basin, the wide spaced
equipotential lines indicate high permeability zone
(Fig.5). The hydraulic conductivity values obtained
from model calibration ranges from 1.5 to 25m/d
which confirm the values derived from pumping test
data. The specified boudary conditions prove as
appropriate chioce for model simulation. As a result,
the three – dimensional transient groundwater flow
model can sufficiently simulate the regional
groundwater flow of the Cretaceous sedimentary
aquifer of Ennahud basin. It is obvious that the
general groundwater flow converges towards the
center of the area, while some local groundwater
flows reflect cone of depressions at specified areas
of high abstraction (Fig. 4B).
Fig. 3. Observed versus calculated heads After 2006 days(A) and 3466 days (B)
4. Mohammed Ginaya, Adil Elkrail, Abdalla Farwa / International Journal of Engineering
Research and Applications (IJERA) ISSN: 2248-9622 www.ijera.com
Vol. 3, Issue 3, May-Jun 2013, pp.217-222
220 | P a g e
The calculated zone budget components include
pumpage, recharge, storage and constant head
boundary for the whole area. The volume change of
storage of the aquifer during simulation time varies
from 3.57 to 8.3 mcm. The groundwater pumpage
volume in the whole area calculated by the model
varies from 2.7 to 9.9 with average of 6.73 mcm,
through the simulation time (Table1). The annual
historical pumping is 6.2 mcm, which is almost
similar to the computed value. The annual recharge
during the three successive years (2005 to 2007) are;
143.8, 579.9 and 867.5 mcm, respectively(Table1),
with annual average value of 530.4 mcm.
Table 1. Cumulative groundwater budget for the study area
Time Component Inflow Mm3 % Outflow Mm3 %
Ist year (2005)
storage 3.57 1.7 206 98.7
Constant head 61.4 29.4 0.038 0.0
pumpage 0.0 0.0 2.7 1.3
Recharge 143.8 68.9 0.0 0.0
total 208.7 100 208.7 100
2nd year (2006)
storage 7.4 0.94 774.5 98.99
Constant head 195 24.9 1.5 0.19
pumpage 0.0 0.0 7.6 0.97
recharge 579.9 74.11 0.0 0.0
total 782.4 100 782.4 100
3rd year (2007)
storage 8.3 0.73 1121.29 99.08
Constant head 255.97 22.62 0.49 0.0
pumpage 0.0 0.0 9.9 0.87
recharge 867.5 76.65 0.0 0.0
total 1131.77 100 1131.77 100
Average
storage 6.4 0.90 700.6 98.95
Constant head 170.79 24.14 0.676 0.10
pumpage 0.0 0.00 6.73 0.95
recharge 530.4 74.96 0.0 0.00
total 707.59 100 708.0 100
Fig. 4. Distribution of initial head (A) and simulated head with flow direction (B).
5. Mohammed Ginaya, Adil Elkrail, Abdalla Farwa / International Journal of Engineering
Research and Applications (IJERA) ISSN: 2248-9622 www.ijera.com
Vol. 3, Issue 3, May-Jun 2013, pp.217-222
221 | P a g e
The predictive simulation for the years, 2010 and
2015 using the calculated heads of year 2005, shows
that the continued pumping will create relatively
high changes in head distribution in the model area,
and gives a maximum drawdown of 4m at year 2010
and 5m at 2015. The hydraulic processing in the
system show rise and fall in water table with respect
to the head of year 2005, (Table 2). The average
magnitude of water level fluctuation is around 3m,
which is comparable with the observed value. There
is a large predictive volume of recharge to the
aquifer compared to the predictive volume of
pumpage in year 2015 which encourage future
groundwater resources improvement for decision
makers for development planning.
Table (2) Predicted cumulative groundwater budget for the study area
Time Component Inflow Mm3 % Outflow Mm3 %
year (2010)
storage 14.13 0.72 1974.85 98.52720
Constant hea Constant head 396.9 19.79 3.40 0.16967
pumpage 0.0 0.0 26.117 0.13030
Recharge 1593.6 79.49 0.0 0.0
total 2004.6 100 2004.37 98.82
year (2015)
Storage 14.27 0.42 3321.15 99.08
Constant head 484 14.25 29.18 0.0
pumpage 0.0 0.0 45.97 0.87
recharge 2897.24 85.33 0.0 0.0
total 3395.56 100 3400.60 99.95
Fig.5 Predicted water level contour for year 2015
V. Conclusion
The model calibration of Ennahud
Cretaceous sedimentary aquifer was acceptable
within the average Root Mean Square error (RMS),
Residual Mean, and standard error of estimate to be
less than 1.482m, 0.526m and 0.22 respectively.
The contour maps of the simulated heads show fair
similarity with those generated from initial heads
which confirm acceptable model calibration. The
regional groundwater flow direction is towards the
center with localized cones of depression ascribed to
heavy pumping. The average change of storage,
pumpage and recharge of the aquifer during
simulation time calculated to be 5.62, 6.73 and
530.4 mcm respectively. The predictive simulation
for ten years using the calculated heads of year 2005
shows that the continued pumping will create
relatively high changes in head distribution in the
model area, and gives a maximum drawdown of 5 m
at 2015. The average magnitude of water level
fluctuation is around 3m, which is comparable with
the observed value.
References
[1] Anderson, MP, and Woessner, WW, 1992.
Applied groundwater modelling,
Simulation of Flow and Advective
Transport, pp.1-27.
[2] Brozovic N, Sunding DL, Zilberman, D,
2006. Optimal management of groundwater
over space and time. In: Goetz RU, Berga
D (eds) Frontiers in water resource
economics. Springer, New York
[3] Brozovic N, Sunding DL, Zilberman D,
2010. On the spatial nature of the
660000 680000 700000 720000 740000 760000 780000 800000
1400000
1420000
1440000
660000 680000 700000 720000 740000 760000 780000 800000
1400000
1420000
1440000
0 20000 40000 60000 80000 m
N
6. Mohammed Ginaya, Adil Elkrail, Abdalla Farwa / International Journal of Engineering
Research and Applications (IJERA) ISSN: 2248-9622 www.ijera.com
Vol. 3, Issue 3, May-Jun 2013, pp.217-222
222 | P a g e
groundwater pumpin externality. Resour
Energy Econ 32:154–164
[4] ElKrail AB, 2004, Numerical simulation of
Subsurface Flow and Groundwater
Vulnerability Assessment in Songhuajiang
River Valley, Dissertation of Doctor of
Engineering Hohai UniversityP.R.of China.
[5] Ginaya MA, 2001. Hydro- geophysical
investigation of En Nuhud basin, Western
Kordofan, MSc.Thesis Dep. of Geology
and Mining Univ. of Joba. Sudan,
[6] Harrington GA, Cook PG, Herczeg
AL.,2002. Spatial and temporal variability
of groundwater recharge in central
Australia: a tracer approach. Ground Water
40(5):518–528
[7] Hsu KC, Wang CH, Chen KC, Chen CT,
Ma KW., 2007. Climateinduced
hydrological impacts on the groundwater
system of the Pingtung Plain, Taiwan.
Hydrogeol J 15(5):903–913
[8] Jyrkama MI, Sykes JF, 2007. The impact of
climate change on spatially varying
groundwater recharge in the Grand River
Watershed (Ontario). J Hydrol 338(3–
4):237–250
[9] Keidser, AD, Rosbjerg, K, Hogh Jensen,
and Bilsch K, 1990. A joint Kriging and
zonation approach to inverse groundwater
modeling, In Calibration and Reliability in
Groundwater Modeling (K. Kovar, ed.),
IAHS Publ. 195, pp. 171-184.
[10] Scanlon BR, Keese KE, Flint AL, Flint LE,
Gaye CB, EdmundsWM, Simmers I,
2006.Global synthesis of groundwater
recharge in semiarid and arid regions.
Hydrol Proc 20:3335–3370
[11] Sibanda T, Nonner JC, Uhlenbrook S,
2009. Comparison of groundwater recharge
estimation methods for the semi-arid
Nyamandhlovu area, Zimbabwe.
Hydrogeol J 17:1427–1441
[12] Stoll S, Hendricks Franssen HJ, Butts M,
Kinzelbach W, 2011. Analysis of the
impact of climate change on groundwater
related hydrological fluxes: a multi-model
approach including different downscaling
methods. Hydrol Earth Syst Sci 15:21–38
[13] Wood WW, Sanford WE, ,1995. Chemical
and isotopic methods for quantifying
ground water recharge in a regional,
semiarid environment. Ground Water
33(3):458–468