A COMPARATIVE STUDY FOR SELECTION OF EFFECTIVE ELECTROLYTE SOLUTION FOR ELECT...
Bk24399408
1. B. Jothithirumal, Dr .E. James Gunasekaran, Chandan Dey / International Journal of
Engineering Research and Applications (IJERA) ISSN: 2248-9622
www.ijera.com Vol. 2, Issue 4, July-August 2012, pp.399-408
Numerical Analysis Of Surface Reaction Of Catalytic Converter
B. JOTHITHIRUMAL,1 Dr .E. JAMES GUNASEKARAN2, CHANDAN
DEY3,
Assistant professor, Associate professor, Research Scholar
Dept. of Mechanical Engineering
Annamalai University
ABSTRACT
Pollution has become a major problem converter components is playing a very vital across
throughout the world. The automotive pollution the world.Literature review reveals numerous
is responsible highly for the global climatic publications on two-and three- dimensional
changes since fifties increased concentration of computational fluid dynamic(CFD) modelling of a
pollutants in the vehicle emissions poses a single channel of the monolith(Canu
serious health hazards to the public. &Vecchi,2002;Chatterjee, Deutschamnn, &
Consequently, the air (prevention & control of Warnatz, 2001; Deutschamnn, Maier,Riedel,
pollution) act was passed in India in 1981, and Stroemann, & Dibble, 2000;Grimm &
its amendments and emissions control Mazumder,2008; Groppi, Belloli, Tronconi,
regulations became stringent step by step. Due &Forzatti, 1995; Holder, Bolliga,Anderson,
to increasingly stringent government regulations &Hochmuth, 2006; Mantzaras, Appel, & Benz,
on vehicle nitrogen oxides (NOx) emission levels 2000; Papadias, Zwinkels, Edsberg, & Bjormborg,
the selective catalytic reduction (SCR) of NOx to 1999; Raja, Kee, Deutschmann, Warnatz, &
N2 by hydrocarbons has gained a great deal of Schmidt,2000; Sallamie &Koshkanab, 2003;
attention. Catalytic converters for petrol driven Young & Finlayson, 1976, among many
passenger car have now become mandatory for others).Recently, due to the shortage of better
new cars and SCR with ammonia water alternatives,the knowledge gained from the
injection system is used to reduce the exhaust simulation of a single channel is extrapolated to the
pollution. entire catalytic conveter.Since the channels are
The project work reports some result of coupled to each other through heat transfer,and
investigations carried out on the operation of individual channels may encounter different flow
ammonia water injection system on exhaust rates,extrapolation of the results of a single channel
carried out by simulation model to reduce the to the entire converter is not always accurate,and
NOx formation. The present work was done on may lead to flawed designs(Tischer,correa &
simulation model of catalytic converter on duetschmann,2001).Shuai and wang (2004)
exhaust system using Comsol multiphysics modelled the monolithic reactor using a two
software. This project report describes the use dimensional model,in which the reactor was
of catalytic converter and injected ammonia modelled as a porous medium and surface reactions
water to reduce the harmful exhaust gas. were modelled using a two step
mechanism.Kolaczkowski and Serbertsioglu(1996)
Keywords: monolith reactor,NOx,NO,Ammonia performed analytical modelling of channel
interactions in catalytic combustion reactors.The
1.INTRODUCTION focus of their study was the effect of monolith
The reduction of Automobile pollution material properties on heat
using catalytic converter in the latest vehicle speaks dissipation.Chen,Alexio,Williams,Leprince,and
in high volume towards its successes. The uses of Yong(2004)performed three dimensional CFD
catalytic converter are becoming compulsory for all modelling of flow and heterogeneous reactions in
the heavy vehicles in order to prevent global catalytic converters.The pressure and velocity
warming. The modelling of catalytic converter as fields were calculated by modelling the monolith as
well as its simulation of surface reaction is very a porous medium. The surface reaction model was
important to determine the conversion rate or the then superimposed on the fluid flow results.Te
amount of pollutants reduction in the core of objective of the present study is to demonstrate the
catalytic converter of the flue gasses from the effectiveness of a new implicit coupled for such
engines. The catalytic converter model is large scale catalytic converter.
simulating for the implementation of new catalytic This paper describes how the modelling of
converter technology. For this aspect, the role of catalytic converter has done using plug flow reactor
exhaust gas after treatment method for the catalytic to obtain its high efficiency while simulating the
model, the characteristic graphs of various inlet
399 | P a g e
2. B. Jothithirumal, Dr .E. James Gunasekaran, Chandan Dey / International Journal of
Engineering Research and Applications (IJERA) ISSN: 2248-9622
www.ijera.com Vol. 2, Issue 4, July-August 2012, pp.399-408
temperatures on what the changes in molar flow
rate, selectivity parameters, temperature profiles
etc.With the results this paper illustrates about the
changes of different parameters of fluid like molar
concentrations, temperature distributions,
isosurface etc.which represents the conversions of
pollutants like SOx and NOx in its monolithitic
reacting surface made up of materials zeolite and
kaoline.While on the designing the catalytic
converter model the important issue is the impacts
of scale up or scale down of the catalytic
converter,that is what happens if the overall
dimensions of the catalytic converter is going to
increase or decrease,keeping the channel
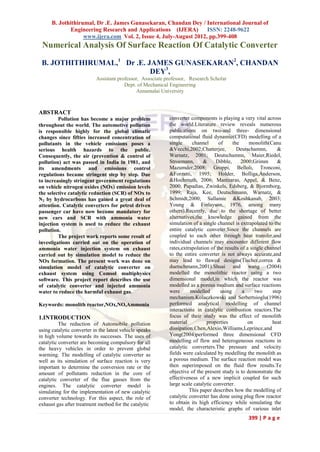
dimensions unchanged?This is a critical question FIG: 1 SIMULATION MODEL FOR THE MULTI
which has to be answered by modelling and CHANNEL
simulation in order to keep design cost low.
2.COMPUTATIONAL METHOD
The modelling of catalytic converter is
done here using comsol multiphysics software. The
3D model of the catalytic converter is drawn here
with its inlet, outlet, inlet walls, outlet walls,
reactor surface boundaries, and the domains like
supporting walls &channel blocks. The 2D object
of 100 mm dia circle with its channel blocks is
extruded up to 470
mm to represent the 3D model of catalytic
converter with its reactor surface. In the process of
simulation It is used the „standard SCR‟ reaction
4NH3+4NO+O2→4N2+6H2O----------------------
(1)
In the absence of oxygen, to reduce NO a slower FIG:2 THE MESH OBJECT OF CATALYTIC
reaction also goes on, which is CONVERTER
4NH3 +6NO→5N2+6H2O.--------------------------
(2)
When the NO2/NO ratio is close to unity,a much
higher rate reaction prevails, often known as „fast
SCR‟
2NH3+NO+NO2→2N2+3H2O.--------------------
(3)
Madia et al performed an investigation of
the side reactions observed during the SCR
process.Madia et al also investigated the effect of
the increased NO2 fraction caused by an oxidation
catalyst located upstream of the SCR converter, and
concluded that increasing the NO2/NO fraction up
to 1 enhances NOx conversion at low temperatures,
due to the reaction with NO and NO2,which is
significantly faster than reaction with NO and
O2.In the numerical studies ,heterogeneous
reactions mechanisms are used to describe surface FIG:3 INLET
reactions on catalytic plates,where the chemical
species are absorbed,react with the surface plane of
the catalyst,followed by the desorption.
The stationary plug flow is used In the
simulation process, and the study 1 is computed to
plot the graphs according to different temperatures.
400 | P a g e
3. B. Jothithirumal, Dr .E. James Gunasekaran, Chandan Dey / International Journal of
Engineering Research and Applications (IJERA) ISSN: 2248-9622
www.ijera.com Vol. 2, Issue 4, July-August 2012, pp.399-408
FIG:4 OUTLET
FIG:7 SUPPORTING WALLS
FIG:5 INLET WALLS
FIG:8 REACTION SURFACE
2.1 NO Reduction in a Monolithic Reactor
This is a modelling example of catalytic
converter that removes nitrogen oxide from a car
exhaust through the addition of ammonia. This
example shows an application of the above
described modelling strategy and demonstrates
through a series of simulations how an
understanding of this reactor and its system can be
improved. To do this, it uses a number of the
interfaces and features found in the Chemical
Reaction Engineering Module.
This example illustrates the modelling of selective
FIG:6 OUTLET WALLS reduction of nitrogen oxide (NO) by a monolithic
reactor in the exhaust system of an automobile.
Exhaust gases from the engine pass through the
channels of a monolithitic reactor filled with a
porous catalyst, and by adding ammonia (NH3) to
this stream, the nitrogen monoxide can be
selectively removed through a reduction reaction.
Yet, ammonia (NH3) is also oxidised in a parallel
reaction, and the rates of the two reactions are
affected temperature as well as composition .This
401 | P a g e
4. B. Jothithirumal, Dr .E. James Gunasekaran, Chandan Dey / International Journal of
Engineering Research and Applications (IJERA) ISSN: 2248-9622
www.ijera.com Vol. 2, Issue 4, July-August 2012, pp.399-408
means that the amount of added ammonia must temperature. From a mass transfer point of view,
exceed the expected amount of nitrogen oxide channels of the reactor monolith can be considered
while not being so excessive as to release NH3 to to be uncoupled to one another. Therefore it is
the atmosphere. reasonable to perform initial simulations where a
The simulations are aimed at finding the optimal single reactive channel, modelled by nonisothermal
dosing of NH3, and investigating some of the other plug flow equations represents the monolith
operating parameters in order to gauge their effects. reactor. This model is set up and solved using the
On defining the modelling strategy, first the Reaction Engineering interface.
selectivity aspects of the kinetics are studied my
modelling initial reaction rates as function of 2.4 MODEL EQUATION
temperature and relative reactant amounts. Assuming steady state, the mass balance
Information from these studies point to the general equation for a flow reactor is given by
conditions required to attain the desired selectivity. 𝐝𝐅𝐢
= 𝐑𝐢
The reactor is then simplified and modelled as a 𝐝𝐕
Where F is the species molar flow rate (mol/s) ,V
non-isothermal plug flow reactor. This reveals the
represents the reactor volume(m2)and is R, the
necessary (NH3) dosing levels based on the
species net reaction rate (mol/(m2s)).the energy
working condition of catalytic converter and
balance for the ideal reacting gas is:
assumed flow rate of NO in the exhaust stream. A 𝑑𝑇
3D model of catalytic converter is then set up and 𝑖 𝐹𝑖 𝐶 𝑝,𝑖 . = 𝑄 𝑒𝑥𝑡 + 𝑄----------------------------
𝑑𝑉
solved. This includes mass transfer, heat transport, -----(5)
and fluid flow and provides insight and information Where CP is the species molar heat capacity
for optimizing the dosing levels and other (J/mol.k) and Qaxt is heat added to the system per
operational parameters. unit volume (J/m2s). Q denotes the heat due to
chemical reaction (J/(m2s)).
2.2 CHEMISTRY Q= - j Hj rj
Two parallel reactions occur in the Where h, the heat of reaction (j/mol) and, r the
zeolite/kaolin washcoat of the monolithic reactor reaction rate (mol/m3s)
.The desired reaction is NO reduction by ammonia: The reactor equations are solved for a channel 0.36
4NO + 4NH3 + O2 → 4N2 +6H2O-------------- m in length with a cross section area of 12.6 mm2
--------------(1) .It is assumed that that exhaust gas containing
41.1 mmol/m3 of NO at a temperature of 523K
However, ammonia can at the same time undergo passes through the channel at 0.3m/s
oxidation:
4NH3 + 3O2 → 2N2 + 6H2O---------------------- 2.5 THE 3D REACTOR
--------(2) It is clear from the kinetic analysis as well
The heterogeneous catalytic conversion of NO to as from the single channel model that temperature
N2 is described by an Eley-Rideal mechanism .A plays a central role in affecting the optimal dosing
key reaction step involves the reaction of gas phase of NH3.As the temperature distribution is likely to
NO with surface adsorbed NH3.The following rate vary from the channel to channel in a catalytic
equation (mol/(m3s)) has been suggested in Ref.1 converter, a full 3D reactor model is called for.
for Equatiion1:
r1=k1 cNO( acNH3/1+ acNH3)------------------------------ 2.6 Model geometry
----(3) The monolithic reactor has a modular
Where structure made up of monolith channel blocks and
E1
k1=A1exp(− ) supporting solid walls. The reactor is 470 mm long
RgT
And and 50 mm in radius.
Eo
a=A0 exp (− )
RgT
For Equation2, the reaction rate
(mol/(m3s)) is given by
r2=k2cNH3----------------------------------------------------(4)
Where
E2
k2=A2 exp (− )
RgT
Fig:9 NO reduction chemistry takes place in the
2.3 THE PLUG FLOW REACTOR
channel blocks. Supporting walls hold together the
To find the minimum level of (NH3)
full reactor surface.
required to reduce the NO present in the exhaust
gas requires a reactor model accounting for
changing reactant concentrations and system
402 | P a g e
5. B. Jothithirumal, Dr .E. James Gunasekaran, Chandan Dey / International Journal of
Engineering Research and Applications (IJERA) ISSN: 2248-9622
www.ijera.com Vol. 2, Issue 4, July-August 2012, pp.399-408
2.7 MODEL EQUATIONS AND channel models are connection though the heat -
ASSUMPTIONS transfer equation for the reaction monolith.
In the present example a pseudo
homogeneous approach is used to model the 2.9 Fluid Flow
hundreds of channels present in the monolith Assuming fully developed laminar flow in
reactor. As no mass is exchanged between channels, the average flow field is proportional to
channels, each channel is described by 1D mass pressure difference across the reaction .The flow of
transport equations. Furthermore, fully developed reaction gas through the monolith can the be
laminar flow in the channels is assumed, such that modelled using a Darcy‟s law interface with
the average flow field is proportional to the following governing equation;
pressure difference across the reactor. The fluid 𝛻. (𝑝 𝑢)=0
flow transports mass and energy only in the 𝑘
u=- 𝛻𝑝
channel direction. The energy equation describes µ
the temperature of the reacting gas in the channels, The monolith is treated as a porous matrix with the
as well as the conductive heat transfer in the effective permeability k(m2).the density
monolith structure and the supporting walls. As the ,p(kg/m3),and viscosity,µ(Pa.s),represent properties
temperature affects not only the reaction kinetics of the reacting gas.
but also the density and viscosity of the reacting
gas, the energy equation is what really connects the 2.10 Heat Transfer
channels in the reactor structure turning this into a A single temperature equation describing the heat
3D model. transfer in porous monolith reactor can be written
as:
𝜕𝑇
2.8 Mass Transport (pCp)eq +pf Cpf u𝛻𝑇 = 𝛻.(keq 𝛻𝑇)+Q----------------
𝜕𝑡
The mass balance describing transport and -(7)
reaction in reacting channels are given by For the stationary case this reduces to:
diffusion-convection equations at steady state: piCpfu.𝛻𝑇=𝛻.(keq 𝛻𝑇)+Q--------------------------------
∇. (−Di∇ci)+u.∇ci = Ri------------------------------ --(8)
--------(6) Where pi(kg/m3) is the fluid density Cp(J/kg.K) is
Here Di denotes the diffusion coefficient (m2/s), CI The fluid heat capacity ,and keq (W/(m.k))is the
is the species concentration (mol/m3), and u equals equivalent thermal conductivity. Furthermore
the velocity (m/s). The term R (mol/(m3s)) u(m/s) is the fluid velocity field, which in this
corresponds to the species rate expression. model is calculated in the Darcy‟s law interface,
Mass transport is only allowed in the direction of and Q(W/m3) is the heat source, which is due to
the channels, corresponding to direction of the x- exothermic chemical reaction:
axis in the 3D geometry used in this example. For Q= Q1 + Q2 =-r1H1-r2H2
the diffusive transport this is accomplished by The equivalent conductivity of the solid –fluid
setting the y and x components of the diffusivity system, keq is related to the conductivity of the
matrix to zero. The pressure –driven flow in the solid keq, and to the conductive of the fluid, keq by:
monolith is also defined in the direction of the x- Keq=ʘP kp+ ʘf kf
axis hereby restriction the convective mass Here ʘp denotes the solid materials volume
transport to the channel direction as well. Each friction, here 0.25, which is related to the volume
monolith channel thus behaves as a 1D plug-flow fraction of the fluid ʘfby:
model with included diffusion. These separates ʘf+ʘp=1
model (equation8). the chemical reaction
Equation (8) is the equation set up by heat transfer engineering module uses the following set
interface for a fluid domain. For the supporting in polynomial as default expressions describing
the reactor, only heat transfer by conduction species thermodynamics properties
applies: Cp, i =Rg (a1+a2T+a3T2+a4T3+a5T4) --------------------
− 𝛻 (k8 𝛻𝑇)=0 ----------------(9)
Where k8 (w/m-k) is the thermal conductivity for hi = Rg
the solid walls
a 2T 2 a3T 3 a 4T 4 a5T 5
As mentioned, the temperature affects not only ( a1T a 6)
reaction kinetics but also the density and viscosity 2 3 4 5
of the reacting gas. In this way the heat transfer ----(10)
equation connects channels in the reactor structure. si = Rg (a1InT+a2T
2 3
a3T a 4T
a5 a 7)
4
2.11 Thermodynamic and transport Properties --------
2 3 4
Accurate thermodynamic data is required
as input to energy balance equation, both in the -(11)
plug flow model (equation5) and the 3Dmonolith
403 | P a g e
6. B. Jothithirumal, Dr .E. James Gunasekaran, Chandan Dey / International Journal of
Engineering Research and Applications (IJERA) ISSN: 2248-9622
www.ijera.com Vol. 2, Issue 4, July-August 2012, pp.399-408
Here Cp ,denotes the species heat capacity (J/mol The chemical Reactions are modelled with
k),T the temperature (K) and Ri the ideal gas chemical kinetic reaction mechanism. It is used to
constant ,8.314 (j/mol k) further ,h is the molar perform three different analyses concerning the
enthalpy (j/mol) and SI represent its molar entropy reduction of NO in a monolithic reactor. the
(J/mol k).A set of seven coefficients per input for reactions modelled are:
the polynomials. The coefficients a1 through a2 1) Kinetic Analyses-to explore the system of
relate to the species heat capacity ,the coefficient a3 competing reactions and learn what
is associated with the species enthalpy of formation conditions that promote selectivity
(at 0 K) and the coefficient a1 comes from the towards NO reduction
species entropy of formation (at 0 K). 2) Plug Flow Reactor Model- to explore the
The equation from outline by equqtion9 through coupled mass and energy balance
equqtion11 is referred to as CHEMKIN or NASA equations in a single channel model,
format (ref 2) Database resources list the needed resulting in a first estimate of the NH3
coefficients are for different temperature intervals dosing level
(ref3).in the this exampl.
3) 3D Reactor Model-testing the reactor
3 RESULT AND DISCUSSIONS operating conditions in a full 3D reactor
To model the injection of urea a typical representation, noting the space-dependent
catalytic converter is chosen whose dimension is effect due to coupling between monolith
100 mm and length is 470 mm. It is necessary to channels.
inject urea as a liquid solution (called Ad blue The surface reaction of NOx reduction will be
solution) into the hot exhaust gas, which is effective only at certain temperatures. Hence to
normally between the temperatures of 423k to573k find out the range at which the reactions are
depending upon the load of the engine. effective, the simulations were conducted for four
Urea injection process is modelled by Ad blue exits. The temperature profile came across
liquids (32.5% urea and 73.5%water), solid model corresponding the temperatures 423k, 523k,
is created and meshed in comsol multiphysics4.2 623k,&723k with the changes in molar flow rate
software. and temperatures.
The results are plotted below
3.1 SIMULATION PROCEDURE The graphs of molar flow rate are plotted below:
For reacting gas mixtures the reaction
engineering feature makes use of kinetic gas theory
to set up expressions for transport properties such
as diffusivities viscosity and thermal conductivity
as function of temp ,pressure and composition .in
this example ,the species diffusivities (m3/ s) are
calculated using the formula
D 2.695.10 3 .
T3 M A
M B / 2.10 3 M A M B
P A B D
---------(12) (a) Exhaust gas temperature 423k
Where 𝛺 D is a collision integral
D f T , ,
,
kb
404 | P a g e
7. B. Jothithirumal, Dr .E. James Gunasekaran, Chandan Dey / International Journal of
Engineering Research and Applications (IJERA) ISSN: 2248-9622
www.ijera.com Vol. 2, Issue 4, July-August 2012, pp.399-408
length of the catalytic converter.Fig:10 show the
comparison of flow rates of ammonia and nitrogen
oxide (NO) along the length wise direction. It is
evident from the picture that, as the temperature of
exhaust increases the reduction of NO is enhanced.
For example at a volume of 15 units the NO level
are147.5 and 2.0 moles /sec for the temperatures of
423k and 523k.Further increase in temperature does
not enhance NO reduction as it can be seen for the
figures 10 (b) and 10 (c).Analysing the figure it can
be seen that the NO level is around 2.5 moles/sec.
at a location of 15 volume units.
Hence it can be concluded that the optimum
b)Exhaust gas temperature 523k exhaust gas temperature for the NO reduction with
ammonia for the given NO emission level is 523k.
The graphs of temperature profile are given below;
c)Exhaust gas temperature 623k
(a) Exhaust gas temperature 423k
d) Exhaust temperature 723k
Fig:10 Spatial variation of flow rates of NH3 and
NO for different temperatures with respect to
volume of catalytic converter.
Various parameters like the reaction rates of b)Exhaust gas temperature 523k
reaction 1 and reaction 2, molar flow rates and
temperature across the domain were calculated and
measured. The measurements were done across the
405 | P a g e
8. B. Jothithirumal, Dr .E. James Gunasekaran, Chandan Dey / International Journal of
Engineering Research and Applications (IJERA) ISSN: 2248-9622
www.ijera.com Vol. 2, Issue 4, July-August 2012, pp.399-408
apparently NO reaction induced temperature
rise. The Fig: 11 b) temperature 523k represents
that the temperature is 523 k at the zero unit
volume of the SCR system and it suddenly goes
high up to 530k at 10 unit of volume of the SCR
system and then continuously decreases to
below 490k at the outlet of SCR system. From
the Fig:11 c)temperature 623k , it shows that the
temperature graph rapidly increases from 623k
temperature to above 650k temperature within 2
unit volume of the SCR system and then
decreases to below 560k to the outlet of SCR
system. The last Fig: 11 d) temperature 723k
represents the temperature increasement from
723k to above 750k very fastly within the single
unit volume of the SCR system and then
continuously decreases to below 620k
temperature at the outlet of the SCR system.
c)Exhaust gas temperature 623k
Ammonia (NH3) and nitrogen oxide (NO) for
the surface concentration.
From the fig:12 concentration figure of NO & NH3,
d) Exhaust temperature 723k it is shown that the surface concentration (mol/m3)
is maximum at inlet of the model, continuously
decreasing towards the outlet of the model. This
Fig: 11 Spatial variation of exhaust gas temperature represents that the pollutants like NO,NH3 are high
for different exhaust conditions (inlet SCR in concentration at the inlet of the catalytic model
condition). and while passing through the catalytic core the
pollutants get converted to some other elements by
From the fig: 11 a) temperature 423k,it shows the chemical reaction inside the catalytic core.
that the temperature is very high (about 423k) at Which shows the lower concentration value of NO
the zero volume (inlet) level of the SCR system, & NH3 at the outlet of the model.
and it continuously reduces to about 402 k at
the outlet of SCR system. It shows that there is
12 a. Concentration of NO 12 b.
concentration of NH3
Fig: 12 Surface concentrations of NO & NH3 for a
typical 3D volume
Ammonia (NH3) and nitrogen oxide (NO) for
the slice concentration.
406 | P a g e
9. B. Jothithirumal, Dr .E. James Gunasekaran, Chandan Dey / International Journal of
Engineering Research and Applications (IJERA) ISSN: 2248-9622
www.ijera.com Vol. 2, Issue 4, July-August 2012, pp.399-408
Contour Plots of NH3 & NO
13 a concentration of NO 13 b. 15 a Contour Plots of NH3 15 b
concentration of NH3 Contour Plots of NO
Fig: 13 slice concentration of NO & NH3 for a Fig 15 Contour Plots of NH3 & NO
typical 3D volume Contour plots of both the NH 3 and NO is higher at
inlet and reduced to almost zero at the exit.
Moreover the ammonia slippage is minimum in this
The above figures shown the slice concentration case. Hence we can safely assume that health
(mol/m3) of NO and NH3 which is maximum at hazard due to ammonia is nil.
inlet and continuously decreasing towards the Enthalpy of reaction 1 & reaction 2
outlet. It refers the slice concentrations of NO &
NH3 part by part how & by what value it is
decreasing towards the outlet of the model. It
represents that the surface reaction takes place from
the inlet of the model and it is well finished before
the outlet of the model.
Pressure on both the cases of slice and surface of
the catalytic converter
16 a Enthalpy of reaction 1 16 b
Enthalpy of reaction 2
Fig 16 Enthalpy of reaction 1 and
reaction 2
The Fig: 16, shows that the enthalpy is higher at
the inlet portion and decreases to the outlet of the
SCR system of both the cases of Reaction 1 &
Reaction 2.This shows that by the time the exhaust
stream enters the middle of the Catalytic core
13 a Slice pressure almost all the reactions have been completed. At
14 b surface pressure the exit no reaction occurs at all.
Reaction rate of reaction 1 & reaction 2
Fig 14 Slice and Surface Pressure of
Catalytic Converter model.
The figures show the pressure distribution through
the catalytic converter model, which is having a
higher pressure at the inlet and continuously
decreasing pressure towards the outlet for both the
slice and surface cases. This represents that at the
inlet of the model due to the injected ad blue
solution and entering exhaust gas from the engine
the pressure is high, as the reaction takes place at
the entrance of the catalytic core, the specific
volume increases and hence the pressure increases.
As the gas flows further downstream the reaction
temperature reduces and hence the pressure too
decreases.
407 | P a g e
10. B. Jothithirumal, Dr .E. James Gunasekaran, Chandan Dey / International Journal of
Engineering Research and Applications (IJERA) ISSN: 2248-9622
www.ijera.com Vol. 2, Issue 4, July-August 2012, pp.399-408
17 a. reaction rate of reaction 1 17 b. system. The reaction rate pictures of reaction 1 and
reaction rate of reaction 2 reaction 2 also shows that the reaction rate is high
Fig 17 Reaction rates of reaction 1 and at the inlet and decreases at the out let of the SCR
reaction 2 system.
The Fig: 17 (A) shows that the reaction rate of The concentration of NOx and NH3 is also
reaction 1 is higher at the inlet of SCR system and maximum in the inlet and reduced downstream of
continuously decreases to the outlet of the SCR the SCR system .The pollutants like NO and NH 3
system. The Fig: 6.6 (B) shows that the reaction are higher in concentration (0.0557 mol/m3) .The
rate of reaction 2 is also much higher at the inlet of concentration of NO is reduced to a lowest value of
SCR system and continuously decreases to the flow at 0.005 mol/m3 at the exit of the catalytic
outlet of the SCR system. This represents that the core. Whereas the NH3 concentration at exit is
chemical reaction started from the inlet of the SCR around 0.01 mol/m3.This clearly shows that the
system and it is well finished before the outlet of surface reaction occurs satisfactorily at the catalytic
the SCR system. The reaction is completed within core.
the catalytic core. Moreover it can be concluded that at 523k
temperature the catalytic converter is highly
Surface temperature effective and it reduces the pollutants to a very
minimum level.
5. REFERENCE
1. B.Jothi Thirumal and Dr. E.James
Gunasekaran, “Numerical Study on
Ammonia Evaporation for Urea
Selective Catalytic Reduction
System”International Journal of Science
and Advanced Technology (ISSN 2221-
8386) Volume 1 No 5 July 2011.
2. S.Pietrzyk, F.Dhainaut,A.Khodakov and
P.Granger, „Catalytic Reduction under
Surface temperature unsteady- state conditions. Modelling
with COMSOL’ Excerpt from the
proceedings of the COMSOL users
Fig18. Surface temperature of the catalytic conference 2006 Paris.
model 3. K. Hirata,N Masaki,M Yano,H
The surface temperature figure shows that the Akagawa,K, Takada, J kusaka,and T Mori,
temperature variation is maximum at the inlet of “Development of an improved urea
the model which is approximately 523k and it selective catalytic reduction-diesel
decreases to the outlet where it seems to be less particulate filter system for heavy-duty
than 440k.This represents that the reaction has been commercial vehicles” Int.J.Engine
occurred from the inlet of the SCR system and it is Res.vol.10 on 15 May 2009.
completed before the exit of the SCR system. 4. D Tsinoglou and G Koltsakis, “Modelling
of the selective catalytic NOx reduction
4. CONCLUSION in diesel exhaust including ammonia
The SCR technology is a successful storage” Proc.IMechE Vol.221 Part D:
method of reducing the harmful gases such as NOx, J.Automobile Engineering on 13 Sep
HC, CO. The aim of the research work is to show 2006.
the reaction of NO and NH3 in the monolith reactor 5. S-C Jung and W-S Yoon, “Modelling and
of catalytic converter with varying temperatures by parametric investigation of NOx
using COMSOL MULTIPHYSICS 4.2 software. reduction by oxidation precatalyst-
From the simulation study it was observed that the assisted ammonia-selected catalytic
conversion of NO into N2 is effective only in the reduction” Proc.IMeche Vol.223 part D:
middle range of temperature i.e. about 523k. J.Automobile Engineering on 15 may
From the enthalpy picture it is seen that the internal 2009.
energy is maximum at the inlet of the SCR system
and decreases towards the outlet. This represents
that the reaction is started from the inlet of SCR
and finished well before the outlet of the SCR
408 | P a g e