Applications of quartering method in soils and foods
H046034353
1. Onosakponome O. R Int. Journal of Engineering Research and Applications www.ijera.com
ISSN : 2248-9622, Vol. 4, Issue 6( Version 3), June 2014, pp.43-53
www.ijera.com 43 | P a g e
Systematic Modeling of Sludge Filtration Process Using
Dimensional Analysis Technique
#
Onosakponome O. R, And #
Onyejekwe S. C
#
Department of civil engineering, Madonna University, Akpugo campus. Enugu state, Nigeria.
ABSTRACT
The handling and disposal of sludge; the largest constituent removed in the process of treating wastewater is one
of the greatest challenges facing the environmental engineer. The sludge has high water content and
compressibility attribute and as such it is expedient to dewater it to reduce its volume and prevent environmental
health hazard. This study presents a sludge filtration equation which incorporates the compressibility coefficient
using a modified dimensional analysis technique. The equation was validated using experimental data from a
pilot scale sand drying bed equipment yielding a close agreement between the theoretical and experimental
values of the slope and intercept with a correlation coefficient ranging from 0.94- 0.98. The experimental
slope and intercept was found to be (1260913.48 s/m6
, 4872.53 s/m3
) (5359604.57 s/m6
, 844882.56 s/m3
),
(112117050.4 s/m6
, -2135816.16 s/m3
), (145562880 s/m6
, -30497917.03 s/m3
) while the theoretical slopes and
intercepts are (1257426.75 s/m6
, 5270.26 s/m3
),( 4579418.42 s/m6
, 905658.24 s/m3
), (112117075 s/m6
, -
21358166.74 s/m3
), (206699290.5 s/m6
, -4589555.58 s/m3
) respectively. The equation also accounts for the
compressibility attribute believed to affect sludge filtration process.
KEYWORDS: Sludge, Drying bed, Filtration, Compressibility, Dimensional analysis.
I. INTRODUCTION
The treatment of wastewater before disposal is
an important step in the minimization of
environmental pollution. In the process of treating
wastewater, sludge, which is amongst the
constituents removed, is by far the highest in volume.
The handling and disposal of this sludge is one of the
greatest challenges facing the environmental
engineer. The sludge has high water content and
compressibility attribute and as such it is expedient to
dewater it to reduce its volume and prevent
environmental health hazard.
The dewatering of sludge using the constant
vacuum filtration method has been adopted in full
scale in the 1920s. Since then, a number of equations
have been presented by various contributors aimed at
improving the performance of the sludge filtration
process, Carman, (1934), (1938); Race, (1935);
Coackley, (1956); Ademiluyi and others, (1987),
(1984), (1990); Gale, (1975); Anazodo, (1974);
Ademiluyi, (1986). However, their research was
limited to experimental work which could not
provide an insight into the interactive nature of
sludge filterability.
The application of FMTLXLYLZ dimensional
technique to sludge filtration using sand dying bed is
an improvement to sludge filtration theory which
became necessary because previous equations
describing filtration process using constant vacuum
filtration has been criticized for lack of agreement
between theory and experiment, Ademiluyi, (1983).
Also, the dimensional analysis equation presented by
Anazodo (1974) which was based on the constant
vacuum approach has also been criticized partly
because the equation did not account for the
compressibility attribute of sludge believed to affect
sludge filtration process. Sludge drying bed filtration
is one of the earliest processes used in the dewatering
of sludge before the introduction of mechanical
processes. The waste can be dewatered naturally in
an open or covered sand bed under variable pressure
and also requires a large amount of land for its
operation. Sand drying bed is affected by such
uncontrollable factors as Rainfall, Humidity and
Temperature. The process is cost effective and easy
to operate than the mechanical system and usually
produces sludge cake of about 25-40% solid.
Hence, the objective of this research is to present a
sludge drying bed filtration equation which
incorporates the compressibility coefficient believed
to affect sludge filtration process using a modified
dimensional analysis technique.
II. MATERIAL AND METHODS
2.1 FILTRATION APPARATUS
The pilot scale drying bed apparatus is a
rectangular structure of dimension 120cm x 75cm x
80cm which requires 0.27cm3
of the sludge sample
for filtration experiment. The filter unit consists of
gravel and sand with a drying area of 120cm long by
75cm wide. The empty apparatus is initially filled
with gravel to a height of 20cm and then this column
of gravel provides support for a column of sand of
depth 20cm. The sludge is introduced to the dry bed
RESEARCH ARTICLE OPEN ACCESS
2. Onosakponome O. R Int. Journal of Engineering Research and Applications www.ijera.com
ISSN : 2248-9622, Vol. 4, Issue 6( Version 3), June 2014, pp.43-53
www.ijera.com 44 | P a g e
by a bucket into the sand column and flows through
the sand and gravel to drain out from a drain pipe at
the base of the unit. Measuring tape is attached to the
side of the apparatus to read directly the fall in height
of the sludge at 2hour intervals. A 1000cm3
measuring cylinder placed at the base of the unit
collects the filtrate, were temperature of the liquid
can be measured.
2.2 EXPERIMENTAL PROCEDURE
Digested sludge of 0.27m3
volume collected
from the imhoff tank of the University of Nigeria
Nsukka was poured into the drying bed to a height of
30cm from the sand column. Before the filtration
started, a known volume of the well stirred filtering
sludge was collected and taken to the laboratory to
enable the determination of the initial solid content of
the sludge. The filtration started after 2minutes was
allowed for sludge to settle at the top of the sand
column so that the sludge provides the resistance
(specific resistance) to flow of liquid after which the
fall in height of the sludge with time and the
corresponding change in pressures were recorded.
Also the temperature of the sludge and the filtrate
before and after filtration were recorded and was
used to compute the density and the dynamic
viscosity of the sludge.
The volume of filtrate collected into the cylinder
was recorded for every 2hours interval for the first
day of filtration and 24hours for subsequent days
until the filtration came to an end. At the end of the
filtration period, the specific resistance was
determined using the modified equation.
The effect of different weight of ferric chloride
dosage on the specific resistance based on the
equation was investigated by taken five portions of
0.063m3
of sludge and mixing it with various amount
of ferric chloride dosage (10g,20g,30g,40g,50g) with
distilled water(1liters,2liters,3liters,4liters,5liters).
The mixture was stirred vigorously and poured into
the drying bed and another filtration started. After the
end of each of the separate five filtration experiments
the specific resistance was found using the data
collected. Also, at this point, a known volume of the
wet sludge was taken to the laboratory to measure the
compressibility coefficient of the sludge using the
odometer test.
2.3 DERIVATION OF EQUATION
2.3.1 DIMENSIONAL ANALYSIS AND THE
FMTLXLYLZ TECHNIQUE
Dimensional analysis is a technique that involves
the study of dimensions of physical quantities. It is
used primarily as a tool for obtaining information
about physical systems too complicated for full
mathematical solution to be feasible. It enables one to
predict the behavior of large systems from a body of
small scale models. It affords a convenient means of
checking mathematical equation. The technique of
dimensional analysis has several important
applications. It can be applied to the derivation of
unknown parameters in the relationship between
various variables and also in the analysis of model
design. The FMTLXLYLZ dimensional system is
derived by the combination of MLT and FLT
fundamental systems (that is, Mass, Length and
Time/ Force, Length and Time). The length L in this
system is differentiated into LXLYLZ mutually
perpendicular axes in space.
2.3.2 APPLICATION OF FMTLXLYLZ
DIMENSIONAL ANALYSIS TECHNIQUE
The application of FMTLXLYLZ dimensional
analysis technique to the derivation of unknown
relations depends upon the concept of completeness
of equation. A physical equation is the relationship
between two or more physical quantities. Any correct
equation expressing a physical relationship between
quantities must be dimensionally homogeneous and
numerically equivalent. Dimensional homogeneity
states that every term in an equation when reduced to
fundamental dimensions must contains identical
power of each dimension. Applying the above
principle to the derivation of filtration equation we
can represent the relationship between volume of
filtrate and the variables affecting sludge filtration
process by:
(1)
Were V is the volume of filtrate, A is the area of
filtration, P is the variable pressure applied during
filtration, µ is the dynamic viscosity of the fluid, M is
the concentration of the sludge , t is the time of
filtration and R is the specific resistance of the
sludge. The superscripts a, b, c, d, e, f are unknown
quantities to be determined.
For dimensional homogeneity we have that,
(2)
Were a, b, c, d, e, f are unknowns to be
determined using dimensional homogeneity between
variables.
For condition on:
: 1 = a- b - d (3)
: 1 =-2c - d + f (4)
: 0 = d - f (5)
: 0 = b + c (6)
: 0 = c + e (7)
3. Onosakponome O. R Int. Journal of Engineering Research and Applications www.ijera.com
ISSN : 2248-9622, Vol. 4, Issue 6( Version 3), June 2014, pp.43-53
www.ijera.com 45 | P a g e
From the above we obtained five
simultaneous equations ( equation 3- 7) in six
unknown (a, b, c, d, e, f) and which was solved using
normal equation to yield the following: a = d+3/2, b
= ½, C = -1/2, d, e = ½ , f = d.
Substituting the evaluated values above,
(8)
(9)
. (10)
(11)
Dividing through by V
(12)
Inverting equation (12) we have
(13)
A plot of versus gave a straight line from
which d = -1/2 and hence:
(14)
To accounting for compressibility coefficient in
equation (14), we know that
Pressure ( P) = ρgH were ρ is the density of water, g
is the gravitational acceleration, and H is the height
of sludge at a particular time interval.
Also were is the initial
heights of sludge and is the change in sludge
height between two successive time periods. Hence
pressure P =
Substituting the above transformation into equation
(14) we have:
(15)
Inverting equation (15) we have
(16)
(17)
We can also express M, the initial solid content as
were is the volume of sludge and Wd =
weight of dry sludge.
and ρg∆H = ∆p ,
ρgHs = P1 were P1 is the pressure at the initial
height of sludge.
Substituting the above transformation into equation
(17) we have,
(18)
Dividing equation (18) through by A we have,
(19)
The volume of sludge can be expressed also as
Were percentage of solid content expressed in
decimal, Specific gravity of sludge and =
density of filtrate.
Substituting the volume of sludge with
into equation (19) gives,
(20)
(Were
) (21)
(22)
(Were
= 1/∆e) (23)
(24)
(25)
Equation (25) can be written in the form
t/v = bV + C (26)
Which represents an equation of a straight line with
slope, b = and intercept, C =
and V is the volume of filtrate at a given time, t is
the time of filtration.
III. RESULTS AND DISCUSSION
The results of experiments conducted during the
sludge filtration experiments are all shown in tables 1
- 6. Table 1 shows the data for experimental slope
and intercept used for verifying the modified
equation. Table 2 shows the data used for the
calculation of theoretical slope and intercept that was
used to compare with the experimental value. Table 3
shows the result of the effect of using 10g of Ferric
chloride dosage on specific resistance of the sludge
and Table 4 shows the variation of specific resistance
with the different weights of Ferric chloride dosage.
Table 5 shows the laboratory result used in the
determination of void ratio of the conditioned sludge
with 10g weight of Ferric chloride dosage. Table 6
shows the data for computation of the sludge
compressibility coefficient of the sludge.
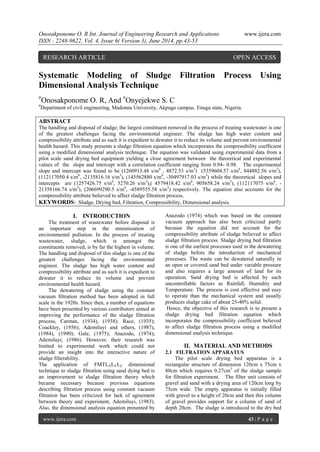
Fig 1 shows the graph of the experimental and
theoretical data used to validate the equation. From
the graph, the slope and intercept for the
4. Onosakponome O. R Int. Journal of Engineering Research and Applications www.ijera.com
ISSN : 2248-9622, Vol. 4, Issue 6( Version 3), June 2014, pp.43-53
www.ijera.com 46 | P a g e
experimental result is 1260913.48s/m6
and
4872.52s/m3
while that for the theoretical result
is1257424.31s/m6
and 5270.54 s/m3
respectively and
shows a close agreement between experimental and
theoretical values for the periods of filtration tested.
The modified equation predicts that the plot of t/v
versus v is a straight line and from the graph the two
plots shows a straight line with high coefficient of
correlation of 0.98.
In figures 2-4 there was also a close agreement
between theoretical slopes and intercept and the
experimental slopes and intercept except in figure 2
were we had a small difference between experimental
intercept and theoretical intercept. The theoretical
intercept was higher than the experimental intercept
by 7.2%. The difference may be attributed to more
of the sludge particles been suspended and so the
pressure of the fluid passing through the mass of
settled sludge increased thereby allowing more
filtrate to pass through and hence the ratio t/v
reduced.
t(s) V(m3
) t/v (s/m3
) V2
(m6
) v.t/v(s)
0 0 0 0 0
7200 0.0717 100,488.49 0.0051 7200
14400 0.1034 139,264.99 0.0107 14400
21600 0.1283 168,421.05 0.0165 21600
28800 0.1505 191,362.12 0.0227 28800
36000 0.1709 210,649.50 0.0292 36000
43200 0.1805 239,335.18 0.0326 43200
∑ 0.8053 1,049,521.33 0.1168 151200
Table 1: Data from filtration experiment used to calculate experimental slope and intercept
Volume of sludge (V) = 0.27 m3
, Initial Height
of sludge (Hs) = 0.3m, Average Height of sludge (H)
= 0.155m, Initial hydrostatic pressure (Pi) = 2931.9
N/m2
, Average Applied pressure (Pav) ρgh = 1514.82
N/m2
, Average Temp. = 26o
c, Density of water =
996.23kg/m3
, Area (A) = 0.9 m2
, Dynamic Viscosity
µ = 0.892N.s/m2
, Weight of dry solid Wd = 0.0157
kg, Initial Solid Content (M) = 0.058 kg/m3
,
Percentage of solid expressed in decimal Ps = 0.05,
Specific gravity of sludge Ssl = 1.05, Acceleration
due to gravity (g) = 9.81 m/s2
,
From Regression Analysis, we know that the
slope b is given by the formula below
b =
s/m6
C =
= 149931.62 - 145059.09 = 4872.53 s/m3
Solving for the specific resistance and the
compressibility coefficient of the sludge we have
from
R = = = 1.154645622 X 10¹²
m/Kg
S = = = 0.000005 m2
/KN.
V(m3
) t/v(s/m3
) V2
(m6
) V.t/v(s)
0 0 0 0
0.0717 100780.26 0.0051 7225.94
0.1034 138372.02 0.0107 14307.67
0.1283 167899.93 0.0165 21541.56
0.1505 194226.02 0.0227 29231.02
0.1709 218417.56 0.0292 37327.56
0.1805 229801.81 0.0326 41479.23
0.8053 1049497.6 0.1168 151112.98
Table 2: Data used for calculation of theoretical slope and intercept
5. Onosakponome O. R Int. Journal of Engineering Research and Applications www.ijera.com
ISSN : 2248-9622, Vol. 4, Issue 6( Version 3), June 2014, pp.43-53
www.ijera.com 47 | P a g e
The dimensional equation is of the form t/v = bv + C were b is the slope and C is the intercept.
From regression analysis,
b = =
And Intercept C = = 149928.23 – 144657.69 = 5270.54 s/m3
Fig 1: correlation between theoretical and experimental plot of t/v versus v at variable pressure
(Experimental slope =1260913.48 s/m6
, Intercept = 4872.53 s/m3
)
(Theoretical slope = 1257426.75 s/m6
, Intercept = 5270.26 s/m3
).
The graph of the correlation between experimental and theoretical slopes and intercepts used to validate the
modified equation are also displayed in Figures 2-4
Fig 2: correlation between theoretical and experimental plot of t/v versus v at variable pressure
(Experimental slope =5359604.57 s/m6
, Intercept = 844882.56 s/m3
)
(Theoretical slope = 4579418.42 s/m6
, Intercept = 905658.24 s/m3
)
6. Onosakponome O. R Int. Journal of Engineering Research and Applications www.ijera.com
ISSN : 2248-9622, Vol. 4, Issue 6( Version 3), June 2014, pp.43-53
www.ijera.com 48 | P a g e
Fig 3: correlation between theoretical and experimental plot of t/v versus v
(Experimental slope = 112117050.4 s/m6
, Intercept = -2135816.16 s/m3
(Theoretical slope = 112117075 s/m6
, Intercept = -21358166.74 s/m3
Fig 4: correlation between theoretical and experimental plot of t/v versus v
(Experimental slope = 145562880 s/m6
, Intercept = -30497917.03 s/m3
(Theoretical slope = 206699290.5 s/m6
, Intercept = -4589555.58 s/m3
)
3.1 THE EFFECT OF FERRIC CHLORIDE ON SPECIFIC RESISTANCE
The data from the filtration experiment to investigate the effect of the weight of Ferric chloride
conditioner on the specific resistance is recorded in table 3
Time t (s) Volume of filtrate (V) m3
t/v V2
V.t/v
1200 0.05118 23446.65 0.002619 1200
2400 0.05470 43875.69 0.002992 2400
3600 0.05604 64239.83 0.003140 3600
4800 0.05710 84063.05 0.003260 4800
6000 0.05720 104895.1 0.003271 6000
∑ 0.2762 320520.32 0.01528 18000
Table 3: Data for filtration experiment using 10g of Ferric Chloride
7. Onosakponome O. R Int. Journal of Engineering Research and Applications www.ijera.com
ISSN : 2248-9622, Vol. 4, Issue 6( Version 3), June 2014, pp.43-53
www.ijera.com 49 | P a g e
Volume of sludge V = 0.063m3
, Initial Hydrostatic Pressure PAV = 684.3 N/m2
, Average Hydrostatic Pressure P
= gh = 210.18N/m2
, Initial Height of sludge HS = 0.07m, Average Height of sludge (HAV) =0.014m, Temp.=
26o
c, Density of water = 996.23kg/m3
, Area (A) = 0.9 m2
, Dynamic Viscosity µ = 0.892N.s/m2
, Weight of dry
Solid Wd = 0.00941kg, Initial solid content (M) =0.149kg/m3
, Percentage of solid expressed in decimal PS =
0.09, Specific gravity of sludge Ssl = 1.05,
By regression analysis, b =
= s/m6
C = = 64104.06 – 813292.99 = 749188.94 s/m3
Solving for the specific resistance and the compressibility coefficient of the sludge we have from
R = = = 6.805632338X 10¹¹
m/Kg
S = = = 0.00118 M2
/KN
From the result, the specific resistance was determined to be 6.805632338 x 10¹¹
m/Kg.
The values of specific resistance for four other filtration experiment using 20g, 30g , 40g, and 50g of Ferric
chloride dosage yields m/kg , m/kg, 3.830709783X 10¹¹
m/kg, and 1.65123474 m/k and the variations of t/v versus v for the different weight of ferric
chloride conditioning is shown below:
Fig 5: variation of t/v versus v for 10g of Ferric Chloride Conditioner
Amount of Ferric Chloride
( g)
Specific Resistance
(m/Kg)
10g 6.805632338 X 10¹¹
20g
30g
40g 3.830709783 X 10¹¹
50g 1.65123474 X 10¹¹
Table 4: Variation of ferric chloride Dosage with Specific Resistance
8. Onosakponome O. R Int. Journal of Engineering Research and Applications www.ijera.com
ISSN : 2248-9622, Vol. 4, Issue 6( Version 3), June 2014, pp.43-53
www.ijera.com 50 | P a g e
3.2 VARIATION OF SPECIFIC RESISTANCE WITH FERRIC CHLORIDE DOSAGE
The effect of conditioning 0.063m3
of digested sludge with varying weights (10g, 20g, 30g, 40g, 50g) of
ferric chloride shows that specific resistance reduces as the weight of ferric chloride increases. This is so
because as the chemical conditioner increases, the sludge particles become more loosely held increasing the
porosity and hence reducing the resistance to fluid passage.
Fig 6: Variation of specific resistance with Ferric chloride dosage
3.3 VARIATION OF SPECIFIC RESISTANCE WITH INITIAL SOLID CONTENT
The result of the plot of specific resistance against the Initial solid content is displayed below in figure 7.
From the graph initial solid content increases with decrease in specific resistance which is in agreement with
the discovery made by coackley, (1956) in which he explained that the reduction in specific resistance with
increase of initial solid content was due to variation in the state of digestion of the sludge particles.
Fig 7: Variation of specific resistance with Initial solid content (M
3.4 VARIATION OF SPECIFIC RESISTANCE WITH PRESSURE
Figure 8 below shows the graph of specific resistance against pressure. From the graph, it can be seen that
as pressure increases, the specific resistance also increases. This is because as time elapses during filtration
more suspended solids will settles on top of the sand bed reducing the porosity of the sludge particles to the
extent that the resistance to the flow of water through the sludge particles gradually increases as the water tries
to flow through it.
Fig 8: Variation of Specific Resistance with pressure
9. Onosakponome O. R Int. Journal of Engineering Research and Applications www.ijera.com
ISSN : 2248-9622, Vol. 4, Issue 6( Version 3), June 2014, pp.43-53
www.ijera.com 51 | P a g e
3.5 DETERMINATION OF COMPESSIBILITY COEFFICIENT
The result of laboratory experiment to determine the variation of void ratio with pressure by using digested
sludge conditioned with 10g of Ferric chloride solution is shown below in table 5. The data obtained was used
to compute compressibility coefficient of the sludge and is shown in figure 9. The details of the analysis are
given thus:.
Height of ring = 6cm, Diameter of ring = 1.8cm
Area of ring (A) = πd2
/4 = 28.3cm, Specific gravity of sludge ( SSl ) = 1.05
Mass of ring + wet sludge in oven = 63.4g, Mass of dry sludge (Wd) = 20.5g
HS = = 0.68cm
Applied pressure
P N/cm2
Final Dial reading
At end of
compression (mm)
Change in Dial
Reading
∆H (mm)
Specimen height
H at end of
compression
H = H1 + ∆H
(mm)
e =
HS = 6.8(mm)
0 0.2 20 1.94
(-) 0.11
5 0.31 19.89 1.925
(-) 0.23
10 0.54 19.66 1.891
(-) 0.75
20 1.29 18.91 1.781
(-) 0.41
40 1.7 18.50 1.721
(-) 0.14
80 1.84 18.36 1.70
Table 5: Determination of Void ratio using sludge conditioned with 10g ferric chloride
Applied pressure
P (KN/m2
)
Change in Pressure
∆P (KN/m2
)
Change in
∆ e
Compressibility
Coefficient
(cm2
/KN)
Mean of
compressibility
coefficient (cm2
/KN)
5 0.015 0.003
5
5 0.034 0.007
10
10 0.11 0.011
20
20 0.06 0.003
40
40 0.02 0.0005 0.004
Table 6: Compressibility coefficient from sludge conditioned with 10g ferric chloride
The laboratory procedure as used above was also used to compute the compressibility coefficient for four
other experiments using 20g weight, 30g weight, 40g weight and 50g weight and having compressibility
coefficients of 0.005 cm2
/KN, 0.006 cm2
/KN, 0.007 cm2
/KN, and 0.005 cm2
/KN respectively.
10. Onosakponome O. R Int. Journal of Engineering Research and Applications www.ijera.com
ISSN : 2248-9622, Vol. 4, Issue 6( Version 3), June 2014, pp.43-53
www.ijera.com 52 | P a g e
Fig 9: Variation of void ration with pressure.
IV. CONCLUSION
The application of a modified FMTLXLYLZ
dimensional analysis technique to the derivation of
sludge filtration equation using sand drying bed has
been presented. The modified equation incorporates
the compressibility coefficient believed to affect
sludge dewatering phenomenon. The equation was
verified using data from the filtration experiment of
digested sludge collected from the oxidation pond of
the University of Nigeria, Nsukka and there was a
close agreement between experimental and
theoretical values with the correlation coefficient
ranging from (0.94-0.98). For the experimental plot
the slopes and intercept are (1260913.48 s/m6
,
4872.53 s/m3
) , (5359604.57 s/m6
, 844882.56 s/m3
),
(112117050.4 s/m6
, -2135816.16 s/m3
), and
(145562880 s/m6
, -30497917.03 s/m3
) while the
theoretical values of slopes and intercepts are
(1257426.75 s/m6
, 5270.26 s/m3
),( 4579418.42 s/m6
,
905658.24 s/m3
), (112117075 s/m6
, -21358166.74
s/m3
),and (206699290.5s/m6
,-4589555.58s/m3
)
respectively.;
This research has illustrated the application of a
modified FMTLXLYLZ dimensional analysis
technique in deriving filtration equation through
the use of sludge drying bed.
The equation derived, unlike many others, shows
a close agreement between experimental and
theoretical values.
It has shown the performance of the natural sand
drying bed filtration in the operation of sludge
filtration process.
It has also shown that sludge is a compressible
material and so its compressibility attributes
must be accounted for in any filtration equation
if that equation is to be accepted by the body of
researchers.
REFERENCES
[1] ADEMILUYI J O, 1986. Development in
the constant Vacuum cake filtration theory:
Proceedings of the Engineering section of
science association of Nigeria Vol. 6 & 7.
[2] ADEMILUYI J.O, and ROMANUS M, E
1990. Improving the sludge conditioning
potential of moringo seed, Environmental
management Vol. 14 No 1 PP 125-129.
[3] ADEMILUYI, J.O and ROMANUS M, E
1990. Modification of the sludge
dewaterability Number (SDN) Equation.
Proceedings presented at the 2nd
Uniben
conference on engineering and
technological Development.
[4] ADEMILUYI J.O and EGBUNIWE N,
1984. The relative effect of conditioners on
the filterability of sewage sludge, Nigerian
journal of engineering and technology, Vol.
7 No1.
[5] ADEMILUYI J.O 1990. Effect of shear,
filter medium, sludge ageing and sequence
of chemical addition on sludge
dewaterability Number (SDN) African
journal of science and technology VOL 8
No 2.
[6] ADEMILUYI, J.O, EGBUNIWE N and
AGUNWAMBA J.C 1987. A Dimensionless
number as an index of sludge
dewaterability, journal of engineering for
development vol. 1.
[7] ADEMILUYI J.O, ANAZODO U.G and
EGBUNIWE, N 1983. Filterability and
compressibility of sludge pt 11, effluent and
water treatment journal vol. 23, no 1 pp 25-
30.
[8] ANAZODO U.G 1974. Dimensional
equation for sludge filtration, effluent and
water treatment journal vol,14 n0 9 pp517-
523.
[9] CARMAN P.C 1934. A study of the
mechanism of filtration pat111. Journal of
the society of chemical industry. Transaction
and communication. Vol. 53 N0 9 PP301T-
309T
[10] CARMAN, P.C 1938. Fundamental
principle of industrial filtration;
Transaction- Institution of chemical
engineers, Vol. 16 pp 168-188.
11. Onosakponome O. R Int. Journal of Engineering Research and Applications www.ijera.com
ISSN : 2248-9622, Vol. 4, Issue 6( Version 3), June 2014, pp.43-53
www.ijera.com 53 | P a g e
[11] COACKLEY, P. and JONES, R.S,
1956.Vacuum sludge filtration. Sewage and
industrial waste journal.
[12] 12. GALE, R.S, 1975. Comment on
dimensional equation, effluent and water
treatment journal, p 422.
[13] RACE H.P, 1935. Resistance and
compressibility of filter cakes part11 user
condition of pressure filtration. Chemical
engineering process, VOL.29, NO7 July.
LISFT OF SYMBOLS
A = Cross
sectional area (m2
)
V = Volume of
filtrate m3
T = Time of
filtration (s)
H = Driving Head
of sludge (m)
∆H = Change in
sludge height
R = Specific
resistance (m/kg)
S =
Compressibility coefficient (m2
/KN)
C = Intercept on
the t/v axis (s/m3
)
b = Slope of t/v
versus v (s/m6
)
∆e = Change in
void ratio
.e = Void ratio
P1 = Initial
pressure (KN/M2
)
Wd = Weight of dry
sludge ( kg)
PS = Percent of
solid content expressed in decimal
M = Initial solid
content (kg)
Vsl = Volume of
sludge (M3
)
Ssl = Specific
gravity of sludge
Hs = Initial sludge
height (m)
FMTLXLYLZ = Modified
dimensional system