1. Rapid Analysis of Drugs, Biomarkers and
Pathogens in Urine, Saliva and Nasal Mucus
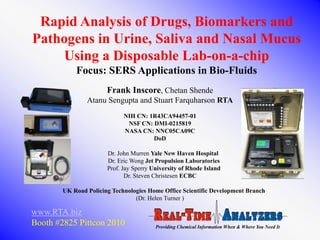
Using a Disposable Lab-on-a-chip
Focus: SERS Applications in Bio-Fluids
Frank Inscore, Chetan Shende
Atanu Sengupta and Stuart Farquharson RTA
NIH CN: 1R43CA94457-01
NSF CN: DMI-0215819
NASA CN: NNC05CA09C
DoD
Dr. John Murren Yale New Haven Hospital
Dr. Eric Wong Jet Propulsion Laboratories
Prof. Jay Sperry University of Rhode Island
Dr. Steven Christesen ECBC
UK Road Policing Technologies Home Office Scientific Development Branch
(Dr. Helen Turner )
www.RTA.biz
Booth #2825 Pittcon 2010 Providing Chemical Information When & Where You Need It
2. Challenge: Offset negative effects of weightlessness in space
Solution: Monitor indicators and associated counter-drugs in urine
Extended Weightlessness in Space Causes:
• Muscle Loss, Bone Loss
• Renal Stone Formation
•Difficulty in Sleeping, Motion Sickness
Minimize Effects with Drugs and Exercise
NASA desires a light-weight On-Board Analyzer
-that is non-invasive
-with fast response
-and has necessary sensitivity specificity selectivity
Physiological Changes Reflected in Urine Composition:
• Biomarkers (~1 mg/L)Drugs & Metabolites (~10 microg/L)
Providing Chemical Information When & Where You Need It
3. Challenge: Analysis of chemo-drugs and metabolites for dosage control
Solution: Monitor drugs and metabolites in saliva
• Chemotherapy drugs also kills non-cancer cells
• Dosage is critical (to little noneffective, to much kills patient)
• No clinical trials to establish statistical based dosage
• Current analysis requires large sample volume (10-20 ml blood and/or urine)
• These methods are labor intensive and time consuming
• Centrifugation to remove red blood cells
• Extraction using organic solvents
• Separation using chromatography
• Detection with UV or Mass Spec
• Standards are needed to ensure measurement accuracy
•Consequently, measurements made on an “as needed” basis
• Viable alternative, parent drug/ metabolites represented in saliva
• Concentration ~10-50% of blood plasma
• 1 microg/mL detection needed for chemo-drugs
• Advantage, Non-invasive (no needles)
• Issues of clotting and platelet count in blood of chemo-patients
• Advantage, Saliva is 99.5% water
• Interfering physiological chemicals 100X less
Providing Chemical Information When & Where You Need It
4. Challenge: Analysis for presence of prescription & illicit drugs of abuse
Solution: Identify drugs and metabolites in saliva
2 scenarios: ER overdoses, road-side policing of impaired drivers
Speed - Rapid diagnosis of Drugs in Saliva.
•Saliva analysis will increase speed by eliminating time consuming
extraction and separation steps.
•Rapid diagnosis for drug overdose in ER can lead to appropriate
medical care.
Specificity - Correct Identification of abused drug.
•Variety of overdose systems can lead to confusing diagnosis.
•Explicit drug detection will lead to accurate treatment regime.
Sensitivity - Low detection limit Required.
•Drugs in Saliva need to be measured at ng/mL concentrations
Providing Chemical Information When & Where You Need It
5. The Biofluid Analysis Challenge
Need non-invasive technique that meets following criteria:
• Specificity – identify Bio-agents Biomarkers Drugs Metabolites
• Uniquely, in the presence of of the biofluid matrix
• With no False Positives (or False Negatives)!
• Speed – Field Applications require rapid analysis
• 10 minutes or less
• Sensitivity – requirements to Monitor and Detect
• Drugs Metabolites ~ 100 to 10 ng/mL (100-10 ppb)
• Biomarkers ~ 1000 to 10 microg/L (1 ppm - 10 ppb)
• Bioagents ~ 10-4 to 10-2 cfu/mL and 1 ng toxin/mL
Selective detection of target analyte(s) at parts-per-billion and lower is challenging:
even under ideal conditions, more so in a complex bio-matrix!
Providing Chemical Information When & Where You Need It
6. Approach: Surface-enhanced Raman Spectroscopy
Raman, although weak effect,
provides molecular specificity
BUT, when a molecule is within
a laser induced plasmon field,
the efficiency of Raman scattering can
hν
Ag
increase by 106 i.e. 1 million times!
Sub part-per million detection becomes H N
H
N
possible.
N
H
N N H
H
Chemical contribution Plasmon Field
can provide additional 103 enhancement
Surface-Enhanced
Single Molecule Detection: requires 1012 -1014
Raman Photon
Providing Chemical Information When & Where You Need It
7. SERS-Active Substrates
benzenethiol
10-3M
10-5M
10-8M (~10 ppb)
LMC ~10-11M (~10 ppt)
Providing Chemical Information When & Where You Need It
8. Approach: RTA SERS Patented Sampling Systems
(rapid response)
2001: Simple SERS Sample Vials
Molecules Sol-Gel Matrix
Raman
in Solution
Scattering
Laser
Adsorbed
Molecules Metal Particle
silver gold
2003: SERS Microplate 2004: SERS-Active Capillary
1 10
More suited to extract and pre-concentrate
Providing Chemical Information When & Where You Need It
9. 2007: Functionalized Sol-Gel SERS Capillary
(affords greater selectivity and sensitivity)
PC
OTC unreduced reduced
Std SERS vials
2nd generation
Providing Chemical Information When & Where You Need It
10. RTA’s Portable Raman Analyzers
785 nm Vials 1064 nm
Advantages:
• No sample preparation
• Simple integration via fiber optics
• Remote analysis, multi-component
Microplates • Complete spectral coverage
• Wavelength stability
• Confident spectral subtraction
• and library search/match
• Real-time, On-demand analysis
• Long term stability
• Temperature and vibration immune 25 pounds
Capillaries • Shock resistant water tight
Lab-on-Chips
Other Wavelengths
1532, 976, 633, 532 nm
Providing Chemical Information When & Where You Need It
11. Analysis: SERS of Urine Matrix and Components
Simulated O
urea OH
H2N NH2 H
N
N
O
Lyophillized creatinine HO N
N
H
uric acid O
N
Real N NH2
OH
lactic acid OH
O
Simulated urine = 20 g/L urea, 3 g/L NaCl, 1.5 g/L KCl,
1.4 g/L creatinine, 0.2 g/L lactic acid, 0.15 g/L uric acid
•100 chemicals/biochemicals as potential interferents in urine were measured
Uric acid: dominates urine SERS!
Providing Chemical Information When & Where You Need It
12. Analysis: Biomarker and Counter-Drug
3-MethylHistidine Risedronate
NR
OH
O
N N
O HO P OH
SERS HO
NH2 P OH
N HO
O
0.125
0.03
0.105
0.025
0.085
0.02
0.065
0.045 0.015
0.025 0.01
0.005
0.005
0 200 400 600 800 1000
0 200 400 600 800 1000
Microgram/L Microgram/L
100 mw 785 nm, 1-min
Providing Chemical Information When & Where You Need It
13. Analysis: doped reconstituted urine sample - multi-targets complicated
Can we detect directly? Pre-cleanup necessary? Extract and separate?
Urine
Raloxifene (organic extract)
3-Methylhistidine (aqueous extract)
Risedronate (aqueous extract)
Scopolamine (directly on gold)
With exception of drugs like Ral or Scop, further pre-treatment necessary
LOC is ideally suited for urine analysis
Providing Chemical Information When & Where You Need It
14. Analysis: 3-Methylhistidine
OH 3-MeHis
N
unknown O
N NH2
best match
Histidine
OH
N
O
N NH2
• Unique vibrational features provide ability to identify and discriminate chemicals
•RTA spectral search soft-ware identifies unknown chemical from library data base
Providing Chemical Information When & Where You Need It
15. Analysis: parent drug and metabolite
Mixture
OH
N
N
Allopurinol
N N
H
OH
N
Oxypurinol
N
N
HO N H
•Unique vibrational features provide ability to identify and discriminate
•RTA quantification and chemometric soft-ware can define composition
Providing Chemical Information When & Where You Need It
16. Component selection: for urine sample pre-treatment
1) Filter particulates RIS 3-MeHIS
UA
2) Exclude small inorganic ions
3-MeHIS
RIS
3-MeHIS
3) Refine SG selectivity, extract and separate
Providing Chemical Information When & Where You Need It
17. Analysis: Demonstrate sub microg/L detection levels
1 microg/L (1 ng/mL) 3-MeHis Ibandronate HO P
O
OH
N
CH3
CH3
HO
P OH
HO
Alendronate O
O
NH2
HO P OH
HO
P OH
Pamidronate
HO
O
O
NH2
HO P OH
HO
P OH
HO
Clodronate O
O Cl
HO P Cl
HO
P OH
O HO
Etidronate CH3
O
Risedronate HO P OH
H-Deoxypyridinoline HO
HO
P
O
OH
OH
10 microg/L Calcium Phosphate Uric Acid N
H
N
O
Allopurinol
N
HO N H
O
O Calcium Oxalate O
O
-
Hydrochlorothiazide H 2N
S
O
S
O
Allopurinol -
O
O
-
Ca
+2 O
Cl N
H
NH
O
CaP -
O
P
O- Ca+2 O
-
Ca+2
-
O P O- NH2
O Ca+2 O
O NH2 HS
O Penicillamine H 3C
HO S
S
Cystine HO
Oxypurinol NH2
HO
H3C
H
Scopolamine O N O
O
OH
H
H3C CH3
N
N
CH3
Promethazine
S
Providing Chemical Information When & Where You Need It
19. R&D: SERS Lab-On-Chip
Different Lab-on-Chip designs used
Providing Chemical Information When & Where You Need It
20. R&D: SERS Lab-On-Chip
Analysis of real human urine sample doped with 3-
MeHis and Ris at 1 microg/L (1 ng/mL) in 10-min!
Providing Chemical Information When & Where You Need It
22. Base-line Analysis: Chemotherapy Drugs
5-Fluorouracil
NR • LMC is 100-10 ng/mL
SERS
Dacarbazine
100 µg/mL mixture
Dacarbazine
5-FU
Doxorubicin
• Incorrect dosage can be toxic or ineffective
•Complex analysis: drug mixtures and metabolites
Providing Chemical Information When & Where You Need It
23. Base-line Analysis: OTC and Prescription Drugs
H
NR Aspirin O N O
NH
SERS Amobarbital
O
O
SERS
NH
Secobarbital
O N O
H
O
HN NH Phenobarbital
O O
NR Diazepam on Ag SERS
Acetaminophen Oxycodone on Au
SERS
• Lowest Measured Concentration (LMC) is 100 - 10 ng/mL
• Overdose with Acetaminophen is common in elderly
• Barbituates are one of the most abused of prescribed drugs
Providing Chemical Information When & Where You Need It
24. Base-line Analysis: Illicit Drugs of Abuse
Cocaine NR 1.1
ROC Curve SERS Au-SG
1
0.9
0.8
Probability of Detection
0.7
0.6
0.5
0.4
0.3
SERS Ag-SG 0.2
0.1
0
0 0.1 0.2 0.3 0.4 0.5 0.6 0.7 0.8 0.9 1
Probability of False Positive
Conc. # of Mean Std Mean Std
substrates peak hgt Deviation Deviation (α)
Blank 10 0.002 0.0014 0.004
25 ppb 9 0.0113 0.006
50 ppb 10 0.0157 0.003
• LMC and Reproducibility Conc. C K value Log C at LMC at
modify SG chemistry 25 ppb 2.263 K=3.29 95 %
50 ppb 3.343 confidence
-7.31583 48 ppb
• Most ER reported overdose cases occur with cocaine
•Other drugs measured - Amphetamine, Heroine, Morphine, LSD, THC
Providing Chemical Information When & Where You Need It
25. Analysis: Single Drug in Saliva
Typical SERS Experiment
1. Mix sample with saliva
2. Suck sample into SER-active capillary
(10-sec)
3. Measure SERS of sample
(10-sec placement, 1-min scan)
Providing Chemical Information When & Where You Need It
26. Single Component Analysis: 5-FU in Saliva
50 microg/mL HCl
5-FU doped saliva pH adjusted
1 microg/mL weak acid
• Filter improved SERS-response
• Small ions can be excluded
• Weak acid improved sensitivity
Providing Chemical Information When & Where You Need It
27. Proof of Concept: Multi-component analysis in saliva
cis-platinum
A
B
Manual C
Manual A Flow
B Switch
Flow
C oxypurinol
Switch
• drugs extracted from saliva of chemotherapy patient
Providing Chemical Information When & Where You Need It
28. Non-Invasive Pathogen Detection in Nasal Mucus
Exosporium
A Outer Core G
Wall
DNA
B C Ribosomes
Inner Core H
Wall
Cortex Core
A
B
Spore Coat
Manual C
A Flow I
Manual
Flow B F Switch Internal intensity reference
Switch C - O O - digesting reagent
J
2+ O C N C O
Ca
500 800 1000 1200 1400 1600 1800
(calcium dipicolinate)
Raman Shift, cm-1
D
Dipicolinic acid
25 ppm BC spores in mucus
B.
cereus
E
cysS-Ag 250 ppm
B. subtilis
No DPA
signature! spectrum same as
before adding BS
Providing Chemical Information When & Where You Need It
29. Summary: Non-invasive Urine Saliva Analysis
• Small sample volume: < 100 microL
• Rapid & simple analysis: < 10 minutes (total)
• Specificity: detect various drugs biomarkers
• Sensitivity: at required detection in urine, but
in saliva needs improvement
• Require 1 microg/mL to 10 nanog/mL
• Future work: improve extraction efficiency
Road-side Policing with UK HOSB
LOC for Infectious Pathogens in Hospitals
Providing Chemical Information When & Where You Need It