Go for Rakhi Bazaar and Pick the Latest Bhaiya Bhabhi Rakhi.pptx
Uruguay in-focus 042012
1. Uruguay
A quarterly bulletin issued by the Debt Management Unit
in focus April 2012
S&P raises Uruguay's rating to IG REAL SECTOR generation and the inactivity of the state
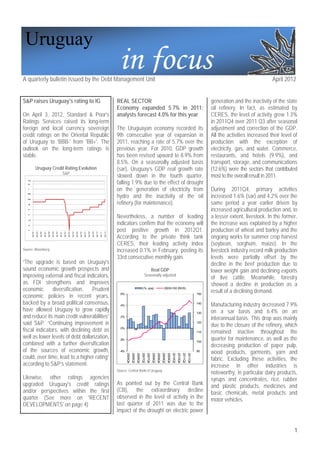
Economy expanded 5.7% in 2011; oil refinery. In fact, as estimated by
On April 3, 2012, Standard & Poor's analysts forecast 4.0% for this year CERES, the level of activity grew 1.3%
Ratings Services raised its long-term in 2011Q4 over 2011 Q3 after seasonal
foreign and local currency sovereign The Uruguayan economy recorded its adjustment and correction of the GDP.
credit ratings on the Oriental Republic 9th consecutive year of expansion in All the activities increased their level of
of Uruguay to 'BBB-' from 'BB+'. The 2011, reaching a rate of 5.7% over the production with the exception of
outlook on the long-term ratings is previous year. For 2010, GDP growth electricity, gas, and water. Commerce,
stable. has been revised upward to 8.9% from restaurants, and hotels (9.9%), and
8.5%. On a seasonally adjusted basis transport, storage, and communications
Uruguay Credit Rating Evolution (sar), Uruguay’s GDP real growth rate (12.6%) were the sectors that contributed
S&P
slowed down in the fourth quarter, most to the overall result in 2011.
falling 1.9% due to the effect of drought
AAA
AA‐
A
on the generation of electricity from During 2011Q4, primary activities
hydro and the inactivity of the oil increased 1.6% (sar) and 4.2% over the
BBB+
BBB‐
BB refinery (for maintenance). same period a year earlier driven by
B+
increased agricultural production and, to
B‐
CCC
Nevertheless, a number of leading a lesser extent, livestock. In the former,
CC
indicators confirm that the economy will the increase was explained by a higher
D
post positive growth in 2012Q1. production of wheat and barley and the
abr-94
abr-95
abr-96
abr-97
abr-98
abr-99
abr-00
abr-01
abr-02
abr-03
abr-04
abr-05
abr-06
abr-07
abr-08
abr-09
abr-10
abr-11
abr-12
According to the private think tank ongoing works for summer crop harvest
CERES, their leading activity index (soybean, sorghum, maize). In the
Source: Bloomberg increased 0.1% in February, posting its livestock industry record milk production
33rd consecutive monthly gain. levels were partially offset by the
“The upgrade is based on Uruguay's decline in the beef production due to
sound economic growth prospects and Real GDP lower weight gain and declining exports
improving external and fiscal indicators, Seasonally adjusted
of live cattle. Meanwhile, forestry
as FDI strengthens and improves showed a decline in production as a
economic diversification. Prudent (%, qoq) 2005=100 (RHS)
result of a declining demand.
economic policies in recent years, 6% 150
backed by a broad political consensus, 4%
140
Manufacturing industry decreased 7.9%
have allowed Uruguay to grow rapidly 130 on a sar basis and 6.4% on an
and reduce its main credit vulnerabilities” 2%
interannual basis. This drop was mainly
said S&P. “Continuing improvement in 120
due to the closure of the refinery, which
fiscal indicators, with declining debt as 0%
110 remained inactive throughout the
well as lower levels of debt dollarization, -2% quarter for maintenance, as well as the
combined with a further diversification 100
decreasing production of paper pulp,
of the sources of economic growth, -4% 90
wood products, garments, yarn and
2005Q4
2006Q2
2006Q4
2007Q2
2007Q4
2008Q2
2008Q4
2009Q2
2009Q4
2010Q2
2010Q4
2011Q2
2011Q4
could, over time, lead to a higher rating” fabric. Excluding these activities, the
according to S&P’s statement. increase in other industries is
Source: Central Bank of Uruguay
noteworthy, in particular dairy products,
Likewise, other ratings agencies syrups and concentrates, rice, rubber
upgraded Uruguay's credit ratings As pointed out by the Central Bank and plastic products, medicines and
and/or perspectives within the first (CB), the extraordinary decline basic chemicals, metal products and
quarter (See more on 'RECENT observed in the level of activity in the motor vehicles.
DEVELOPMENTS' on page 4) last quarter of 2011 was due to the
impact of the drought on electric power
1
2. Electricity, gas and water registered a durable goods and automobiles and to the index after five months of
decrease of 41.4% (sar) in 2011Q4 and a lesser extent, increase in Public consecutive falls.
fell 14.4% compared with the same consumption.
period of 2010. During the fourth Upon learning the official growth
quarter, electric power was generated Gross fixed capital formation decreased numbers, private analysts revised their
by hydro and thermal, leading the latter by 1.3% (yoy) due to lower public sector estimations for real growth in 2012 to
to a decline as the value added per unit investment and the completion of UTE 4.0% from 4.5%, according to the
of production is much lower. constructions. This decline in public monthly survey published by the CB.
investment could not be offset by the These projections are in line with the
The construction sector posted a increase in real estate from the private official goal.
decrease of 0.2% (sar) but increased sector.
6.9% on an interannual basis. The EXTERNAL SECTOR
growing level of activity during 2011 Exports of goods and services raised Current account balance closed 2011
continued the positive trend seen 6.7% due to an increase, among others with a deficit of 1.8% of GDP
previously, particularly in private goods, of meat, rice, milk, syrup, pulp,
construction. Meanwhile, public rubber and plastic products, and According to preliminary estimates of
construction recorded decreasing levels vehicles. Within exports of services, the the CB, during 2011 the current account
of activity by most state agencies. increasing number of tourists as well as of the balance of payments registered a
the growing expenditure per capita in deficit of USD 875million, equivalent to
Commerce, Restaurants, and Hotels terms of physical volume stands out. 1.8% of GDP. Concomitantly, there was
recorded an increase of 1.1% (sar) and a strong inflow of capital, equivalent to
9.0% (yoy), while Transport, Storage, Imports of goods and services fell 0.6% 7% of GDP, enough to finance the
and Communications grew 0.2% (sar) on-year, due to lower foreign purchases current account deficit and accumulate
and 9.3% on an interannual basis. The of capital goods and intermediate reserves for USD 2.6billion (5.2% of
high rates of growth in data services goods, which were partially offset by GDP).
and mobile telephony, passenger and increased purchases of consumer
freight services and travel agencies are goods and tourist services. Current Account, Exports and Imports
Million of USD
notable.
Unemployment and Employment Rate
% of Economically Active Population
Current Account (LHS) Exports (RHS) Imports (RHS)
On the expenditure side, the increase in 14.000
the level of activity was explained by the
1600
Employment Rate (RHS) 1300
growth of domestic demand, which Average Unemployment Rate YTD (LHS)
Unemployment Rate (LHS)
1000
700
12.000
recorded a rise in the final consumption 11 63
400 10.000
expenditure, partly offset by the decline
100
10 8.000
-200
in gross capital formation. 9
61 -500
-800 6.000
-1100
8
Contribution to GDP Growth by Expenditure 59 -1400
-1700
4.000
On a quarterly basis 7
-2000 2.000
2005Q1
2005Q4
2006Q3
2007Q2
2008Q1
2008Q4
2009Q3
2010Q2
2011Q1
2011Q4
6
57
5
11%
9%
4 55 Source: Central Bank of Uruguay
nov-08
ene-09
mar-09
may-09
jul-09
sep-09
nov-09
ene-10
mar-10
may-10
jul-10
sep-10
nov-10
ene-11
mar-11
may-11
jul-11
sep-11
nov-11
ene-12
7%
The largest current account deficit is
Source: National Institute of Statistics.
5%
due to deterioration in the trade
3%
balance, while the balance of income
1%
The labor market also reflected the and transfers remained at similar levels
-1% positive economic climate in the to 2010. The performance on trade
balance, in turn, is explained by the
2007Q2
2007Q3
2007Q4
2008Q1
2008Q2
2008Q3
2008Q4
2009Q1
2009Q2
2009Q3
2009Q4
2010Q1
2010Q2
2010Q3
2010Q4
2011Q1
2011Q2
2011Q3
2011Q4
Uruguayan economy. The unemployment
Private Consumption Gov. Consumption Gross Private Investment
rate was 6.0% in February, after goods performance, not completely
offset by better results in the services.
Net Exports Gross Public Investment GDP Growth
tumbling to a record 5.3% in December.
Source: Central Bank of Uruguay In 2011 the average jobless rate was
6.0% which compares positively to the Imports’ growth in physical volume
The increase in final consumption 6.7% of one year before. Private started to slow in the first three quarters
expenditure (5.4% yoy) was due analysts foresee an increase of 1.0% in of 2011 and finally fell in the last. In this
primarily to the increase in Private final labor force for 2012. As well, CERES’s trend, energy imports, which had a
consumption (5.7%), mainly in the Index of Labour Demand (ICDL) grew significant share after the strong growth
growth of consumer durables and not by 1.4% in March, the first increase of in 2011Q1 to meet the demand for
2
3. power generation, fell in the second recorded a net outflow exceeding USD Public Sector Balance and Interest
% of GDP
quarter and had a significant drop in the 1.8billion, in 2011 there was a net
two remaining quarters. Exports of income of nearly USD 360million. Primary Balance Overall Balance
goods, meanwhile, showed a significant In 2011, international reserves of the 6%
growth (18.6%), although at a slower CB increased by US$ 2.56 billion,
5%
4%
pace than imports. Most of the growth thereby accumulating a total stock of 3%
of the export value resulted from higher over US$ 10 billion. This increase is 2%
prices, which have increased to a rate explained largely by the increase in 1%
close to 17% in the last four quarters. In deposits of the banking system in the 0%
physical volume, the evolution of CB and in the government accounts. -1%
exports has been more humble, barely This represents an important change to
-2%
-3%
exceeding 1.6% for the entire year. the situation observed in 2010, when
2004Q4
2005Q2
2005Q4
2006Q2
2006Q4
2007Q2
2007Q4
2008Q2
2008Q4
2009Q2
2009Q4
2010Q2
2010Q4
2011Q2
2011Q4
there was a decline in reserve assets of
Total exports continued showing a US$ 361 million and the total stock was Source: Ministry of Economy and Finance
growth trend during the first quarter of below the US$ 8.0 billion.
2012. In that sense, data available on The interest bill stood at 2.8% of GDP,
goods exports orders shows that in External Reserve Assets falling 0.2% compared to the rolling
Million of USD
2012Q1 external sales increased 18.2% year to January. This is because the
compared to the same period of the 12.000 figure of February 2011, which was
previous year, according to think tank 10.500 extraordinarily high, no longer accounts
Uruguay XXI. 9.000
in the annual registration. At that time,
due to the debt swap operation between
While in 2010 the balance of the Capital 7.500
the Central Bank and the Government,
and Financial Account showed a 6.000
there was an advance payment of
positive flow of just USD 86million, in 4.500
interest accrued to the date of the
2011 the net capital inflow was USD 3.000 transaction (Debt Report January 2011).
3.4billion. Flows to the private sector 1.500
largely exceeded the net outflow of USD 0 Private analysts foresee a public global
167million recorded in the public sector. deficit of 1.2% and 1.1% of GDP for
2012 and 2013 respectively.
Capital, Current Account and FDI Source: Central Bank of Uruguay
Million of USD PUBLIC DEBT
PUBLIC SECTOR Net Debt fell 3.9% of GDP in 2011
Global deficit at 1.3% of GDP
Capital Account Current Account FDI
5.000
4.000
Overall consolidated indebtedness of
The consolidated fiscal deficit for the the public sector amounted to the
equivalent of USD 25.9bn at the end of
3.000
year ended in February 2012 was
2.000
equivalent to 1.3% of GDP. 2011 (55.5% of GDP).
1.000
Public Sector Gross Debt
0
Income of the Non-financial Public % of GDP and Million USD
-1.000 Sector stood at 29.1% of GDP in the
-2.000 twelve months ending in February, an 100%
Gross Public Debt Net Public Debt
2005Q1
2005Q4
2006Q3
2007Q2
2008Q1
2008Q4
2009Q3
2010Q2
2011Q1
2011Q4
increase of 0.2% of GDP over January 90%
2012 due to an increasing collection of 80%
BPS and an improved primary result of 70%
Source: Central Bank of Uruguay
public enterprises (mainly Antel). 60%
50%
A considerable part of these financial Current primary expenditure from 40%
movements corresponded to Foreign Central Government and BPS stood at 30%
Direct Investment (FDI) inflows, 24.6% of GDP, remaining constant over 20%
estimated at USD 2.5billion (close to
2005Q1
2005Q4
2006Q3
2007Q2
2008Q1
2008Q4
2009Q3
2010Q2
2011Q1
2011Q4
the rolling year to January 2012.
5% of GDP), at levels similar to those Regarding investment, there was an
recorded in 2010. The higher capital increase of 0.5% of GDP mainly due to Source: Central Bank of Uruguay
inflows can be explained mainly by the variation in stocks of oil and derivatives
performance of the financial system, The consolidated net public debt totaled
from ANCAP (0.4% of GDP) and an USD 12.7bn, equivalent to 27.2% of
both public and private. While in 2010 increase of fixed investment (0.1% of
the financial system as a whole GDP. Measured in terms of GDP, the
GDP). total net debt decreased 3.9% last year.
3