Shapoorji Pallonji Joyville Vista Pune | Spend Your Family Time Together
DTZ Foresight Asia Pacific Fair Value Report (Q1 2011)
1. DTZ Foresight
Asia Pacific Fair Value Q1 2011
Increasing opportunities
1
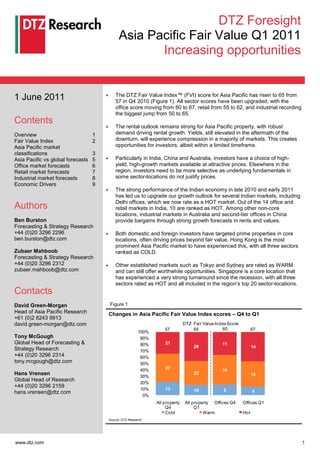
The DTZ Fair Value Index™ (FVI) score for Asia Pacific has risen to 65 from
1 June 2011 57 in Q4 2010 (Figure 1). All sector scores have been upgraded, with the
office score moving from 60 to 67, retail from 55 to 62, and industrial recording
the biggest jump from 50 to 65.
Contents
The rental outlook remains strong for Asia Pacific property, with robust
Overview 1 demand driving rental growth. Yields, still elevated in the aftermath of the
Fair Value Index 2 downturn, will experience compression in a majority of markets. This creates
Asia Pacific market opportunities for investors, albeit within a limited timeframe.
classifications 3
Asia Pacific vs global forecasts 5 Particularly in India, China and Australia, investors have a choice of high-
Office market forecasts 6 yield, high-growth markets available at attractive prices. Elsewhere in the
Retail market forecasts 7 region, investors need to be more selective as underlying fundamentals in
Industrial market forecasts 8 some sector-locations do not justify prices.
Economic Drivers 9
The strong performance of the Indian economy in late 2010 and early 2011
has led us to upgrade our growth outlook for several Indian markets, including
Delhi offices, which we now rate as a HOT market. Out of the 14 office and
Authors retail markets in India, 10 are ranked as HOT. Among other non-core
locations, industrial markets in Australia and second-tier offices in China
Ben Burston provide bargains through strong growth forecasts in rents and values.
Forecasting & Strategy Research
+44 (0)20 3296 2296 Both domestic and foreign investors have targeted prime properties in core
ben.burston@dtz.com locations, often driving prices beyond fair value. Hong Kong is the most
prominent Asia Pacific market to have experienced this, with all three sectors
Zubaer Mahboob ranked as COLD.
Forecasting & Strategy Research
+44 (0)20 3296 2312 Other established markets such as Tokyo and Sydney are rated as WARM
zubaer.mahboob@dtz.com and can still offer worthwhile opportunities. Singapore is a core location that
has experienced a very strong turnaround since the recession, with all three
sectors rated as HOT and all included in the region’s top 20 sector-locations.
Contacts
David Green-Morgan Figure 1
Head of Asia Pacific Research Changes in Asia Pacific Fair Value Index scores – Q4 to Q1
+61 (0)2 8243 9913
david.green-morgan@dtz.com DTZ Fair Value Index Score
57 65 60 67
100%
Tony McGough 90%
Global Head of Forecasting & 80% 21 11
28 14
Strategy Research 70%
+44 (0)20 3296 2314 60%
tony.mcgough@dtz.com 50%
40% 27 14
Hans Vrensen 23 12
30%
Global Head of Research
20%
+44 (0)20 3296 2159
10% 13 10 5
hans.vrensen@dtz.com 4
0%
All property All property Offices Q4 Offices Q1
Q4 Q1
Cold Warm Hot
Source: DTZ Research
www.dtz.com 1
2. Fair Value Index
Asia Pacific Fair Value Index score sits at 65 in Q1 Our Fair Value analysis for Q1 2011 concludes that
2011 there are currently 28 HOT markets, up from 21 in
Q4 2010, while the number of COLD markets has
TM
The DTZ Fair Value Index score for Asia Pacific fallen from 13 to 10 (Table 2).
stands at 65, reflecting broadly attractive investment
conditions across the region (Table 1). Table 2
Asia Pacific (APAC) market classifications Q1 2011
Table 1
Change
Asia Pacific Fair Value Index scores Q1 2011 HOT Change COLD
since
markets since Q4 markets
Q1 2011 Q4 2010 Q4
APAC all-
Asia Pacific all-property 65 57 28 ▲ 10 ▼
property
Asia Pacific office 67 60
APAC office 14 ▲ 4 ▼
Asia Pacific retail 62 55
Australia all-
Asia Pacific industrial 65 50 7 ▲ 1 ▼
property
Global all-property 50 53 China all-
7 - 2 -
Global office 45 47 property
Global retail 56 60 India all-property 10 ▲ 1 -
Global industrial 53 53 Other APAC all-
4 ▲ 6 ▼
Source: DTZ Research
property
Source: DTZ Research
All sector scores have been upgraded this quarter,
led by the industrial sector from 50 to 65, where As the index scores indicate, we retain the view that
upwards revisions to rental growth forecasts and a investors in the region taking a medium to long term
fall in bond yields has improved the fair value view can access several high yielding and high
classification of several Australian markets. growth markets at a discount relative to pricing
elsewhere. This is reflected in the favourable findings
The Asia Pacific region continues to compare for China, India and Australia.
favourably with the other global regions, with
investors set to benefit from stronger rental growth There are, however, several COLD markets where
associated with a more positive economic backdrop we consider that pricing has moved out of line with
than in the United States or Europe. underlying fundamentals, so investors need to be
selective with their approach.
Box 1: Guide to the DTZ Fair Value Index™
The DTZ Fair Value Index™ is intended to provide investors with insight into the relative
attractiveness of current pricing in global commercial property markets. Fair Value Index
scores reflect the proportion of HOT and COLD markets, with higher scores implying Index Pages 2-3
more HOT markets.
Markets are categorised by comparing expected and required returns. Markets Fair Value
estimated to be more than 5% under-priced are classified HOT; markets more than Page 4
Classifications
5% over-priced are classified as COLD; and, markets between this range are
classified as WARM. Property Forecasts Pages 5-8
The DTZ Fair Value Index™ is a forward-looking index based on econometric
forecasts incorporating local economic drivers and local market Economic Forecasts Page 9
knowledge.
For further information on the methodology used for classifying different markets and calculating Fair Value Index scores, see the
TM
DTZ Research report: DTZ Fair Value Index Methodology: Solid Foundations for Future Returns.
www.dtz.com 2
3. Asia Pacific Market Classifications
Figure 2 Global divergence widens in Q1
Regional Fair Value Index scores: Q1 2011
The increase in the Asia Pacific score has widened
DTZ Fair Value Index Score the divergence in global scores (Figure 2). While the
50 32 65 74 28 Asia Pacific score for Q1 has increased, the index
100% 1
10
scores globally and for each region have fallen this
60
80% 28 quarter. In Europe, the lower score reflects a rise in
9
43 22 government bond yields which is raising required
60% returns, while in the United States cap rates are now
74 falling from historically high levels as the market
40%
23 continues its lagged recovery from the downturn.
46 8 10
20%
61 Across the world, investors are targeting prime
10 5
0% property in core locations, driving yield compression
Global Europe Asia US UK and dampening the outlook for expected returns in
Pacific coming years. While prominent Asian markets such
Cold Warm Hot
as Hong Kong have experienced this, many non-core
Source: DTZ Research
Asian markets continue to trade at much higher
yields, resulting in a more attractive investment
Figure 3 environment for the region overall across all sectors
Asia Pacific index scores by sector: Q1 2011 (Figure 3). There are, however, pressures building in
China (Box 1).
DTZ Fair Value Index Score
65 67 62 65
100%
90%
80%
Box 1: Prices rising as yields harden in China
28 14 9 5
70%
60% In response to the global recession, the Chinese authorities
50% implemented significant monetary stimulus to help cushion the
40% 8
impact of the downturn. Since then, however, they have been
23 12 3 slow to withdraw this support, resulting in strong money supply
30%
20% growth and inflationary pressures.
10% 10 4 4 2
0% This excess liquidity is leading to asset price appreciation,
All property Offices Retail Industrial including in property which is seeing lower yields as investors
Cold Warm Hot
compete for prime stock (Figure 4). While we had seen some
evidence of this during 2010, the downward pressure on yields
Source: DTZ Research has become more apparent in Q1 2011, with prime office yields
in Guangzhou, Chengdu and Shenzhen dropping to historic
Figure 4 lows.
Yield hardening in Chinese office markets In response to these economy-wide pressures, the authorities
have continually raised bank reserve ratio requirements in an
9% attempt to slow money supply and lending growth and dampen
inflationary pressures. However, given the extent of the excess
8% liquidity in the Chinese financial system, it will take some time to
rein in inflation and the pace of growth may moderate as policy
7% tightens.
6% While these markets remain broadly attractive in terms of their
fair value classifications owing to strong rental growth,
5%
continued yield compression would reduce expected returns by
lowering income and capital growth prospects, and could cause
us to downgrade our classifications.
4%
Dec-09 Mar-10 Jun-10 Sep-10 Dec-10 Mar-11
Shanghai Guangzhou
Chengdu Shenzhen
Source: DTZ Research
www.dtz.com 3
4. Asia Pacific Market Classifications
Several upgrades due to a firmer rental growth Figure 5
outlook
Selected changes in rating – Q4 2010 to Q1 2011
The rise in the Asia Pacific index score in Q1 is the Q1 2011
COLD WARM HOT
result of the net balance of 12 changes in market Q4 2010
classifications, with 11 of these being upgrades, eight Taipei office Sydney retail
from WARM to HOT and three from COLD to WARM COLD Kuala Lumpur office Brisbane retail
(Figure 5 and Table 3). Kolkata retail Seoul offices
Bangkok retail
Three Australian industrial markets have been Bangkok office
Perth offices
WARM Perth retail
upgraded from WARM to HOT. This is due to higher Sydney industrial
Mumbai office
forecast rental growth associated with a buoyant Delhi offices
business investment outlook in 2012. In addition to
Bangalore retail
this, a moderation in inflation has dampened market HOT Guangzhou retail Melbourne office
expectations for further interest rate hikes, with the Singapore industrial
government bond yield consequently falling during
the quarter. Source: DTZ Research
The strong performance of the Indian economy in Table 3
late 2010 and early 2011 has led us to upgrade our Ranking of biggest movers to Q1: change from Q4
growth outlook for several Indian markets, including
Delhi offices, which we now rate as a HOT market. More attractive Less attractive
Guangzhou retail the only downgrade Brisbane retail Shanghai offices
Seoul offices Hong Kong offices
As highlighted in Box 2, property prices in several
Chinese markets have moved upwards in recent Auckland offices Guangzhou retail
quarters. In the Guangzhou retail market, yields have Gold Coast industrial Taipei industrial
come in to a historic low of 5.8%, down from 6.4% in Auckland retail Hong Kong industrial
Q4. In addition to reduced income flow, we expect
Table 4
that this will also dampen capital growth, with yields
expected to edge slightly higher in Guangzhou over Asia Pacific major market classifications Q1 2011
the next five years. Degree of over-
Sector Market Category valuation (negative
Several core markets still offer good value indicates under-priced)
Bengaluru HOT -24%
As indicated by Table 4, there are many prominent
markets in Asia offering attractive returns to investors, Singapore HOT -17%
Office
with opportunities across all sectors. Markets Shanghai HOT -6%
Tokyo WARM -5%
Bengaluru, Mumbai and Singapore are expected to
Hong Kong COLD +23%
experience an upswing in rents in coming years.
Bengaluru is still in the early stages of its growth into Mumbai HOT -12%
a major IT and business hub, Mumbai is a rapidly Singapore HOT -8%
developing financial centre and Singapore is Retail
Markets Beijing WARM -4%
benefiting from a strong recovery after large falls in
rents amidst the global downturn. Sydney WARM 3%
Shanghai COLD 15%
Upgrades to rental growth forecasts have improved
Singapore HOT -16%
our fair value assessments for Australian markets,
while Hong Kong and Taipei remain COLD. Sydney HOT -8%
Industrial
Markets Melbourne HOT -7%
Hong Kong COLD 36%
Taipei COLD 37%
Source: DTZ Research
www.dtz.com 4
5. Asia Pacific vs. Global Forecasts
Figure 6 Rental growth forecasts upgraded in Asia Pacific
Asia Pacific vs global all-property rental growth Asia Pacific all-property rental growth outperformed
25% global rental growth in 2010, resuming the normal
20% pattern of inter-regional growth after two years of
15% underperformance in 2008-09. Across the region,
rental growth averaged 6.7% compared to 2.6%
10%
globally.
5%
0% Over the forecast period, Asia Pacific rents will
-5% continue to beat the global rate of growth (Figure 6).
-10%
Average rental growth during 2011-15 is estimated to
be 3.7% p.a. while global all-property rental growth is
-15%
forecast to be 2.4% p.a. over the same period. Both
2006
2007
2008
2009
2010
2011
2013
2014
2015
2012
figures have been upgraded from the previous round.
Overall, rental growth going forward is expected to be
Asia Pacific Global less volatile (and also somewhat weaker) than it was
during the pre-recession boom.
Source: DTZ Research
Capital growth opportunities frontloaded in 2011
Figure 7
Asia Pacific vs global all-property capital growth Asia Pacific capital values also recovered strongly in
2010, growing by 15.1% (Figure 7). This is more than
40% double the growth rate of 7.4% recorded for global
property. Further value increase of 8.2% is expected
30%
in 2011. However, beyond this year, overall capital
20% growth becomes increasingly limited. The main
impact comes from a handful of high-value markets.
10% For example, Hong Kong office and retail (both
0% among the region’s priciest markets) are trading at
historically low yields at the moment. As interest
-10% rates move higher, we expect yields in these markets
to normalise in the medium term. This will in turn
-20%
affect the headline figure for region-wide capital
2006
2007
2008
2009
2010
2011
2012
2013
2014
2015
growth.
Asia Pacific Global
Average capital value growth during 2011-15 is
Source: DTZ Research forecast to be 3.3% p.a., compared to 2.5% p.a.
globally. However, as mentioned, the growth is front-
Figure 8 loaded, with barely 2% annual growth forecast for the
Asia Pacific vs global all-property total returns years 2012-15. Capital increases will be most
pronounced in the office sector while growth will be
50%
weakest in the industrial sector.
40%
30%
Asia Pacific returns comparable to global returns
20% We forecast stable positive returns in the Asia Pacific
10% region, broadly similar to the returns available from
global property. Over the period, Asia Pacific total
0%
returns at 9% p.a. just edges out global returns at
-10% 8.8% p.a. (Figure 8). Market fundamentals are
-20% expected to be more important in determining returns
than the re-emergence of a “wall of money”. The
2006
2007
2008
2009
2010
2011
2013
2014
2015
2012
office sector will once again deliver the strongest
returns at around 10.2% p.a., followed by retail (8.5%
Asia Pacific Global p.a.) and industrial (7.8% p.a.).
Source: DTZ Research
www.dtz.com 5
6. Office Market Forecasts
Rising demand drives strong office rental growth Figure 9
Prime office rental growth 2011-15: best and worst
The office occupier market is expected to maintain its
strong upward momentum in 2011. Following two %
12
successive years of declines, overall office rents 10
experienced a robust recovery in 2010 with 9.2%
8
rental growth. A number of markets have seen further
gains in the first quarter, and overall rental growth in 6
2011 is expected to be around 7%. However, 4
developers are responding to booming demand, and 2
future supply levels are likely to be nearly as high as
0
the pre-recession peaks seen during 2007-08. This
will exert a restraining influence on rental growth in -2
the latter half of the forecast period.
Our top three rental markets over the period are
Bengaluru, Singapore and Beijing (Figure 9). In Annual average, 2011-15
keeping with recent forecasts, Indian and Chinese Source: DTZ Research
cities account for a large number of the region’s
growth markets. For instance, in Shanghai and Delhi, Figure 10
take-up grew by 67% and 107% respectively in 2010,
and demand is expected to double again by 2014. Prime office yield forecasts: selected markets
Among the established markets, Singapore and %
Hong Kong have emerged resurgent from the 12
recession. Competition for space in prime districts 10
has led to rapidly rising rents in other submarkets,
e.g. a 10% jump in Hong Kong Island East rents in 8
Q1. Given enduring space constraints, strong upward
6
pressure on rents will continue. However, rental
prospects remain poor in Tokyo, with rental growth of 4
just 1.1% p.a. forecast over the period.
2
Yield compression leads to higher emerging market 0
returns 2006 2007 2008 2009 2010 2011 2012 2013 2014 2015
There is a clear distinction between prime yield Beijing Bengaluru Chennai
trends in the more developed markets in the region Hong Kong Singapore Taipei
and the developing markets. Current yields in Hong Source: DTZ Research
Kong, Singapore and Taipei are exceptionally low,
but this situation is expected to gradually correct itself Figure 11
as global interest rates normalize in the medium term. Prime office total returns 2011-15: best and worst
Chinese and Indian yields are significantly higher in
%
contrast but as their markets become more mature, 25
with their strong underlying fundamentals, we expect 20
yields to decline (Figure 10).
15
Overall office returns in 2011 are forecast to be 10
17.1%, following on from 19.7% returns in 2010 5
(Figure 11). The top three markets over the forecast 0
period in terms of returns are Bengaluru, Beijing and
-5
Chennai, with Indian markets delivering on average
16% returns p.a. through 2015. In part this reflects
higher risk premium for India, but even mature
markets such as Sydney and Melbourne are
expected to generate double digit returns on the back Income Returns Capital Growth Total Returns
of sustained rental growth and yield compression.
Source: DTZ Research
www.dtz.com 6
7. Retail Market Forecasts
Figure 12 Indian cities dominate retail rental rankings
Prime retail rental growth 2011-15: best and worst
Prime retail rents increased by 5.9% in Asia Pacific in
% 2010, and the outlook remains positive over the
10
9 forecast period. Economic growth is driving
8 employment and wage gains, while rising asset
7 prices provide a further boost to household wealth.
6 Consumer spending is forecast to grow by 4-5% p.a.
5 in South East Asia in the medium term, while the
4
3
figure is double that in India and China. The
2 emergence of a mass middle class (estimated to be
1 300 million strong in China alone) is the engine of the
0 formal retail sector in the latter countries.
India takes six of the top seven spots in the rental
tables, led by Bengaluru with growth of 9.2% p.a.
Annual average, 2011-15 during 2011-15 (Figure 12). The sole non-Indian
market is Chengdu, recording 6.4% average growth.
Source: DTZ Research
The supply of prime retail stock in Indian cities,
Figure 13
although rising steadily, is lagging behind demand.
New shopping centres continue to redefine the prime
Prime retail yield forecasts: selected markets market upwards. Thus rents in Bengaluru jumped by
%
10% in Q1, and in Hyderabad by 5.5%. At the other
12 end, Auckland and Bangkok are among the most
sluggish retail markets in the region.
10
8 Divergent yield trends
6 As with offices, retail yields show diverging trends
4
between developed and developing markets. Hong
Kong is the most expensive retail market in Asia, with
2 yields falling as low as 2% (Figure 13). This is an
unsustainable level, driven largely by short-term
-
trading by private money. Over the period, we expect
2006 2007 2008 2009 2010 2011 2012 2013 2014 2015 that yields will move out again in Hong Kong (and to
Bengaluru Chennai Delhi a lesser extent in Shanghai and Melbourne).
Hong Kong Melbourne Shanghai Regional interest rates are heading upwards, putting
Source: DTZ Research pressure on property yields. On the other hand,
Indian retail yields are fairly high but heading
Figure 14 downwards. Most Indian retail markets trade between
9-11% at the moment. With strong rental growth
Prime retail total returns 2011-15: best and worst
prospects and greater market maturity and liquidity,
% we expect retail yields to fall to 8-9% by 2015.
25
20
Hong Kong overpriced, negative returns forecast
15
10 Indian markets dominate the returns tables with their
5 combination of high income yields, forecast capital
0 growth, and rental growth (Figure 14). Average
-5 returns in Indian retail are expected to be about
17.8% p.a. compared to 8.5% p.a. for overall Asia
-10
Pacific retail. At the other end of the table, poor
prospects for capital appreciation will hold back
returns. In the case of Hong Kong, we expect capital
declines of -7.6% p.a. during the forecast period, with
Income Returns Capital Growth Total Returns the main impact concentrated in 2012-13. Forecast
Source: DTZ Research returns in Hong Kong is therefore negative at -5% p.a.
www.dtz.com 7
8. Industrial Market Forecasts
Rental prospects strongest in Singapore, Australia Figure 15
Prime industrial rental growth 2011-15: best & worst
With the global economy in recovery, prospects for
Asia Pacific industrial are better than they have been %
in some time. The US, the region’s biggest trade 4
partner, is expected to post strong growth over the
3
next couple of years, and intra-regional trade ties are
also more robust. The long-range forecast for export
2
growth in traditional trading powerhouses like Taiwan,
Singapore and South Korea lies between 7-9%,
1
although during the recent recovery, growth rates
have been much higher, between 15% and 25%.
0
Singapore, a key hub in the regional trading network,
is expected to record the best rental performance
over the forecast period, at 3.6% p.a. (Figure 15).
The key Australian ports of Brisbane and Melbourne Annual average, 2011-15
are also expected to outperform, with average rental
Source: DTZ Research
growth over 3% p.a. Growth in Australia, partly driven
by demand for its commodities, is on an upward Figure 16
trajectory. The weakest performer among our
forecast markets is Hong Kong. Industrial demand is Prime industrial yield forecasts: selected markets
being undercut by cheaper locations in the Pearl %
River Delta (e.g. Shenzhen, Guangzhou) while 10
scarcity of land is resulting in higher value usage 9
replacing industrial space. Overall, the Hong Kong 8
7
rental growth trend is flat.
6
5
Mixed prospects for yields 4
3
Australian industrial yields are expected to decline 2
gradually over the next five years, with compression 1
0
of 50-75 bps in most markets (Figure 16). Yields are
still elevated in the aftermath of the recession-driven 2006 2007 2008 2009 2010 2011 2012 2013 2014 2015
correction. In contrast, Hong Kong and Taipei Brisbane Hong Kong Melbourne
industrial yields have reached historically low levels Shanghai Sydney Taipei
and are expected to move out again over the period.
Source: DTZ Research
Fundamentals in Taipei are robust, but pricing in
Hong Kong lacks support from the occupier market. Figure 17
Australian markets lead the total returns tables Prime industrial total returns 2011-15: best & worst
%
16
Overall total returns are expected to average 7.8% 14
p.a. over the next five years. The Australian markets 12
10
take all the top places, led by Brisbane with annual 8
returns of 13.5% (Figure 17). Returns are driven 6
primarily by high income returns, supported by 4
steady rental gains. Singapore also delivers double 2
-
digit returns, while Hong Kong and Taipei are among -2
the region’s underperformers. Income returns are -4
weak thanks to elevated prices; moreover, softening -6
yields will result in net capital declines in both
markets over the forecast period. Returns in Hong
Kong are forecast to be 1.8% p.a., and 1.1% p.a. in
Taipei. Income Returns Capital Growth Total Returns
Source: DTZ Research
www.dtz.com 8
9. Economic Drivers
Figure 18 Risk factors to growth are increasing
Asia Pacific GDP growth forecasts
Asia Pacific output grew by 6.8% in 2010, the fastest
% rate of GDP growth in more than two decades. This
20
provides solid evidence of the region’s healthy
15 recovery from the financial crisis. Going forward,
growth prospects remain solid but there are a
10 number of risks, including commodity price spikes,
political unrest and natural disasters. The region is
5
expected to record average growth of 5.2% p.a. over
0 the next five years, well ahead of the US (3.2%) and
Europe (2.2%).
-5
The strongest growth is forecast in the emerging
-10 giants China and India, at an annual average of 8.7%
China India Singapore Korea Australia Japan and 8.4% respectively (Figure 18). Elsewhere, the
recovery is maintaining its momentum and even
2009 2010 2011 2012 2013
accelerating in key exporting nations such as
Source: Oxford Economics Australia and South Korea. Both will experience
significantly stronger growth in 2012 on the back of a
Figure 19 global recovery in full swing. The key concern is
Asia Pacific consumption growth forecasts Japan, where the natural disasters of March have
combined to wipe out any prospect of economic
%
10 growth this year. However, the consensus view is
9 that the impact of the disasters on Japan’s medium
8 term growth prospects will be limited.
7
6 Consumption and exports show strong recovery
5
4 The consumer outlook remains strong across Asia
3
2
Pacific. Unemployment in Australia, Taiwan and
1 Korea is headed back to cyclical lows, while wage
0 growth in China is running at double digits. Spending
is expected to be strongest in China and India,
growing at an annual rate of 8-10% (Figure 19). The
vast expansion of the middle class in both countries
2011-15 will continue to support retail sales. Consumption in
Source: Oxford Economics
the other major economies is forecast to grow at a
more moderate pace of 3.5%-4.5%, with the rapidly
Figure 20 aging economy of Japan a significant exception.
Asia Pacific inflation forecasts Another key driver of regional growth is exports.
These too experienced a sharp V-shaped rebound in
%
7 2010, growing at an average rate of 25% in China,
6 Japan and Taiwan. However, export growth is
5 expected to fall back to more sustainable levels.
4
Inflation worries persist across region
3
2
1
The key worry for many policymakers is inflation.
0 This is being fuelled by commodity prices as well as
-1 capacity constraints. The Chinese government in
-2 particular has made inflation fighting a top priority,
2006 2007 2008 2009 2010 2011 2012 2013 using a mix of higher interest rates, higher reserve
ratios and price controls. Nonetheless, inflation will
climb higher in both China and the region in 2011
Asia Pacific China Korea
Singapore Taiwan (Figure 20). Although consensus forecasts predict a
fall thereafter, significant uncertainty remains with
Source: Oxford Economics respect to the inflation outlook.
www.dtz.com 9