9. chapter 4
•Télécharger en tant que DOCX, PDF•
0 j'aime•597 vues

The document reports on testing of modulus of elasticity, modulus of rupture, internal bonding, thickness swelling, and water absorption for particleboard with variations in resin content (7%, 9%, 11%) and particle size (1.0mm, 2.0mm). ANOVA analysis found significant differences between resin contents for all properties tested, but only found significant differences between particle sizes for internal bonding, thickness swelling, and water absorption. Particle size and resin content both affected internal bonding and thickness swelling.

Recommandé
Recommandé
Contenu connexe
En vedette
En vedette (20)
Plus de Izzah Noah
Plus de Izzah Noah (20)
Dernier
Dernier (20)
9. chapter 4
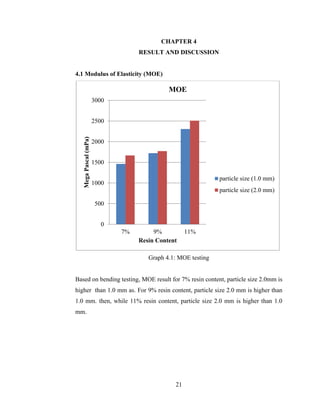
- 1. 21 CHAPTER 4 RESULT AND DISCUSSION 4.1 Modulus of Elasticity (MOE) Graph 4.1: MOE testing Based on bending testing, MOE result for 7% resin content, particle size 2.0mm is higher than 1.0 mm as. For 9% resin content, particle size 2.0 mm is higher than 1.0 mm. then, while 11% resin content, particle size 2.0 mm is higher than 1.0 mm. 0 500 1000 1500 2000 2500 3000 7% 9% 11% MegaPascal(mPa) Resin Content MOE particle size (1.0 mm) particle size (2.0 mm)
- 2. 22 4.1.1 Table of ANOVAs analysis Table 4.1.1: Variance analysis of MOE Source Type III SS Df Mean square F-ratio p-value Size 88,209.434 1 88,209.434 2.342 0.139 Resin 4,624,313.088 2 2,312,156.544 61.379 0.000 Size*Resin 36,212.097 2 18,106.049 0.481 0.624 Error 904,080.398 24 37,670.017 Figure 4.1.1.1.: ANOVA analysis of MOE between size particle and resin content There are very high significant different between resin while for size particle there are no significant different and no interaction between size and resin.
- 3. 23 4.2 Modulus of Rupture (MOR) Graph 4.2: MOR testing Based on bending testing, MOR result for 7% resin content, particle size 2.0mm is higher than 1.0 mm as for 9% resin content; particle size 2.0 mm higher than 1.0 mm While, for 11% resin content, particle size 2.0 mm is higher than 1.0 mm. 0 2 4 6 8 10 12 14 16 18 20 7% 9% 11% MegaPascal(mPa) Resin Content MOR particle size (1.0 mm) particle size (2.0 mm)
- 4. 24 4.2.1 Table of ANOVAs analysis Table 4.2: Variance analysis of MOR Source Type III SS Df Mean Squares F-ratio p-value Size 1.478 1 1.478 0.508 0.483 Resin 337.923 2 168.962 58.045 0.000 Size*Resin 0.910 2 0.455 0.156 0.856 Error 69.860 24 2.911 Figure 4.2.1.1: ANOVA analysis of MOR between size particle and resin content There is very high significant difference between resins while no insufficient difference for size particle.
- 5. 25 4.3 Internal Bonding Graph 4.3: Internal bonding test For the internal bonding testing, the 7% resin content, particle size 1.0 mm is higher than 2.0 mm, the 9% resin content, particle size 1.0 mm is higher than 2.0 mm while, for the 11% resin content, particle size 1.0 mm higher than 2.0 mm. 0 0.5 1 1.5 2 2.5 7% 9% 11% Percent(%) Resin Content IB particle size (1.0 mm) particle size (2.0 mm)
- 6. 26 4.3.1 Table of ANOVA analysis Table 4.3.1: Variance analysis internal bonding Source Type III SS df Mean Squares F-ratio p-value SIZE 4.018 1 4.018 129.706 0.000 RESIN 6.272 2 3.136 101.227 0.000 SIZE*RESIN 0.066 2 0.033 1.066 0.352 Error 1.487 48 0.031 Figure 4.3.1.1: ANOVA analysis of internal bonding between size particle and resin content There are high significant different between particle size and resin. So, particle size and resin affect thickness swelling.
- 7. 27 4.4 Thickness Swelling Graph 4.4: Thickness swelling test Based on thickness swelling result, 7% resin content, particle size 2.0mm is higher than 1.0 mm. 9% resin content, particle size 2.0 mm higher than 1.0 mm and for 11% resin content, particle size 2.0 mm is higher than 1.0 mm. 0 5 10 15 20 25 30 35 7% 9% 11% Percent(%) Resin Content TS particle size (1.0 mm) particle size (2.0 mm)
- 8. 28 4.4.1 Table of ANOVA analysis Table 4.4.1: Variance analysis of Thickness swelling test Source Type III SS df Mean Squares F-ratio p-value Size 257.371 1 257.371 186.968 0.000 Resin 1,103.587 2 551.794 400.853 0.000 Size*Resin 109.312 2 54.656 39.705 0.000 Error 66.074 48 1.377 Figure 4.4.1.1: ANOVA analysis of TS between size particle and resin content There are high significant difference between particle size and resin. So, particle size and resin affect thickness swelling.
- 9. 29 4.5 Water Absorption Graph 4.5: water absorption test For the water absorption, for the 7% resin content, 1.0 mm is higher than 2.0 mm. for the 9%, particle size 1.0 mm is higher than 2.0 mm. then 11% resin content, particle size 2.0 mm is higher than 1.0 mm. 0 20 40 60 80 100 120 140 160 7% 9% 11% Percent(%) Resin Content WA particle size (1.0 mm) particle size (2.0 mm)