Network Challenge: Error and Sensitivity Analysis
•
1 j'aime•633 vues

SDM-Networks 2015: The Second SDM Workshop on Mining Networks and Graphs: A Big Data Analytic Challenge

Recommandé
Contenu connexe
Similaire à Network Challenge: Error and Sensitivity Analysis
Similaire à Network Challenge: Error and Sensitivity Analysis (20)
Plus de Jason Riedy
Plus de Jason Riedy (20)
Dernier
Dernier (20)
Network Challenge: Error and Sensitivity Analysis
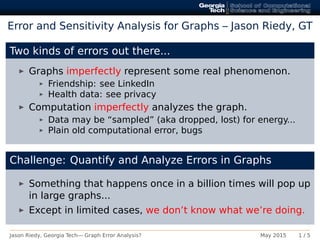
- 1. Error and Sensitivity Analysis for Graphs – Jason Riedy, GT Two kinds of errors out there... Graphs imperfectly represent some real phenomenon. Friendship: see LinkedIn Health data: see privacy Computation imperfectly analyzes the graph. Data may be “sampled” (aka dropped, lost) for energy... Plain old computational error, bugs Challenge: Quantify and Analyze Errors in Graphs Something that happens once in a billion times will pop up in large graphs... Except in limited cases, we don’t know what we’re doing. Jason Riedy, Georgia Tech— Graph Error Analysis? May 2015 1 / 5
- 2. Quick Example: Global Clustering Coefficient −Error+ − Fraction of graph used (kinda) + From Zakrzewska & Bader, “Measuring the Sensitivity of Graph Metrics to Missing Data,” PPAM 2013 Jason Riedy, Georgia Tech— Graph Error Analysis? May 2015 2 / 5
- 3. Quick Example: Local Clustering Coefficients −Error+ − Fraction of graph used (kinda) + From Zakrzewska & Bader, “Measuring the Sensitivity of Graph Metrics to Missing Data,” PPAM 2013 Jason Riedy, Georgia Tech— Graph Error Analysis? May 2015 3 / 5
- 4. Quick Example: Streaming Magnifies Errors Updating PageRank via simple linear algebra: q q q q q q q q q q q q q q q q q q q q q q q q q q q q q q q q q q q q q q q q q q q q q q q q q q q q q q q q q q q q q q q q q q q q q q q q q q q q q q q q q q q q q q q q q q q q q q q q q q q q q q q q q q q q q q q q q q q q q q q q q q q q q q q q q q q q q q q q q q q q q q q q q q q q q q q q q 1e−06 1e−05 1e−06 1e−05 1e−06 1e−05 caidaRouterLevelcoPapersCiteseerpower 0 1000 2000 3000 4000 5000 Number of updates Relativeresidual(1−norm) Algorithm qRestarted P∆ ∆x = (A∆ T D∆ −1 − AT D−1 )x P∆ ∆x = (A∆ T D∆ −1 − AT D−1 )x + r Ranking looks just fine! Until everything falls apart... Paying attention to the initial error works. Jason Riedy, Georgia Tech— Graph Error Analysis? May 2015 4 / 5
- 5. Challenge: Build Error & Sensitivity Analysis for Graphs Possible starting points How do you measure or model error in... connected components? Is the graph a window into the “real” network? Can you leverage link prediction between components? Measure precision and recall against... what? linear-algebra-ish metrics like PageRank? Is this easier? Mapping backward error analysis to a discrete matrix... What is success? Building mental and formal methods for addressing error and sensitivity that can be condensed to rules of thumb. Jason Riedy, Georgia Tech— Graph Error Analysis? May 2015 5 / 5