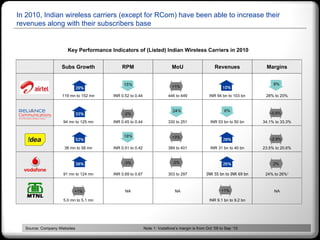
1. In 2010, Indian wireless carriers (except for RCom) have been able to increase their revenues along with their subscribers base Source: Company Websites Note 1: Vodafone’s margin is from Oct ’09 to Sep ‘10 Key Performance Indicators of (Listed) Indian Wireless Carriers in 2010 +1% -2% -0.8% +3% +1% +1% -2% -3% -2.9% 2% Subs Growth RPM MoU Revenues Margins 119 mn to 152 mn INR 0.52 to 0.44 446 to 449 INR 94 bn to 103 bn 28% to 20% 94 mn to 125 mn INR 0.45 to 0.44 330 to 251 INR 53 bn to 50 bn 34.1% to 33.3% 38 mn to 58 mn INR 0.51 to 0.42 389 to 401 INR 31 bn to 40 bn 23.5% to 20.6% 91 mn to 124 mn INR 0.69 to 0.67 303 to 297 INR 55 bn to INR 69 bn 24% to 26% 1 5.0 mn to 5.1 mn NA NA INR 9.1 bn to 9.2 bn NA