1. Risk Prediction: XynChart vs SRTR
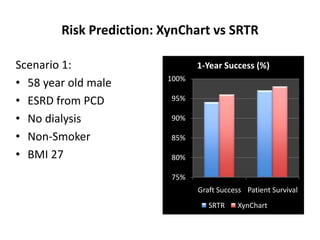
Scenario 1: 1-Year Success (%)
100%
• 58 year old male
• ESRD from PCD 95%
• No dialysis 90%
• Non-Smoker 85%
• BMI 27 80%
75%
Graft Success Patient Survival
SRTR XynChart
2. Risk Prediction: XynChart vs SRTR
Scenario 2: 1-Year Success (%)
100%
• 58 year old male
• ESRD from Hypertension 95%
• Type II DM (Oral Meds) 90%
• No dialysis 85%
• Non-Smoker 80%
• BMI 33 75%
Graft Success Patient Survival
SRTR XynChart
3. Risk Prediction: XynChart vs SRTR
Scenario 3: 1-Year Success (%)
100%
• 58 year old male
• ESRD from Hypertension 95%
• Type II DM (Insulin) 90%
• No dialysis 85%
• Current Smoker 80%
• BMI 33 75%
• Prior MI Graft Success Patient Survival
SRTR XynChart
4. Risk Prediction: XynChart vs SRTR
Scenario 4: 1-Year Success (%)
100%
• 58 year old male
• ESRD from Hypertension 95%
• Type II DM (Insulin) 90%
• 3 years of dialysis 85%
• Current Smoker 80%
• BMI 33 75%
• Prior MI Graft Success Patient Survival
SRTR Graft Xyn Graft
5. Risk Prediction: XynChart vs SRTR
Scenario 5: 1-Year Success (%)
• 58 year old male 100%
• ESRD from Hypertension 95%
• Type II DM (Insulin)
• 3 years of dialysis 90%
• Current Smoker 85%
• BMI 33
80%
• Prior MI
• COPD 75%
• Prior stoke, no deficit but Graft Success Patient Survival
on anticoagulation SRTR XynChart
6. Risk Prediction: XynChart vs SRTR
SRTR does not accurately reflect the clearly increasing risks in
these scenarios. XynChart gives you better insight.
SRTR Predictions XynChart Predictions
1-Year Success (%) 1-Year Success (%)
100% 100%
95% 95%
90% 90%
85% 85%
80% 80%
75% 75%
1 2 3 4 5 1 2 3 4 5
Scenarios Scenarios
Graft Success Patient Survival Graft Success Patient Survival