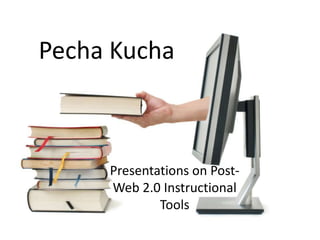
Pecha Kucha: Presentations on Post-Web 2.0 Instructional Tools
•Télécharger en tant que PPSX, PDF•
1 j'aime•1,371 vues

In this session participants were introduced to the concept of Pecha Kucha (pe-chak-cha); the Japanese inspired rapid fire presentation mode with each speaker presenting 20 slides, each on screen for 20 seconds. The seven "flash" presentations focused on post-Web 2.0 apps (Adobe Connect Now, Diigo, Glogster, Google Wonder Wheel, Vuvox and more) for instructional use by educators. Presented at SIDLIT 2010 at Johnson County Community College on Friday, August 6, 2010

Recommandé
Contenu connexe
Tendances
Tendances (18)
Similaire à Pecha Kucha: Presentations on Post-Web 2.0 Instructional Tools
Similaire à Pecha Kucha: Presentations on Post-Web 2.0 Instructional Tools (20)
Plus de Jonathan Bacon
Plus de Jonathan Bacon (20)
Dernier
Dernier (20)
Pecha Kucha: Presentations on Post-Web 2.0 Instructional Tools
- 1. PechaKucha Presentations on Post-Web 2.0 Instructional Tools
- 2. Pecha What?
- 5. kkrieger@jccc.edu Twitter: kkriegeratjcccEducator’s PLN: KeithKriegerLinkedin: kwkriegerDelicious: bigenchiladaDiigo: keithkrieger
- 6. Reseach on the web Highlight Annotate via sticky notes Bookmark for retrieval Sidebar allows us to see all other user’s annotations Recommended bookmarks based on your bookmarks
- 7. Research Archive, not just save as bookmark Organize by tags or list Searchable
- 8. Tied to 3 Diigo themes Research Share Collaborate
- 9. 3 sections My Library My Network My Groups
- 10. 5 stages of bookmarking One computer, one set of bookmarks Two computers, two sets of bookmarks Can sync, but not straight-forward Would like to share and annotate Would like to use it in a group Grab everything, including notes, videos, images, screenshots Access from any device, anywhere
- 11. PLN Colleagues Students Public or private Specific collections with a list Use widgets to share Send to blog Blogroll Send to Delicious Keeps data out of jail
- 12. Follow or be followed People or groups with similar interests Build different PLNs in My Network Follow bookmarks and comment
- 13. Annotate and share with anyone Annotated link Send via email Recipient can see annotations, highlights, sticky notes No software required Better retention Active reading Move between devices Retain notes
- 14. Bookmarks Upload and capture snapshot Can snapshot pdf Keep page forever
- 15. Tagging Multiple tags Searchable by tags Full-text search supported Search annotations, URLs, notes, titles, tags
- 16. Send to non-Diigo users Blogging tool can send directly to blog Including tags
- 17. Screen capture Annotate, markup, comment
- 18. Read later Let diigo manage your reading list
- 19. Snapshot Creates image in addition to bookmark
- 20. Import Import from bookmarks Sync to Delicious
- 21. Highlighting Install Diigo toolbar Highlight page parts Add sticky notes to highlights Will stay on page on revisits Part of online archive
- 22. Diigolet No toolbar installation required Make bookmarks toolbar visible Go to: diigo.com/tools/diigolet Drag button to toolbar
- 23. Mobile Android and iPhone
- 24. Educator account Controlled access Can set up student groups Moderated Free to educators
- 25. A teacher can create student accounts for an entire class with just a few clicks (and student email addresses are optional for account creation) Students of the same class are automatically set up as a Diigo group so they can start using all the benefits that a Diigo group provides, such as group bookmarks and annotations, and group forums. To protect the privacy of students, student accounts have special settings which only allow their teachers and classmates to contact them and access their personal profile information. Ads presented to student account users are limited to education-related sponsors.
- 26. Group example Mike Wesch at k-state Note members, items
- 27. Organizing lists Add sections Drag and drop Play list as slideshow
- 28. Collaborate Groups Share annotations to the group Group members alerted via email Group members can comment Threaded discussions
- 29. kkrieger@jccc.edu More Diigo 9:45 FridayTwitter: kkriegeratjcccEducator’s PLN: KeithKriegerLinkedin: kwkriegerDelicious: bigenchiladaDiigo: keithkrieger
- 30. Michael Rea
- 31. What is it good for Two Guests at a time Office hours Tutoring Troubleshooting Student team collaboration More.
- 32. Adobe Connect NowSign up at. www.adobe.com/acom/connectnow No special downloads. Just flash player
- 33. Log in to ConnectNow After you have created your account Sign in with your adobe ID at https://acrobat.com/.
- 34. Send Invites Access the meeting room. Share this link. Its best to send this ahead of time in an email with the time you want to meet.
- 35. Participants view Participants enter as guests. You can accept or decline.
- 36. Setting preferences ConnectNow is set to Require Approval for Entry. You may change this.
- 37. Features
- 40. File Sharing
- 41. Shared Notes
- 42. Chat
- 43. Whiteboard
- 44. Screen Sharing
- 45. Remote control
- 46. Best Practices for setting up your computer prior to the meeting: Directly connect to the fastest internet connection available. Avoid wireless connections Shut down Email/IM and any programs NOT being used for the presentation.
- 48. Have programs that you are screen-sharing open to the appropriate window and ready to demonstrate - avoid launching and logging into programs while screen sharing.
- 50. Optimize room bandwidth to DSL, or better.
- 52. Questions?
- 53. Linda Wapelhorst
- 57. Show Me What’s Wrong
- 59. Glogster
- 61. LiveWeb
- 62. Tagxedo
- 63. Image Chef
- 64. Make Sweet
- 65. ZamZar Document Image Music Video E-Book Compressed CAD
- 66. Krunchd
- 67. Stat Planet
- 70. Critical Past
- 71. Capzles
- 72. Chart Tool
- 74. Meg McGranaghan
- 75. The Wonder of it All! Meg McGranaghanButler Community College
- 95. Kathryn Barker
- 97. Vuvox
- 98. Image Credits (from Vuvox) Upper left: Kathy Moore Upper right: Lansing State Journal Lower left: sdphotoLower right: HelderGoncalves
- 102. …your own bad self Photo by: Sergio Bertolini / flickrCC Attribution-NonCommercial-ShareAlike 2.0 Generic license
- 106. <HTML> Icons from Visual Pharm (mail) and Jack Cai (link)
- 116. Questions?
Notes de l'éditeur
- Jog the Web is a website that allows you to create a
- Billboards, movie boards, flags, sailboat, Christmas ornament, brick wall, even KC Royals sign. Create and save sign as .jpg.
- "StatPlanet is a browser-based interactive data visualization and mapping tool. It is used by international organizations such as UNESCO and SACMEQ, NGOs, Fortune 500 companies and government departments for a wide variety of purposes. It can be used to easily and rapidly create interactive thematic maps, interactive graphs, and feature-rich interactive infographics.StatPlanet is also available as a stand-alone application which can be used as free educational software. It comes with up-to-date statistics on demography, economy, education, environment & energy, gender and health, for most countries in the world. Choose your visualizationEasily switch between different types of visualisations with the click of a button. Data can be viewed as maps, bar charts, line graphs and scatter plots.Select countries by clicking on them in the world map or country selection window. Statistics and details for the country selected are displayed inside popups and visualization components. Animate changes over timeMaps, bar charts and scatter plots can all be animated over time.Zoom into map regionsSelect map regions such as Europe or Africa, or define your own custom region. Maps and visualizations will narrow down to the selected region and provide additional details.Hide or reveal detailsChange the level of detail by hiding or revealing interface components, country names or statistics.Customize the colors and value ranges of maps and graphs.Export maps for use in other applications or publications.
- Critical Past offers more than 57,000 historic videos and 7 million photos for FREE in one of the world's largest collections of royalty-free archival stock footage. Link to the videos and/or photos free of charge. You can search the site by decade or topic. I searched "Wichita, KS" and found a video about Joyland.
- Capzlesis one of the best timeline creators I have found. You can create a timeline that incorporates text, pictures, and/or video. The timelines are interactive and really fun to scroll through.Students could even create a timeline of their work for the semester and add how they have grown and what they learned during the semester.
- Charts and graphs are a great tool to communicate information visually. On Onlinecharttool.com you can design and share your own graphs online and for free. Chart types include bar charts, pie charts, line charts, bubble charts and radar plots. Students can build charts in 5 easy steps: Design Graph. In this step you choose your Chart type. Add Data.Labels and Fonts.Preview grafiek. If you have entered all your data and youer settings you can click on 'preview graph' to show your chart and see if it is correct. You can always go back some steps to change your data and your settings.Save and Share email or save it as an image on your local computer. If you are registered and logged in on our site you can also save your graphs online for further editing at a later stage.
- 12 Featured Feeds / 9 Styles / 2-19 Variations per Style