3. DISCLAIMER
The forward-looking statements presented herein are subject to risks and uncertainties. These
statements are based on the beliefs and assumptions of our management, and on information
currently available to us.
Forward-looking statements are not guarantees of performance. They involve risks,
uncertainties and assumptions because they relate to future events and therefore depend on
circumstances that may or may not occur. Our future operating results, financial condition,
strategies, market share and values may differ materially from those expressed in or
suggested by these forward-looking statements. Many of the factors that will determine these
results and values are beyond our ability to control or predict.
Forward-looking statements also include information concerning our possible or assumed
future operating results, as well as statements preceded by, followed by, or including the words
''believes,'' ''may,'' ''will,'' ''continues,'' ''expects,'‘ ''anticipates,'' ''intends,'' ''plans,'' ''estimates'' or
similar expressions.
2
7. JBS S.A. at a Glance
• Founded 1953 in central Brazil
• IPO in 2007
• Ibovespa ticker: JBSS3
• ADR ticker: JBSAY
• Leading animal protein producer in the World
• Production platform in South America, North America, Europe and
Oceania
• 125,000 employees worldwide
• Revenues of about US$ 30 Billion per annum
• Market cap of R$ 22 billion*
*Source: Bloomberg 25/02/2010
6
8. JBS S.A. Growth Through Acquisitions
• JBS’ History has been built through Bertin Association
Inalca
more than 30 acquisitions in 15 years Swift Foods Co. Pilgrim’s Pride
with adequate capital structure and Maringá (Amambay) JBS Hides
management Berazategui 5 new units
(Rio Platense)
Colonia Caroya
Net Sales (in US$ billion) Tasman
SB Holdings Smithfield
Companies and assets acquired
JV Beef Jerky Beef
Five Rivers
Rio Branco Venado
Goiânia Barretos (Anglo) 30.3
Cacoal 1 Tuerto
(Anglo) Pres. Epitácio (Bordon) Cacoal 2 Pontevedra
Campo Grande (Bordon) Porto Velho (CEPA)
Vilhena (Frigovira)
Barra do
Cáceres Pedra Preta
Garças Araputanga
19.8
(Frigo Marca)
(Frigosol)
(Sadia) (Frigoara) Rosário
Iturama
(Swift ARG)
(Frigosol) San Jose
Andradina 12.7
(Sadia) (Swift ARG)
1.2 1.5 1.9
0.3 0.4 0.4 0.5 0.5 0.4 0.7
(1) (2) (3)
1996 1997 1999 2000 2001 2002 2003 2004 2005 2006 2007 2008 2009
R$/US$ end of the year quotation
Source: JBS
(1) Pro Forma JBS S.A. LTM Dec07
(2) Pro Forma JBS S.A. LTM Dec08
7
(3) Pro Forma JBS S.A. LTM Jun09 (including 5 new units and hides operation); Pilgrim’s Pride Sep09 (Estimated); Bertin LTM Jun09
10. Our Strategy
2005/2006 2009/2010 2011/2012
2007/2008
Adequate Global Sales & Value Added
Global Production
Financial Distribution Products &
Platform
Structure Platform Branding
South America Fresh Products
South
Debt for America North America
Cooked Products
Working Australia
Minced Products
North Cured Products
Capital America European Union Ready to Eat
Products
Equity Australia
Asia Case Ready
Products
to Russia
Global Brands
Finance European Africa
Marketing
Union
Growth Middle East Investments
- Access to raw material - Integrate the sales and - High technology
- High liquidity level. distribution platform to investments to produce
supply globally.
- Debt equalized to cash serve efficiently, local and value added products.
- Leader in countries with
generation. external markets, small - Increase value added
surplus production.
- Strong cash position. retailers, food processors, products portfolio.
- Scale.
- Access to international restaurants, and other - Customized products to
- Leader in exports globally.
capital markets to finance customers globally. each market.
- Access to all meat
growth. - Sales force distributed over - Convenience to consumers
markets. the globe.
- Development of long term day to day.
- Exchange of best - Efficiency on selling the best
financing plan. - Brand and Quality
practices. product, to the best market,
- Use of export platform to recognition and leadership.
- Efficiency cost gains. with the best price. - Marketing investments to
grow.
- Cost reduction - Cost reduction on sales and be present in consumer
- Hands-on working capital
opportunities. 9 transport. minds.
management.
- Margin improvements. - Margin improvements. - Margin improvements.
11. Our Strategy
Branding
Value
Added
Products
Sales &
Distribution
Platform
Production Platform 4%
Cost Reduction, EBITDA
Financial Experienced Productivity, Risk Margin
Structure Management Process Management
Optimization
Foundation
10
12. Corporate Structure
Batista Family Bertin Family
Controlling Market
Holding (Free Float)
59% 41%
JBS S.A.
BNDES
(including Bertin)
100% 80% - 75%
US$ 2 Bn
Other JBS U.S.A.
subsidiaries Includes AUS
20% - 25%
Other
64% shareholders
36%
Pilgrim’s Pride
11
14. Global Production Platform
Production Units Employees Daily Slaughter Capacity
JBS Brasil 61 44,993 43,400 B
JBS MERCOSUR 8 6,217 8,400 B
28,600 B
JBS USA 16 24,295 48,500 P
4,500 S
Pilgrims Pride 37 39,000 7,200,000 C
8,690 B
JBS Austrália 10 6,995
20,000 S
Inalca JBS 8 3,500 3,000 B
92,090 B
48,500 P
Total 140 125,000
24,500 S
7,200,000 C
(B) Beef; (P) Pork; (S) Smalls; (C) Chicken
13
16. Market Highlights
• Robust domestic consumption in Brazil.
• Growing middle classes in the Emerging Market sourcing more
product through imports.
• Recovery of exports from US allied with improved domestic American
consumption.
• European protein production declining.
• Gradual Improvement in exports generally with the reduction and/or
removal of trade barriers.
15
17. Per capita food consumption curve
(Kg / Year)
180
1969/ 71
160 1979/ 81
1989/ 91
140
1999/ 01
120 2030
2050
100
80
60
40
20
0
Cereals Roots and Beans, Peas Sugar Oils Crops Meat Milk and its
Tubers and Lentils and its products
Source: FAO products
16
19. US Beef and Veal Exports (Million Pounds)
3.000
2.467 2.520
2.412 2.449
2.500
2.269
2.000 1.888 1.867
1.433
1.500
1.146
1.000
697
461
500
0
1999 2000 2001 2002 2003 2004 2005 2006 2007 2008 2009
Mexico Canada South Korea Japan Vietnam China Hong Kong N etherlands Others
Source: USDA ERS
18
20. US Pork Exports (Million Pounds)
5.000
4.667
4.500
4.128
4.000
3.500 3.142
2.995
3.000 2.667
2.500
2.181
2.000 1.717
1.560 1.612
1.500 1.278 1.287
1.000
500
0
1999 2000 2001 2002 2003 2004 2005 2006 2007 2008 2009
Japan China Hong Kong Mexico Russia Canada South Korea Australia Others
Source: USDA ERS
19
21. US Poultry Exports (Million Pounds)
8.000
7.109
6.906
7.000
6.070
6.000 5.738
5.333 5.367
5.138 5.013
4.980 4.942 4.997
5.000
4.000
3.000
2.000
1.000
0
1999 2000 2001 2002 2003 2004 2005 2006 2007 2008 2009
Russia China (Mainland) Iraq Mexico Canada Cuba Other Chicken Others
Source: USDA ERS
20
22. Strong Long-term Industry Fundamentals
Meats Consumption Per Capita
Recommended
consumption
80kg/capita
Per capita consumption
(kg/capita)
Population growth coupled with rising worldwide standards of living will drive
an increase in protein demand on emerging global middle class
Source: FAO
21
24. Highlights for the 4th Quarter 2009
• Net Profit of R$127.9 million in 4Q09.
• Net Revenue for 2009 was R$34,311.8 million, representing a 13.1% increase y-o-y.
• In 4Q09 the consolidated EBITDA increased 49.6% compared to 4Q08, from
R$265.9 million to R$397.8 million. The consolidated EBITDA margin was 5.4% for
the period, compared with 2.8% for 4Q08
• Completion of the Bertin S.A. Merger and the acquisition of a controlling interest in
Pilgrim’s Pride Corporation.
• A pro forma Net Revenue in 2009 of R$55,223.6 million, 82.0% higher than 2008.
• EBITDA pro forma of R$3,058.0 million in 2009, increase of 164.5% over the
previous year.
23
27. Debt
• The Net Debt/EBITDA reduced from 3.3x in 3Q09 to 3.1x in 4Q09.
• JBS raised US$2.0 billion by issuing two million Debentures.
• The company’s cash position is sufficient to cover, almost entirely, the short term debt of JBS
• Current assets exceed current liabilities by almost 50%, demonstrating the liquidity of the
Company’s balance sheet.
Net Debt / EBITDA Pro Forma per Quarter Gross debt Profile (R$ million)
14,429.8 5,479.6
*
63% 62%
37% 38%
2009 2008
Source: JBS Short Term Long Term
Net Debt/ EBITDA EBITDA pro-forma
* LTM including Bertin and Pilgrim’s Pride pro-forma.
26
28. Revenue Distribution by Market
2009 2008
E x ports
23% E x ports
33% Dom e stic
Ma rke t
Domes tic 67%
Market
77%
Source: JBS Source: JBS
27
29. JBS Consolidated Exports Distribution
JBS Exports 2009 JBS Exports 2008
US$ 5.0 billion US$ 5.6 billion
Others Japan
China Others Mexico
19% 13% 3% 15%
E.U. USA 18%
Taiwan
2% 11% 3%
Russia
China Russia Taiwan 13%
10% 4%
4% E.U,
Mexico Canada Middle East Canada Japan 11%
USA 8% 8% South Korea 7% 9%
8%
5% 4%
Hong Kong
6% Hong Kong
South Korea 5%
6% Africa and Middle East
7%
Source: JBS 28
31. A Closer look at synergies – Pilgrim’s Pride
• USD 95 Million already captured, through initiatives in the personnel, transportation, and
packaging supply areas.
• USD 65 Million further by mid year, principally through G&A, exports, and logistic efficiencies.
• USD 200 / 300 Million total annual synergies.
Pilgrim’s Pride Stock Price
12
Closing of the
acquisition
10 Announcement of the
PPC acquisition by JBS
8
6
4
2
0
Jan-09 Feb-09 Mar-09 Apr-09 May-09 Jun-09 Jul-09 Aug-09 Sep-09 Oct-09 Nov-09 Dec-09 Jan-10 Feb-10 Mar-10
Source: Bloomberg 30
32. A Closer look at synergies – Bertin S.A.
• R$145 million implemented by end of 1Q10 in packaging,
industrial processes, formulation and corporate.
• R$100 million further synergies to be realized particularly at
corporate and exports in the coming six months.
• Total annual synergies expected to reach R$500 million by
2011.
31
34. Final Considerations
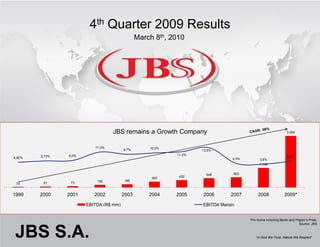
• JBS remains a Growth Company.
• Focus on synergy gains through the integration of Bertin in Brazil and Pilgrim’s
Pride in the USA.
• JBS continues to build its distribution platform to add value to its products and
expand its margins.
• Commitment to the Company’s financial health and the reduction of the financial
leverage, maintaining a strong cash generation.
• Having taken the Company public and having elevated its corporate governance,
JBS is now focused upon the financial fundamentals to take the Company to
Investment Grade.
33
35. Questions & Answers
IR Contacts:
ir@jbs.com.br
+55 11 3144 4055
www.jbs.com.br/ir “In God We Trust, Nature We Respect”
34
34