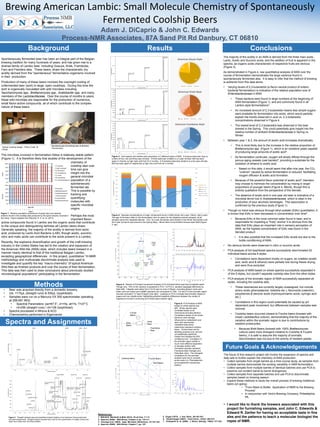
"Subclassing and Composition – A Pythonic Tour of Trade-Offs", Hynek Schlawack
PANIC 2014 - PNA - Sour Beer Chemistry Poster
1. Brewing American Lambic: Small Molecule Chemistry of Spontaneously
Fermented Coolship Beers
Adam J. DiCaprio & John C. Edwards
Process-NMR Associates, 87A Sand Pit Rd Danbury, CT 06810
Background
Conclusions
Results
Allagash-004-H_FD.esp
Spontaneously fermented beer has been an integral part of the Belgian
brewing tradition for many hundreds of years, and has given rise to a
diverse family of Lambic beer, including Gueuze, Kriek, Framboise,
Faro and Flanders ales. These beers, share the characteristic dry
acidity derived from the "spontaneous" fermentative organisms involved
in their production.
Lactic Acid
American Geuze-Style
3%
Normalized Intensity
0.010
20%
Acetic Acid
As demonstrated in Figure 4, raw quantitative analysis of AWA over the
course of fermentation demonstrates the large variance found in
spontaneously fermented ales. It is easy to infer that the method of brewing
is authentic from this data alone.
Succinic Acid
0.005
77%
Production of many of these beers involves the overnight cooling of
unfermented beer (wort) in large, open coolships. During this time the
wort is organically inoculated with wild microbes including
Saccharomyces spp., Brettanomyces spp., Acetobacter spp. and many
members of the Lactobacillaceae. Over the course of months to years,
these wild microbes are responsible for the production of numerous,
small flavor-active compounds, all of which contribute to the complex
nature of these beers.
0
3.0
2.5
2.0
Lactic
1.5
Acetic
•
Succinic
Chemical Shift (ppm)
0.055
The majority of the acidity in an AWA is derived from the three main acids:
Lactic, Acetic and Succinic acids, and the addition of fruit is apparent in the
spectra, as organic acids characteristic of respective fruits are obvious
(Figure 3).
Allagash-006-H_FD.esp
American Kriek-Style
Lactic Acid
0.050
0.045
0.040
•
These bacteria were found in large numbers at the beginning of
AWA fermentation (Figure 1), and are commonly found in all
Lambic-style fermentations².
•
An increased amount of 2,3-butanediol means less simple sugars
were available for fermentation into acids, which would partially
explain the trends observed in acid vs. 2,3-butanediol
concentrations observed in Figure 4.
•
0.035
Normalized Intensity
Varying levels of 2,3-butanediol (a flavor-neutral product of enteric
bacterial fermentation) is indicative of the relative population size of
Enterobacteriaceae in AWA.
The lowest level of 2,3-butanediol was observed in the beer
brewed in the Spring. This could potentially give insight into the
relative number of ambient Enterobacteriaceae in Spring vs.
Winter.
35%
0.030
43%
0.025
0.020
Acetic Acid
0.015
Malic Acid
Succinic Acid
0.010
4%
0.005
18%
0
-0.005
3.0
2.5
2.0
Lactic
1.5
Acetic
Succinic
Malic
Chemical Shift (ppm)
Allagash-005-H_FD.esp
American Framboise-Style
0.055
Lactic Acid
0.050
0.045
Normalized Intensity
0.040
0.035
0.030
Citric Acid
•
0.020
0.010
Typical Coolship design. Photo Credit: M.
Farrell.
35%
0.025
0.015
Spontaneously fermenting beer at Brewery
Timmermans
35%
Acetic Acid
0.005
Succinic Acid
•
This is most likely due to the increase in the relative proportion of
Brettanomyces spp. (Figure 1), which is an oxidative yeast capable
of producing large amounts of acetic acid³.
•
3%
A
Between year 1 & 2, the amount of acetic acid increases dramatically.
As fermentation continues, oxygen will slowly diffuse through the
porous aging vessels (oak barrels)⁴, providing a substrate for the
oxidation of ethanol to acetic acid.
27%
0
3.0
2.5
2.0
Lactic
1.5
Acetic
Succinic
Citric
Chemical Shift (ppm)
The microbes involved in fermentation follow a relatively stable pattern
(Figure 1). It is therefore likely that studies of the development of the
chemistry of
coolship ales over
time can give
insight into the
general microbial
population of a
spontaneously
fermented ale.
This is possible by
tracking and
quantifying
molecules with
specific microbial
origins.
Figure 3: Acid regions and relative acid proportions of 3 different styles of AWA. A Gueuze-style beer (top) is
a blend of one, two and three year old beer. A Kriek-style beer (middle) is a 2-year old beer that has been
aged on cherries (a high malic acid fruit) for 4 months. A Framboise-style beer (bottom) is a two year old beer
that has been aged on raspberries (a high citric acid fruit) for 4 months.
10000
9000
1600
8000
Concentration (mg/L)
•
1800
1400
•
1200
6000
1000
The absence of acetic acid in one year old beer is indicative of a
microbial terroir low in Acetobacteriaceae, which is ideal in the
production of sour alcoholic beverages. This assumption is
confirmed by the previous study (Figure 1).
Citric Acid
Succinic Acid
5000
800
Acetic Acid
Lactic Acid
4000
600
Ethyl Acetate
2,3-Butanediol
3000
400
200
1000
0
0
1
1
2
3
Blend
Age (yrs)
•
Figure 4: Absolute concentrations of major components found in AWA (Acids: left y-axis, Others: right y-axis).
The age of the beers refers to the fermentation time (in years) for the respective barrels sampled, as all
samples came from separate batches. The 1 & 3 year old barrels were brewed in the Winter (November) and
the 2 year old barrel was brewed in the Spring (May). Blend refers to the finished Gueuze-style AWA (Figure
3, top).
Perhaps the most
important flavoractive compounds found in Lambic are the organic acids that contribute
to the unique and distinguishing tartness all Lambic beers share.
Generally speaking, the majority of the acidity is derived from lactic
acid, produced by Lactic Acid Bacteria (LAB), though acetic, succinic,
citric and malic acids can contribute to the acids present in a Lambic.
Because of the powerful flavor potential of acetic acid⁵, blenders
may choose to minimize the concentration by mixing in larger
proportions of younger beers (Figure 4, Blend), though this is
entirely qualitative from the perspective of the blender.
•
7000
2000
Figure 1: Relative population proportions of yeast (top) and bacteria
(bottom) found in the coolship ales produced by the same brewery involved in
this study. Figure adapted from Bokulich, N. A. et. al. (2012).
Based on this data, it would seem that after one year, the CO₂
“cushion” caused by active fermentation is reduced, facilitating
oxygen diffusion & acetic acid formation.
Though no trend was obvious through ethyl acetate (EtAc) quantitation, it
is known that EtAc in beer decreases in concentration over time⁶.
•
Because EtAc is the most common ester found in beer, and is
responsible for imparting a “fruity” aroma⁷ it is obvious from the
data that EtAc plays an important role in sensory perception of
AWA, as the highest concentration of EtAc was found in the
blended product.
•
Saisons
Recently, the explosive diversification and growth of the craft brewing
industry in the United States has led to the creation and expansion of
the American Wild Ale (AWA) style, which includes beers brewed in a
manner nearly identical to that of the traditional Belgian Lambic,
excepting geographical differences. In this project, quantitative 1H-NMR
methodology and multivariate discriminate analysis was used to
investigate and quantify the key “macro-chemistry” of typical American
Wild Ales as finished products and over the course of their fermentation.
This data was then used to draw conclusions about previously studied
microbiological populations¹ participating in the fermentation.
Belgian
Foudre
Beer
•
Hybrid
Beer
American
Foudre
Beer
No obvious trends were observed in citric or succinic acids.
•
Belgian
Geuzes
American
Coolship
Beers
It is also possible that the increased EtAc levels are due to the
bottle conditioning of AWA.
PCA analysis of full lyophilized spectra successfully discriminated 20
individual beers across 8 styles
IPA +
Lagers
•
100%
Brett
Beers
Correlations were dependent mostly on sugars, as volatiles (acetic
acid, lactic acid & ethanol) were partially lost during freeze drying,
and were thus excluded.
•
•
Methods
Figure 5: Results of Principal Component Analysis of 20 individual beers spanning 8 separate styles.
Though only ~76% of the variance is explained in PCA-1 & PCA-2, samples segregate effectively by
style (left). Integrals were taken from 0.5-9.5 ppm to every 0.02ppm, excluding ethanol, lactic acid,
acetic acid and maleic acid (qNMR standard) and normalized to 1000. For this PCA the aromatic region
was also excluded (~5.7ppm-9.5ppm) (top right). Loadings on PCA 2 indicate discrimination based on
sugars and non-volatile acids, highlighting potential metabolic differences between the variety of
organisms involved in producing all of these beers (bottom right).
Beer was acquired directly from a domestic brewery.
Vol. =175µL (straight runs) & 500µL (lyophilized)
Samples were run on a Mercury-VX 300 spectrometer operating
at 299.681 MHz.
•
Spectral Parameters: pw=67.5°, d1=5s, at=7s, T=27°C
•
nt=256 (straight runs) / nt=128 (lyophilized)
Spectra processed in Mnova & ACD
Chemometrics performed in Eigenvector
Foudre
Beers
Spectra and Assignments
Brett
Beers
Kriek
Beer
Framboise
Beer
Coolship Beers
Foudre Beers
Brett Beers
References:
Figure 2: “Straight” analysis (top) and lyophilized analysis (bottom) of an American Gueuze-style beer
with peak assignments. Straight analysis samples were used for the quantification of volatile compounds
(lactic acid, acetic acid, and ethyl acetate)
1.
2.
3.
4.
Bokulich, Bamforth & Mills (2012). PLoS One, 7:1-11.
Sparrow (2005). Wild Brews, Chapter 4; pp. 110-111.
Uscanga et.al. (2003). Appl. Microbiol. Biotechnol., 61;157-162.
Sparrow (2005). Wild Brews, Chapter 7; pp. 197.
Figure 6: PCA Analysis of AWA
based on whole spectra (top
left). Whole spectra were
correlated based on all
resonances excluding ethanol.
Correlations based on the whole
spectrum were strongly
influenced by maltodextrin and
lactic acid resonances.
Unlabeled data points
(diamonds) represent coolship
beers. Circles drawn are for
labelling purposes only, and are
not statistically significant.
Dotted line indicates the 95%
confidence limit. Correlation of
the aromatic region yielded a
much more effective separation
of samples (bottom left).
Unmarked samples represent
Framboise Beer (triangle) and
Kriek Beer (star). The strongest
correlations for the aromatic
analysis were due to aromatic
amino acids (i.e. Phenylalanine)
and polyphenolic resonances
(below).
5. Engan (1973). J. Inst. Brew., 80:162-163.
6. Vanderhaegen (2007). Food Chem., 103(2): 404-412.
7. Kobayashi et. al. (2008). J. Biosci. Bioeng., 106(4): 317-323.
PCA analysis of AWA based on whole spectra successfully separated 4
of the 5 styles, but couldn’t separate coolship ales from the other styles.
•
•
•
•
•
PCA analysis of the aromatic region of AWA successfully separated all
styles, including the coolship ales.
•
These resonances are currently largely unassigned, but include
amino acids (phenylalanine, histidine etc.), flavonoids (catechin),
polyphenols & benzoic acids (hydroxycinnamic acids, syringic acid
etc.).
•
Correlations in this region could potentially be caused by pH
dependent peak movement, but differences between samples was
minimal.
•
Coolship beers occurred closest to Foudre beers (brewed with
mixed Lactobacillus culture), demonstrating that the majority of the
variation within the aromatic region is due to contributions by
resident prokaryotes.
•
Because Brett Beers (brewed with 100% Brettanomyces
culture) were more divergent (relative to Coolship & Foudre
beers), it is safe to assume the majority of aromatic
discrimination was not due to the activity of resident yeasts.
Future Goals & Acknowledgements
The future of this research project will involve the expansion of spectra and
data sets to further explain the chemistry of AWA production.
• Collect samples from single barrels as a time-course study, as samples from
multiple barrels demonstrate the exciting variability in AWA fermentation.
• Collect samples from multiple barrels of identical batches and use PCA to
examine non-evident barrel-to-barrel divergences.
• Collect samples from separate batches and use PCA to discriminate
samples based on brewing season.
• Expand these methods to study the overall process of brewing traditional
beers (on-going)
• “From Mash to Bottle: Application of NMR to the Brewing
Process”
• In conjunction with Yard’s Brewing Company, Philadelphia,
PA.
• I would like to thank the brewers associated with this
project for furnishing samples, and John C. Edwards &
Edward R. Zartler for having an acceptable taste in fine
ales and the patience to teach a molecular biologist the
ropes of NMR.