
Recommended
Recommended
More Related Content
What's hot
What's hot (20)
Viewers also liked
Similar to 00003 Jc Silva 2006 Mcp V5n4p589
Similar to 00003 Jc Silva 2006 Mcp V5n4p589 (20)
00003 Jc Silva 2006 Mcp V5n4p589
- 1. Supplemental Material can be found at: http://www.mcponline.org/cgi/content/full/M500321-MCP200 /DC1 Research Simultaneous Qualitative and Quantitative Analysis of the Escherichia coli Proteome A SWEET TALE*□ S Jeffrey C. Silva‡§, Richard Denny¶, Craig Dorschel‡, Marc V. Gorenstein‡, Guo-Zhong Li‡, Keith Richardson¶, Daniel Wall , and Scott J. Geromanos‡ We describe a novel LCMS approach to the relative quan- environment in which E. coli lives is subject to rapid changes titation and simultaneous identification of proteins within in the availability of the carbon and nitrogen compounds the complex milieu of unfractionated Escherichia coli. necessary to provide its energy and primary building blocks. Downloaded from www.mcponline.org at CELL SIGNALING TECHNOLOGY on May 22, 2007 This label-free, LCMS acquisition method observes all E. coli survival hinges on the ability to successfully control the detectable, eluting peptides and their corresponding frag- expression of genes coding for enzymes and proteins re- ment ions. Postacquisition data analysis methods extract quired for growth in response to environmental changes. Be- both the chromatographic and the mass spectrometric cause of its simple cellular structure and its relative ease of information on the tryptic peptides to provide time-re- solved, accurate mass measurements, which are subse- maintenance and manipulation in the laboratory, E. coli has quently used for quantitation and identification of constit- become the “workhorse host” for most research in molecular uent proteins. The response of E. coli to carbon source biology and microbiology. As a result, it is regarded as one of variation is well understood, and it is thus commonly used the most completely characterized organisms in all biology. as a model biological system when validating an analytical The ease with which recombinant proteins can be expressed method. Using this LCMS approach, we characterized in E. coli has made this bacterium useful in the study of many proteins isolated from E. coli grown in glucose, lactose, basic biological processes as well as in the production of and acetate. The change in relative abundance of the heterologous proteins for research and therapeutic purposes. corresponding proteins was measured from peptides For these reasons, E. coli has become a model system for common to both conditions. Protein identities were also testing new analytical technologies. For example, the rela- determined for those peptides that were unique to each condition, and these identities were found to be consist- tively small genome size and prevalent laboratory use made ent with the underlying biochemical restrictions imposed E. coli genome one of the first to be completely sequenced by the growth conditions. The relative change in abun- (1). Likewise E. coli genome microarrays were among the first dance of the characterized proteins ranged from 0.1- to to be commercially available with sequences for the complete 90-fold among the three binary comparisons. The overall set of open reading frames as well as intergenic regions (2). coverage of the characterized proteins ranged from 10 to The origins of proteomics can also be traced back to E. coli 80%, consisting of one to 34 peptides per protein. The when pioneering two-dimensional gel electrophoresis exper- quantitative results obtained from our study were compa- iments enabled the investigation of proteins on an organism- rable to other existing proteomic and transcriptional pro- wide scale (3). Resources such as CyberCell Database (4) and filing approaches. This study illustrates the robustness of EchoBASE (5) have been designed as central repositories of this novel LCMS approach for the simultaneous quantita- tive and comprehensive qualitative analysis of proteins in biochemical and genetic data from E. coli generated by a complex mixtures. Molecular & Cellular Proteomics 5: wide range of sources. These databases are periodically up- 589 – 607, 2006. dated and annotated to facilitate a comprehensive under- standing of this model organism. The knowledge gained through this organized effort can be applied to the under- Escherichia coli is a microbial symbiote found in the colon standing of other organisms for the development of antibiotics and large intestine of most warm blooded animals that plays and/or antifungal agents. a critical role in vertebrate anabolism and catabolism. The The availability of fully sequenced genomes has allowed construction of microarrays that are used to detect and quan- From the ‡Waters Corporation, Milford, Massachusetts 01757- tify all postulated gene products by determining the levels of 3696, ¶Waters Corporation, Atlas Park, Simons Way, M22 5PP the corresponding transcribed mRNA. A study by Zimmer et Manchester, Great Britain, and Novartis Institutes for BioMedical al. (6) demonstrated the use of this method to identify those Research, Inc., Cambridge, Massachusetts 02139 genes in E. coli whose expression is activated when replacing Received, September 28, 2005, and in revised form, December 12, 2005 a preferred nitrogen source with a non-preferred nitrogen Published, MCP Papers in Press, January 5, 2006, DOI 10.1074/ source. In a separate study, Oh et al. (7) performed a similar mcp.M500321-MCP200 analysis where E. coli were grown on different carbon © 2006 by The American Society for Biochemistry and Molecular Biology, Inc. Molecular & Cellular Proteomics 5.4 589 This paper is available on line at http://www.mcponline.org
- 2. E. coli Proteome Analysis sources. These studies not only identified those genes known varying degrees of post-translational modifications that a par- to be associated with the specified metabolic pathway but ticular protein may undergo, resulting in protein components also revealed many genes that had not been linked previously appearing in multiple locations on the two-dimensional image. with the metabolic pathway under study. The development of automated, data-dependent ESI MS/MS Although the measurement of transcribed mRNA by hybrid- in conjunction with microcapillary LC and database searching ization techniques has led to the discovery of molecular mark- has significantly increased the sensitivity and speed of iden- ers and the elucidation of biologic mechanisms, this tech- tification of gel-separated proteins. Alternative methods have nique is not sufficient for the complete characterization of subsequently been developed to maximize the duty cycle of biologic systems. The detection of a particular gene product the mass spectrometer with a concomitant increase in sensi- in a microarray experiment does not confirm the presence or tivity that use a parallel (“broad band” acquisition) rather than absence of the resulting protein product or related post- a serial approach for the collision-induced dissociation of translationally modified isoforms. It is also understood that peptides (12–14). This method enhances the run-to-run repro- quantitative differences in the transcript of a particular gene or ducibility and yields high mass accuracy for both intact pep- Downloaded from www.mcponline.org at CELL SIGNALING TECHNOLOGY on May 22, 2007 set of genes may not necessarily correlate with the corre- tides and fragments, thereby improving sensitivity. sponding protein abundance. This failure was illustrated by a A traditional approach to determine the relative quantities of study involving the effect of carbon source perturbation on peptides (or proteins) in a complex mixture involves using steady-state gene expression in Saccharomyces cerevisiae. stable isotope-labeled peptides. This technique allows direct The authors reported that growing S. cerevisiae on either correlation of the naturally occurring peptide to its stable galactose or ethanol resulted in significant differences be- isotope-labeled analog (15–17). In these studies, an amino tween the abundance ratio of the mRNA and the correspond- acid labeling strategy is incorporated into the protocol in ing protein products (8). Several other studies have demon- which one of the biological samples is treated with the light strated the poor correlation between the relative abundance isotope form of the chemical labeling reagent, and the other of a transcript and the corresponding protein (9, 10). To fully sample is treated with the heavy isotope form of the labeling understand the cellular physiology of a particular organism or reagent. When the samples are mixed and analyzed by LCMS, disease state, a comprehensive analytical survey of the cell labeled peptide pairs from the two samples can be differen- must be completed. The information gathered by compiling tiated in the mass spectrometer by the virtue of their mass data gained from multiple bioanalytical approaches (i.e. tran- difference. The ratio of the signal intensities of the light to script, protein, and metabolite levels to name a few) on an heavy peptide derivatives of the peptide pairs reflects the organism in a variety of physiological states is the basis of the abundance ratio for the originating protein in the two different discovery science approach referred to as systems biology. biological samples. Although this quantitative strategy is a Combining data for such a systems analysis leads to a degree useful method for determining the relative abundance of pro- of understanding in which “the whole is greater than the sum teins between different samples, it can involve complex of the parts.” chemistry and require expensive reagents, and it is not par- Many studies involving analysis of complex protein mix- ticularly amenable to large scale relative quantitation studies. tures have been accomplished by combining the well estab- In this study, we used a simple, gel-free, label-free LCMS lished separation capabilities of two-dimensional (2D)1 PAGE approach for qualitative and quantitative proteomic analysis with mass spectrometry-based sequence identification of se- (13). This investigation involved the study of E. coli grown with lected, semipurified proteins (11). Although this technique is single, specific carbohydrates. This approach provides an often applicable to comparative proteomics, 2D PAGE is no- excellent model system to study subtle differences in the toriously insensitive to proteins that are not soluble during the microbial proteome because there is a controlled environment isoelectric focusing stage of the separation. Moreover the in which only one parameter is varied. Using E. coli to better staining methods required to visualize the proteins impose understand metabolic pathways and characterize previously restraints on dynamic range and detection limits. Despite unknown proteins helps validate this methodology and could two-dimensional separation of the intact proteins, individual lead to the discovery of novel antibiotics when applied to related gel spots often contain many proteins, affecting the resulting virulent microbes. The results of this study correlate well with quantitative analysis. This problem is exacerbated by the the known carbon source biochemistry and molecular biology of E. coli. The ease of use and efficiency of this new technique 1 The abbreviations used are: 2D, two-dimensional; MSE, elevated is demonstrated by the comparability of the results with those energy MS; PLGS, ProteinLynx Global Server; RSD, relative standard obtained from existing gene profiling and more traditionally deviation; AMRT, accurate mass, retention time detection; PMF, pep- obtained proteomic data available in the literature (7, 18). tide mass fingerprint; DGAL, D-galactose-binding periplasmic protein; MDH, malate dehydrogenase; SIC, selected ion chromatogram; CI, MATERIALS AND METHODS confidence interval; ACS, acetyl-CoA synthetase; PGI, phosphoglu- cose isomerase; 2DGE, 2D gel electrophoresis; BPI, base peak Media and Growth Conditions—Frozen E. coli (ATCC10798, K-12) intensity. cell stocks were streaked onto Luria-Bertani (LB) plates and grown at 590 Molecular & Cellular Proteomics 5.4
- 3. E. coli Proteome Analysis 37 °C. An individual colony was subsequently streaked onto M9 1.85 s with a 0.15-s interscan delay. In low energy MS mode, data minimal medium plates supplemented with 0.5% sodium acetate and were collected at a constant collision energy of 10 eV. In MSE mode, incubated at 37 °C. Seed cultures were generated by transferring collision energy was ramped from 28 to 35 eV during each 1.85-s data single colonies into flasks of M9 minimal medium supplemented with collection cycle. One cycle of MS and MSE data was acquired every 0.5% sodium acetate. Seed culture flasks were shaken at 250 rpm at 4.0 s. The radio frequency applied to the quadrupole mass analyzer 37 °C until midlog phase (A600 0.9 –1.1). The seed culture was was adjusted such that ions from m/z 300 to 2000 were efficiently diluted 1 ml to 500 ml into separate M9 minimal media supplemented transmitted, ensuring that any ions observed in the LC/MSE data less with one of three carbon sources (0.5% glucose, 0.5% lactose, or than m/z 300 were known to arise from dissociations in the collision 0.5% sodium acetate). Flasks were shaken at 250 rpm at 37 °C until cell. midlog phase (A600 0.9 –1.1) and then harvested by centrifugation Data Processing and Protein Identification—The continuum LCMSE (5,000 g for 15 min). Culture medium was discarded, and the cells data were processed and searched using ProteinLynx Global Server were frozen at 80 °C until needed for protein extract preparation. (PLGS) version 2.2. The resulting peptide and protein identifications Protein Extract Preparation—Frozen cells were suspended in 5 ml were evaluated by the software using statistical models similar to those of lysis buffer (Dulbecco’s phosphate-buffered saline 1⁄100 protease described by Skilling et al. (20). Results from replicate injections were inhibitor mixture (Sigma catalog number 8340))/1 g of biomass in a collated for quantitative analysis to determine the relative -fold change 50-ml Falcon tube. The cells were lysed by sonication in a Microson using the glucose condition as the control experiment. Protein identifi- Downloaded from www.mcponline.org at CELL SIGNALING TECHNOLOGY on May 22, 2007 XL ultrasonic cell disrupter (Misonix, Inc.) at 4 °C. The cell debris were cations were assigned by searching an E. coli protein database using removed by centrifugation at 15,000 g for 30 min at 4 °C. The the precursor and fragmentation data afforded by the LCMS acquisition resulting soluble protein extract was dispensed into 1.0-ml cryotubes method. The search parameter values for each precursor and associ- and stored at 80 °C for subsequent analysis. ated fragment ion were set by the software using the measured mass SDS-PAGE Analysis of Protein Extracts—Each protein sample was error and intensity error obtained from processing the raw continuum denatured and reduced using a standard PAGE loading buffer mixture data. The mass error tolerance values were typically under 5 ppm. containing 1.0% SDS and 10 mM DTT. The denatured protein sam- Peptide identifications were restricted to tryptic peptides with no more ples were run in a Bio-Rad Criterion gel apparatus into a 12% poly- than one missed cleavage and cysteine carbamidomethylation. The ion acrylamide gel at 160 V for 1 h. The polyacrylamide gel was stained detection, clustering, and normalization were processed using PLGS as with Coomassie Blue using standard protocols. described earlier (13). Additional data analysis was performed with Protein Digest Preparation—Approximately 250 g of total E. coli Spotfire Decision Site 7.2 and Microsoft Excel. protein was suspended in 100 l of 50 mM ammonium bicarbonate Due to the nature of the alternate scanning acquisition method, (pH 8.5) containing 0.05% Rapigest (19). Protein was reduced in the fragment ions produced from any given precursor will have the same presence of 10 mM dithiothreitol at 60 °C for 30 min. The protein was chromatographic profile and apex retention time as the originating alkylated in the dark in the presence of 30 mM iodoacetamide at room precursor ion. The data processing software produces an inventory of the measured monoisotopic mass of each detected precursor and temperature for 30 min. Proteolytic digestion was initiated by adding fragment ion. The chromatographic peak area, chromatographic peak modified trypsin (Promega) at a concentration of 50:1 (E. coli protein shape, combined charge state, and the apex retention time are also to trypsin) and incubated at 37 °C overnight. Tryptic digestion was provided for each corresponding precursor and fragment ion. The terminated by diluting 1:1 with water and freezing immediately at chromatographic peak area is determined from the combined inten- 80 °C. The tryptic peptide solution (1.25 g/ l total protein) was sity of all the isotopes for all of the charge states associated to each centrifuged at 10,000 g for 10 min, and the supernatant was precursor. Fragment ions are assigned to a parent precursor only if transferred into an autosampler vial for peptide analysis via LCMS. their apex retention times are within plus or minus the time associated HPLC Configuration—Capillary liquid chromatography of tryptic with one acquisition scan (i.e. alternate scanning cycle). In these peptides was performed with a Waters CapLC system equipped with experiments, because the alternate scanning cycle time was 2 s, the a Waters NanoEaseTM AtlantisTM C18, 300- m 15-cm reverse ions found in the elevated energy channel to within 0.05 min of a phase column. The aqueous mobile phase (mobile phase A) con- given precursor were assigned as associated fragments. tained 1% acetonitrile in 0.1% formic acid. The organic mobile phase A qualitative analysis of a protein mixture may produce instances (mobile phase B) contained 80% acetonitrile in 0.1% formic acid. where more than one precursor ion can be found at the same apex Samples (5- l injection, digested equivalent to 6.25 g of total pro- retention time. In this instance, the fragmentation data associated tein) were loaded onto the column with 6% mobile phase B. Peptides with a specific moment in time is shared among more than one were eluted from the column with a gradient of 6 – 40% mobile phase co-eluting precursor ion; however, it is important to remember that B over 100 min at 4.4 l/min followed by a 10-min rinse of 99% of precursor and fragment ion data are acquired at high mass accuracy mobile phase B. The column was immediately re-equilibrated at initial ( 5 ppm). At 5-ppm mass accuracy, there is enough mass specificity conditions (6% mobile phase B) for 20 min. The lock mass, to resolve associated fragment ions with their appropriate precursor [Glu1]fibrinopeptide at 100 fmol/ l, was delivered from the auxiliary ion for a subsequent accurate mass stringent database search. With pump of the CapLC system at 1 l/min to the reference sprayer of the this level of mass accuracy and the ability to obtain time-resolved NanoLockSprayTM source. All samples were analyzed in triplicate. mass measurements, confident identifications can be made in the Mass Spectrometer Configuration—Mass spectrometry analysis of instances of co-eluting peptides. tryptic peptides was performed using a Waters/Micromass Q-TOF In instances where data from multiple injections of the same sam- Ultima API system. For all measurements, the mass spectrometer ple have been collected, the methodology utilizes chromatographic was operated in V-mode with typical resolving power of at least and analytical reproducibility to help confidently assign fragments to 10,000. All analyses were performed using positive mode ESI using a co-eluting precursors. A more thorough description of how the algo- NanoLockSpray source. The lock mass channel was sampled every rithms are used to “clean” the fragmentation data will be described in 30 s. The mass spectrometer was calibrated with a [Glu1]fibrino- future work.2 peptide solution (100 fmol/ l) delivered through the reference sprayer of the NanoLockSpray source. Accurate mass LCMS data were col- lected in an alternating, low energy (MS) and elevated energy (MSE) 2 J. C. Silva, C. Dorschel, M. V. Gorenstein, G.-Z. Li, and S. J. mode of acquisition. The spectral acquisition time in each mode was Geromanos, manuscript in preparation. Molecular & Cellular Proteomics 5.4 591
- 4. E. coli Proteome Analysis Peptide Clustering and Data Normalization—Identical peptides detections and the intensity sums ranged from 1.3 to 8.5% from each of the replicate injections for all conditions were clustered and from 3.1 to 5.7%, respectively. These RSDs indicate an by mass precision (typically 10 ppm) and a retention time tolerance (typically 0.25 min) using the PLGS clustering software. The clus- acceptable degree of reproducibility of the data for the repli- tered peptide data set was exported from PLGS and further evaluated cate injections of the three different growth conditions. with Excel and Spotfire. For each condition, those ion detections that As a quality control measure, an external standard of a occurred only in one of the three replicate injections were considered five-protein mixture (bovine albumin, bovine hemoglobin, as noise and discarded from further analysis. The LCMS data were yeast enolase, yeast alcohol dehydrogenase, and rabbit normalized to peptides originating from TUFA prior to determining the relative quantitation of identified proteins across the various condi- phosphorylase B) was analyzed at the beginning, in the mid- tions. The details regarding the normalization strategy is described dle, and at the end of the E. coli sample analysis. These later in greater detail under “Results and Discussion.” proteins were injected at 750 fmol. The standard protein mixture is incorporated as a performance check during the RESULTS AND DISCUSSION data acquisition portion of the study to help verify that the LC A standard PAGE analysis was performed on the soluble and MS systems are performing within acceptable specifica- Downloaded from www.mcponline.org at CELL SIGNALING TECHNOLOGY on May 22, 2007 protein extracts from E. coli grown on three different carbon tions. Significant deviations in retention time reproducibility, sources. The protein loading was controlled to ensure that an signal intensity, mass resolution, and mass accuracy indicate equal amount of total protein from each condition was applied that the LCMS system should be inspected for faults. Re- onto the gel. Two aliquots of total protein were loaded to peated injections of this standard protein mixture have set obtain better resolution of the most abundant proteins. The expected criteria for the mass spectrometer and the ion de- protein profile patterns illustrated in Fig. 1A reveal similar tection software. In a single injection of this simple protein patterns for the glucose and lactose growth conditions but a mixture, 240 accurate mass, retention time detections (AM- distinct pattern difference between the acetate growth con- RTs) are obtained. Approximately 75% of the 240 time-re- dition and the other two growth conditions. solved mass measurements can be assigned to tryptic frag- The soluble protein extracts from each of the three growth ments of the five standard proteins, constituting 85% of the conditions were treated with trypsin, and the resulting peptide total detected intensity. These identifications do not take into mixtures were analyzed by LCMSE. Fig. 1B illustrates the BPI account any post-translational modifications that may be and the total ion chromatograms from the low energy and present other than carbamidomethyl cysteine and may ac- elevated energy MS data acquisition for each condition, re- count for a few of the unidentified AMRTs. Upon analysis of a spectively. Inspection of the BPI chromatograms indicates lower level of the protein standard ( 5-fold dilution), 40 AM- that the similarity between the glucose and lactose conditions RTs are observed from the peak detection software, 36 of is also observed at the level of the tryptic peptides. In addi- which are a subset of the 240 AMRTs found in the higher tion, the distinction between the acetate condition and the concentration standard protein mixture. Approximately 77% other two carbon sources is evident. The LCMSE data from of the 40 time-resolved mass measurements in the lower each condition were processed using the Protein Expression concentration sample can be assigned to tryptic fragments of software to produce an inventory of peptides that can be used the five standard proteins, constituting 85% of the total to determine the relative abundance of peptides/proteins detected intensity. By extension, it may be assumed that a across multiple conditions. The complexity of the samples are similar plurality of ions detected from any mixture of tryptic illustrated in Fig. 1C, which displays 8000 observed mo- peptides represents actual peptide detections. The statistics noisotopic masses for each of the extracted peptide compo- associated with the accounting of the peptide detections (“ion nents (MH ) as a function of the observed retention time for accounting”) observed from the analysis of the protein stand- each condition. The alternate scanning mode of the LCMS ard described above illustrates the robustness of the peak data acquisition is configured to detect the precursor pep- detection software and the lack of carryover from previous tides in the low energy channel while simultaneously obtaining injections. The list of precursors from the standard protein the data from associated fragments for subsequent structural mixture has been provided in the supplemental data (Supple- determination of each precursor. mental Tables 1 and 2). Ion Detection—Replicate injections of tryptic peptides from The peak detection software is designed to interrogate both soluble E. coli protein preparations were processed with the the low and elevated energy channels and produce an ion list Protein Expression software, creating an inventory of the pep- for only those m/z detections that produce a chromatographic tides obtained from the low energy data acquisition for each apex. Any m/z detections that occur at a constant back- growth condition. Table I lists the number of peptide detec- ground level (i.e. solvent-related ions or column matrix-asso- tions and summed ion intensities for each injection of the ciated ions) do not appear in the resulting ion lists and will acetate, lactose, and glucose growth conditions. An average therefore not interfere with subsequent protein identification of 8102, 7959, and 8437 peptides were found in the acetate, and/or quantitation. lactose, and glucose growth conditions, respectively. The Clustering Peptide Components across Multiple Condi- relative standard deviations (RSDs) for the number of peptide tions—After obtaining the inventory of the detected peptides 592 Molecular & Cellular Proteomics 5.4
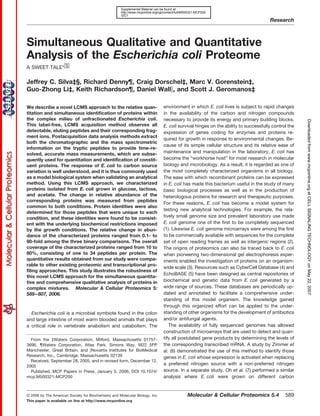
- 5. E. coli Proteome Analysis Downloaded from www.mcponline.org at CELL SIGNALING TECHNOLOGY on May 22, 2007 FIG. 1. An overview of the analysis of E. coli. A, an SDS-PAGE analysis of the soluble protein generated from E. coli grown in minimal media with acetate (ACE), lactose (LAC), and glucose (GLU). Lane 4 contains the following protein molecular mass markers: 250, 150, 75, 50, 40, 25, 20, 10, and 5 kDa. Lanes 1–3 illustrate 7.5 l of the whole-cell protein extract directly after sonication. Lanes 5–7 and lanes 8 –10 illustrate 7.5 and 2.5 l of soluble protein after removing the cell debris by centrifugation, respectively. B, the BPI of a single alternate scanning LCMS acquisition (LCMSE) of E. coli from each growth condition. Each LCMSE experiment contains a low energy (LE) function for the intact peptides and an elevated energy (EE) function for the associated fragment ions. C, an overlay of the deisotoped and charge state-reduced monoisotopic mass (0 –5000 amu) and apex retention time (10 –100 min) of the extracted peptides obtained from the acetate (yellow), lactose (red), and glucose (blue) experiments. The average monoisotopic mass and retention time are plotted for the replicate analysis of each condition. D, an overlay plot of the monoisotopic mass (1450 –1675 amu) and apex retention time (29.5–32.0 min) of the extracted peptides from each condition represented within the gray box in Fig. 4C. from the replicates of each growth condition, the individual trometer and retention time reproducibility obtained from the peptide lists from each of the E. coli samples were organized chromatography to cluster the identical peptides across the into a single matrix such that identical peptides were grouped entire experiment. The details of the clustering algorithm can across the entire experiment (replicate injections of multiple be found in the work of Silva et al. (13). conditions) for subsequent quantitative analysis. The cluster- After clustering the peptides from the entire study, the ing algorithm utilizes the mass precision of the mass spec- replication of each peptide within each condition was deter- Molecular & Cellular Proteomics 5.4 593
- 6. E. coli Proteome Analysis TABLE I Summary of extracted peptides from E. coli grown in acetate, lactose, and glucose Injection Average CVa 1 2 3 % Acetate Peptide detections 8218 8083 8006 8102 1.3 Summed intensity 1.2218E 08 1.2182E 08 1.2872E 08 1.2424E 08 3.1 Lactose Peptide detections 8357 7174 8347 7959 8.5 Summed intensity 9.9716E 07 9.3929E 07 1.0528E 08 9.9642E 07 5.7 Glucose Peptide detections 8561 8634 8115 8437 3.3 Summed intensity 1.9119E 08 1.7317E 08 1.8895E 08 1.8444E 08 5.3 a Coefficient of variation. Downloaded from www.mcponline.org at CELL SIGNALING TECHNOLOGY on May 22, 2007 TABLE II Summary of the replication of detected peptides from E. coli grown in acetate, lactose, and glucose Number of Fraction of Total detected Fraction of total detections total detections intensity detected intensity % % Acetate Replication One out of three injections 4,675 19.2 1.4438E 07 3.9 Two out of three injections 5,328 21.9 2.3479E 07 6.3 Three out of three injections 14,304 58.8 3.3480E 08 89.8 Total detections/intensity 24,307 3.7272E 08 In at least two out of three injections 19,632 80.8 3.5828E 08 96.1 Lactose Replication One out of three injections 4,795 20.1 1.3788E 07 4.6 Two out of three injections 5,226 21.9 2.0368E 07 6.8 Three out of three injections 13,857 58.0 2.6477E 08 88.6 Total detections/intensity 23,878 2.9893E 08 In at least two out of three injections 19,083 79.9 2.8514E 08 95.4 Glucose Replication One out of three injections 5,117 21.4 1.8925E 07 3.7 Two out of three injections 5,891 24.7 3.2173E 07 6.3 Three out of three injections 14,614 61.2 4.5989E 08 90.0 Total detections/intensity 25,622 5.1099E 08 In at least two out of three injections 20,505 85.9 4.9206E 08 96.3 mined. Those peptides that only occurred once in each rep- dependent upon a peptide enrichment strategy, it is unlikely licate analysis set (one of three) were regarded as background that we are losing important qualitative information because ions and were removed from consideration. Only those pep- there are many tryptic peptides available for the subsequent tides that were found in at least two of the three injections identification of the constituent proteins. Similar results were were used for analysis. For the acetate condition, the dis- observed for the other two growth conditions. carded components corresponded to approximately 19% of Data Normalization—Normalization of the data is required the total ion detections (peptides) but only represented 4% of for meaningful quantitative results. This can be accomplished the total detected intensity from the acetate condition (Table in a variety of ways. In instances where not many proteins are II). These statistics are consistent with the notion that these affected by a given perturbation, an autonormalization routine discarded peptides are among the low intensity detections is an appropriate means of normalizing the data across many that occur at nearly the limit of detection of the instrument. different samples. In this type of normalization routine the Because the peptides observed at this detection range are data are normalized to the intensity of the many qualitatively more likely to cause spurious quantitative results and provide matched proteins (or peptides) that are found through statis- less structural information, they are discarded from further tical analysis not to change between the two conditions. analysis. Keeping in mind that this particular analysis is not However, in instances where there are dramatic qualitative 594 Molecular & Cellular Proteomics 5.4
- 7. E. coli Proteome Analysis and quantitative changes such as those observed between glucose and acetate or lactose and acetate, it may not be the best normalization strategy. The dramatic changes due to the various conditions are illustrated later in Fig. 3 (D, F, and H). Comparing the glucose and lactose conditions, the histogram of the intensity ratios of the matched peptides indicates that not many peptides, or originating proteins, change between the two conditions. Approximately 4000 AMRTs are found within the center four bins of the histogram (Fig. 3D). How- ever, in the case of either acetate versus glucose or acetate versus lactose, there are far fewer AMRTS ( 800, Fig. 3, F and H) that are found within the center four bins of the histogram, indicating that many proteins are changing between the two Downloaded from www.mcponline.org at CELL SIGNALING TECHNOLOGY on May 22, 2007 conditions. Given the dramatic changes observed among the three different growth conditions, we opted to normalize to a single protein that did not change among the three conditions prior to determining the relative protein changes among the different conditions. Considering the apparent consistency of the peptide levels of protein chain elongation factor Ef-Tu (TUFA) in the three samples and the substantial number of identified peptides to the protein ( 60% sequence coverage), it was selected as the target protein for normalization across the three different conditions. Before normalizing the samples across the entire set of experiments, the intensity measure- ments from the raw data indicated that the relative intensity ratios of the TUFA peptides varied by less than 30%. After normalization, this variability was reduced to below 20%. All the observed intensity measurements were scaled to the summed intensity of the TUFA peptides found to be common to each condition. Using this normalization strategy, we were able to correct for injection variability within each condition and also for variation in protein load among all conditions. The monoisotopic masses and retention times of the peptides used for normalization were: 1027.5585 (37.21 min), 1171.6598 (41.97 min), 1187.5300 (33.78 min), 1214.6366 (47.77 min), 1303.7826 (70.87 min), 1780.9388 (64.19 min), 1795.9577 (13.71 min), 1803.8827 (32.27 min), 1964.9721 (63.57 min), and 2117.1521 (91.80 min). The validated mass spectrum for three of these peptides is provided in the sup- plemental data (Supplemental Fig. 1). Analytical Reproducibility—Before conducting the relative protein profiling analysis among the three different growth grown in minimal medium with acetate as the sole carbon source. B, a histogram plot of the relative standard deviation of the measured signal intensity (coefficient of variation of replicate intensity measure- ments) for those clustered peptide components that replicated in at least two of the three injections of the tryptic peptides generated from the soluble protein of E. coli grown in minimal medium with acetate as the sole carbon source. C, a histogram plot of the relative standard deviation of the measured retention time obtained from the clustered FIG. 2. Analytical statistics from the replicate LCMSE analysis of peptide components that replicated in at least two of the three injec- E. coli grown in acetate. A, a histogram plot of the mass precision of tions of the tryptic peptides generated from the soluble protein of the clustered peptide components from the replicate LCMSE analysis E. coli grown in minimal medium with acetate as the sole carbon of the tryptic peptides generated from the soluble protein of E. coli source. Molecular & Cellular Proteomics 5.4 595
- 8. E. coli Proteome Analysis Downloaded from www.mcponline.org at CELL SIGNALING TECHNOLOGY on May 22, 2007 FIG. 3. Differential protein expression of E. coli grown on glucose, lactose, and acetate from replicate LCMSE experiments. Scatter plots (A, C, E, and G) and corresponding histogram plots (B, D, F, and H) of the natural logarithm of the average intensity ratios of matching peptides among the three different growth conditions. Multiple peptides corresponding to a subset of identified proteins are highlighted in the 596 Molecular & Cellular Proteomics 5.4
- 9. E. coli Proteome Analysis Downloaded from www.mcponline.org at CELL SIGNALING TECHNOLOGY on May 22, 2007 FIG. 4. Utilization of glucose, lac- tose, and acetate by E. coli. Illustration of the biochemical pathways and their corresponding enzymes required for uti- lization of glucose, lactose, and acetate by E. coli. Lactose catabolism includes those enzymes between lactose and -D-glucose. Glycolysis includes those enzymes between -D-glucose and acetyl-CoA. The citric acid cycle and glyoxylate shunt include those enzymes after acetyl-CoA. Acetate utilization in- cludes those enzymes between acetate and acetyl-CoA. The gene/protein name and Blattner number is provided through- out the biosynthetic scheme. conditions, a variety of quality control measures were per- pression software as a comma-delimited text file containing formed on the replicates of each condition to determine the all of the mass spectrometric and chromatographic attributes analytical reproducibility of the analysis. The final results from for each peptide component along with all the statistical cal- the clustering algorithm were exported from the Protein Ex- culations generated after the clustering process. This clus- scatter plot for each binary comparison. The standard deviation (StDev) for the ln(average intensity ratio) of the matched peptides is indicated in the histogram plot for each corresponding binary comparison. A, the ln(average intensity ratio) of matched peptides between two replicate injections of E. coli grown in acetate. C, lactose versus glucose: red, LACZ; blue, GALT; yellow, GALD; black, GALM; green, DGAL; and pink, TUFA. E, acetate versus glucose: green, ACEA; yellow, ACS; red, SUCC; blue, SUCD; and black, THRC. G, acetate versus lactose: yellow, ACEA; black, MDH; blue, GALM; and red, GALE. Unique peptides to each condition are indicated at the extreme values in both the scatter plot (top numerator, bottom denominator) and histogram (left numerator, right denominator) plots. Ace, acetate; Lac, lactose; Glu, glucose. Molecular & Cellular Proteomics 5.4 597
- 10. E. coli Proteome Analysis tered data file was imported into Microsoft Excel to determine served between the those two conditions. Fig. 3, C, E, and G, a number of data quality control measures and into Spotfire display the relative -fold change observed for the matching Decision Site to visualize the reproducibility of the analysis of peptide components among the three different growth con- each sample. ditions. Given these plots, those peptides whose intensities The parameters used for the clustering of identical peptides change significantly between conditions can be quickly iden- throughout an experiment rely on the inherent reproducibility tified. Fig. 3, C, E, and G, clearly show the large variation of the instruments used to obtain the data. Specifically the between the acetate and the other two growth conditions as clustering algorithm utilized the analytical reproducibility of compared with the small variation observed between glucose the mass measurement and the reproducibility associated and lactose. The dramatic effect can be explained by the with the chromatographic retention time measurement of overall metabolic adjustments that E. coli must implement to each peptide. The mass precision error obtained from the utilize the three different carbon sources (Fig. 4). The similarity extracted peptide components was typically within 5 ppm of in peptide expression levels between glucose and lactose can the mean mass measurement. This is illustrated in Fig. 2A and be rationalized by the nature of the two carbon sources. Downloaded from www.mcponline.org at CELL SIGNALING TECHNOLOGY on May 22, 2007 demonstrates the robustness of the ion detection software Lactose is a disaccharide of glucose and galactose. Growth and the stability of the mass measurement instrumentation. on lactose requires that E. coli express a series of proteins to The variability of the quantitative intensity measurements transport and hydrolyze the disaccharide to its corresponding among the replicate injections obtained from the Protein Ex- monosaccharides. Further a series of enzyme-catalyzed re- pression software is summarized in Fig. 2B. These results actions are required to activate and epimerize galactose to indicate that the average and median RSD among the repli- glucose, a preferred carbon source for E. coli. Glucose is cate injections was 15.6 and 20.2%, respectively. Fig. 2C catabolized through glycolysis and the citric acid cycle to illustrates the reproducibility of retention times during this provide the primary metabolites for essential building blocks study where the RSD was typically less than 1.3%. These and production of energy. Acetate is a simple carbon source observations are consistent with Protein Expression results that initially bypasses glycolysis and enters into a modified reported previously (13, 21). The low analytical variability as- version of the citric acid cycle, the glyoxylate shunt, to provide sociated with the replicate injections demonstrates the ro- the necessary primary metabolites and energy to support bustness of the method and provides the measure of confi- growth. dence needed to proceed onto the comparison of the paired The ability to cluster identical peptide components and conditions for quantitative protein profiling analysis. quantitatively compare them across multiple conditions pro- The intensity variation of this analytical method can be vides an analytical means to group related peptides within a assessed by conducting binary comparisons of the intensity given protein profiling experiment. A set of peptides within a measurements of the matched peptide components for each determined -fold change range should originate from a limited replicate injection. Fig. 3A illustrates the scatter plot of the subset of the proteins in the natural proteome. If the relative binary comparison of two replicate injections from the acetate abundance of a protein changes between two conditions, it condition. Fig. 3B presents the same data as a histogram plot then follows that the relative abundance of tryptic peptides of the intensity ratios of the matched peptides demonstrating originating from the same protein will reflect the same degree that the majority of the matched peptides have intensity ratios of differential expression between two conditions. This meth- close to unity. Ideally the binary comparisons would lie on a odology does not require isotope-labeled affinity tags or any horizontal line (ln(ratio) 0) with minimal deviation throughout other enrichment or labeling strategy. In fact, it is desirable not the signal detection range. The data do produce a close fit to to enrich for specific peptides because one can take advan- this horizontal line with the smallest deviation between tage of the multiple peptide measurements for any particular matched peptides of higher abundance. These plots are use- protein when determining its relative abundance. This quan- ful because they illustrate what one would expect to see if titative comparison allows one to execute a peptide mass there were no apparent changes between any two conditions. fingerprint (PMF) search with a 5-ppm mass tolerance using The standard deviation associated with the intensity ratios of a subset of the peptides matched between two conditions for the matched peptides between two replicate injections from subsequent peptide/protein identification. The quantitative in- the acetate growth condition was determined to be 0.22. formation provided by this analysis in conjunction with a PMF Similar standard deviations were observed from replicate in- search is a powerful approach to help identify proteins from jections of the other two conditions and are indicative of the such complicated LCMS data. Because the data have been variability associated with the analytical method. acquired in alternate scanning mode, each tryptic peptide has Clustering Peptides by Mass, Retention Time, and -Fold associated fragmentation data that can be used for independ- Change—After grouping identical peptides by their observed ent identification and validation of this complementary ap- mass and retention time within a given condition, the peptide proach. The details regarding how the identification of pep- intensity ratios from any two conditions can be displayed to tides are generated from the associated fragmentation data reflect the relative quantitative difference (-fold change) ob- are discussed later in the text. 598 Molecular & Cellular Proteomics 5.4
- 11. E. coli Proteome Analysis Fig. 3C is a scatter plot of the 5983 matched peptides simplifies the overall strategy and greatly reduces the time between the glucose and lactose growth conditions of E. coli. and effort required to collect and manage the digitized sample Six sets of tryptic peptides have been highlighted to illustrate information. A more thorough discussion of the quantitative a subset of the proteins that have been identified by PLGS and qualitative results and its correlation to the different using both precursor and fragmentation data afforded by the growth conditions is discussed later. LCMSE analysis. The standard deviation associated with the Simultaneous Peptide Sequence Identification by LC- intensity ratios, ln(ratio), of the matched peptides between the MSE—To demonstrate the simultaneous qualitative capabili- two conditions was shown to be 0.25, slightly higher than that ties of the alternate scanning mode of data acquisition, a total observed for two replicate injections of the acetate sample of seven selected ion chromatograms (SICs) from the raw, (0.22, Fig. 3A). A total of nine peptides lie within a -fold change continuum LCMSE data from a single analysis of the acetate range of 1.04 ln(ratio) 1.73. When these peptides are condition are illustrated in Fig. 5. The top SIC is of the doubly submitted for an accurate mass PMF search against the entire charged precursor m/z 945.664 of the GYINSLGALTG- E. coli protein database, allowing for one missed cleavage, GQALQQAK peptide (1890.0220 MH ) from ACEA obtained Downloaded from www.mcponline.org at CELL SIGNALING TECHNOLOGY on May 22, 2007 the results return six peptides (highlighted in green) matching in the low energy channel (function 1) whose apex retention to DGAL (D-galactose-binding periplasmic protein) within a time is 57.14 min. The six remaining SICs correspond to 5-ppm mass error tolerance and providing 29% protein se- fragments ions of the peptide from ACEA obtained in the quence coverage. Because DGAL is up-regulated in the lac- elevated energy channel (function 2) during the LCMSE acqui- tose growth condition, one would expect to find additional sition. Specifically these SICs correspond to the y4, y8, y9, tryptic peptides unique to that condition. An additional 13 y11, y12, and y13 fragments of the ACEA peptide. The chro- peptides are found to DGAL that are unique to the lactose matographic profiles of these fragment ions are illustrated in condition, increasing the final protein sequence coverage to Fig. 5 and are all shown to apex (57.17 min) within one scan 65%. The alternate scanning data acquisition mode (LCMSE) (0.03 min) of the originating precursor peptide. This demon- provides supporting sequence information from the associ- strates the basic premise of alternate scanning LCMSE: the ated fragment ions collected in the elevated energy function chromatographic profiles of product (fragment) ions must ex- experiment to provide structural validation of a majority of the actly parallel the profile of the precursor with peak apices 19 peptides. The validated mass spectrum for three of these matching within one MS scan of the originating precursor. The peptides is provided in the supplemental data (Supplemental Protein Expression software converts the continuum LCMSE Fig. 2). data into an inventory of time-resolved mass measurements The data plotted in Fig. 3E indicate a greater degree of of the detected peptides (precursors) from the low energy dissimilarity between the two conditions (acetate and glu- channel aligned with their corresponding fragment ions in the cose), reflected in the higher standard deviation value (0.98). elevated energy channel. The information provided in the list Here for example, of the 13 peptides in the range 4.10 of peptides includes the deisotoped and charge state-re- ln(ratio) 5.03, there are six peptides that are identified to duced monoisotopic mass measurement, the corresponding ACEA (isocitrate lyase, 18% protein sequence coverage) deconvolved intensity measurement, the measured apex re- within a mass error tolerance of 5 ppm. An additional 15 tention time, and the average charge state. The time-resolved peptides to ACEA were unique to the acetate condition, in- mass measurement data obtained in the elevated energy creasing the final protein sequence coverage to 61%. Again channel associated with the m/z 1890.0220 precursor at the sequences of the majority of the peptides were validated 57.14 min can be seen in the lower panel of Fig. 5. This by the elevated energy data acquired in the alternate scanning illustration shows how the LCMSE method enables one to mode (Supplemental Fig. 3). simultaneously perform quantitative and qualitative character- Fig. 3G illustrates the matched peptides of the acetate and ization of detected peptides. lactose growth conditions and highlights those peptides iden- The identification of peptides and proteins is carried out tified to isocitrate lyase, malate dehydrogenase, UDP-glu- using a probabilistic peptide fragmentation model in which cose-4-epimerase, and aldolase-1-epimerase (ACEA, MDH, the framework of the model has been tuned using a range of GALE, and GALM, respectively). The standard deviation as- well characterized samples. The fragmentation data are dei- sociated with the intensity ratios of the matched peptides sotoped and charge state-reduced using a maximum likeli- between these two conditions was determined to be 1.01, hood algorithm to provide lock mass-corrected, monoisotopic similar to that observed in the comparison of the peptides mass measurements for the subsequent database search common between the acetate and glucose growth conditions. (20). The calculation of likelihood is based on a probabilistic The treatment of this data is similar to the approach of Con- summation over all of the possible ways a given peptide could rads et al. (22); however, the method in this study uses a fragment and give rise to trial masses. Observed masses are single experiment to provide both the qualitative and quanti- compared with a database containing probabilistic informa- tative information for each of the constituent proteins. Having tion about peptide fragmentation patterns based on empirical the ability to conduct these experiments using one instrument observation. A Markov chain model has been used to de- Molecular & Cellular Proteomics 5.4 599
- 12. E. coli Proteome Analysis Downloaded from www.mcponline.org at CELL SIGNALING TECHNOLOGY on May 22, 2007 FIG. 5. Peptide identification from an LCMSE analysis. A, an SIC of the doubly charged m/z 945.664 precursor peptide ion from the low energy channel (function 1) with an apex retention time of 57.14 min and six associated fragment ions (m/z: 1242.928, 1185.882, 1114.855, 900.662, 843.637, and 474.354) from the elevated energy channel (function 2) that all chromatographically apex at 57.17 min. The delta retention time lies within one scan, 0.03 min. B, the time-resolved fragment ions from the doubly charged m/z 945.664 precursor peptide (lock mass-corrected monoisotopic mass 1890.0220) identified as the GYINSLGALTGGQALQQAK peptide from isocitrate lyase, ACEA. scribe a number of attributes that influence the probability of used to identify differentially abundant peptides belonging to peptide identification. These parameters include the expected a simple set of proteins spiked into a background of human appearance of a series of b and y ions, an amino acid under- serum (13). The intent of that study was demonstration of the going a specified neutral loss, and specific cleavages to occur ability to use accurate mass LCMS of intact peptides (precur- on the C- or N-terminal side as well as the formation of sor information) as a primary tool for quantitative and subse- specific immonium ions. A more thorough explanation of this quent qualitative peptide/protein analysis. We now apply this algorithm has been described by Skilling et al. (20). methodology using both precursor and concurrent fragment Protein Profiling of E. coli among the Different Carbon ion information to monitor the specific metabolic differences Sources—In previous work, we have shown how accurate between the three E. coli samples comprising our biological mass and retention time measurements of peptides could be model. 600 Molecular & Cellular Proteomics 5.4
- 13. E. coli Proteome Analysis FIG. 6. Differential expression of peptides and proteins. A, the results from the clustered peptides illustrates that identified peptides corresponding to differentially expressed proteins have expression ratios within a narrow range. The relative expression of the protein can be determined from these multiple Downloaded from www.mcponline.org at CELL SIGNALING TECHNOLOGY on May 22, 2007 peptide ratios, providing a measure of confidence for each identified protein. B, the multiple peptide measurements to each protein provide a means to obtain a 95% confidence interval for the relative expression measurement for each binary comparison. The pattern obtained from the relative abundance of each protein from each condition provides a mecha- nism to group related proteins according to their response to the applied pertur- bation. Ribosomal proteins RL1 and RS1 show a pattern across the various con- ditions as do a majority of the other iden- tified ribosomal proteins in this study. Other proteins such as ACEA, ALDA, and MDH share a similar pattern that can be explained by their role in carbon uti- lization. GALE has a unique pattern that can be attributed to its role in lactose catabolism. Ace, acetate; Lac, lactose; Glu, glucose. In this study, we sought to use a model biological system to across multiple binary comparisons (growth condition pro- demonstrate the full qualitative and quantitative capabilities files) can provide additional information regarding the partic- provided by the LCMSE methodology. Fig. 6A shows the ipation of proteins in a specific metabolic process. When abundance ratios for the characterized peptides to a set of taken together, the correlations among the growth condition eight proteins found among the three different growth condi- profiles can be used to group proteins in response to specific tions. The relative abundance of the identified peptides is perturbations. For example, ACEA/ALDA and IDH/MDH show seen to lie within a narrow quantitative range. These inde- very similar expression profiles for each pair of growth con- pendent quantitative measurements of the multiple peptide ditions and to a lesser degree among the four. These four identifications for a particular protein provide the ability to proteins are in fact all metabolically related because they are determine the relative abundance of the protein between two involved in either the citric acid cycle or the glyoxylate shunt. conditions. Using the average -fold change, standard devia- Also the growth condition profiles of ribosomal proteins RL1/ tion, and number of peptides to a particular protein found in RS1 are very similar and differ from the previous set of pro- two conditions, the average relative -fold change for a protein teins. The growth condition profiles illustrated by RL1 and is be displayed with the appropriate 95% confidence interval RS2 are also shared among the other ribosomal proteins (CI) in Fig. 6B. The relative quantitation of a particular protein identified in this study (Fig. 7). Fig. 7 summarizes the relative Molecular & Cellular Proteomics 5.4 601
- 14. E. coli Proteome Analysis FIG. 7. Relative quantitation of pro- teins among the three growth condi- tions from unfractionated E. coli. Rel- ative quantitation of proteins associated Downloaded from www.mcponline.org at CELL SIGNALING TECHNOLOGY on May 22, 2007 with translation (A), amino acid metabo- lism and stress (B), and carbon and en- ergy metabolism (C) among the three growth conditions. The relative quantita- tion is based on the average -fold change found among the redundant, quantitative peptide measurements from each protein. A 95% confidence interval was determined for those proteins that contained more than one peptide identi- fication. Those proteins that were unique to a particular condition were assigned a maximum or minimum value of 5.5 (unique to numerator condition) or 5.5 (unique to denominator condition) for each binary comparison. The three bi- nary comparisons are color-coded as follows: black, lactose versus glucose; red, acetate versus glucose; and blue, acetate versus lactose. quantitation to a number of identified proteins in this study dant proteins involved in carbon metabolism. A total of 49 of the that are critical for protein translation, carbon utilization, and 54 ribosomal proteins were identified in the three growth con- energy metabolism. A more detailed discussion of the quan- ditions, and their relative expression profiles (as ln(ratio)) are titative results and their correlation to the understood bio- illustrated in Fig. 7A. The validated mass spectrum of a subset chemistry is described in the following sections. An expanded of ribosomal proteins is provided in the supplemental data list of the proteins identified in this study is provided in the (Supplemental Fig. 4). The average percent sequence coverage supplemental data (Supplemental Table 3). of the ribosomal proteins was 54% from either the glucose or Translation Machinery—Approximately 8% of the total cellu- lactose growth conditions. However, the average percent se- lar volume of E. coli is occupied by ribosomal proteins, and quence coverage of the ribosomal proteins decreased to 32% these should be among the abundant proteins in unfractionated during growth on acetate. The concomitant decrease of riboso- E. coli. Determination of the relative expression of these major mal proteins along with the slower growth rate has been dem- housekeeping proteins was an important step in the validation onstrated when E. coli is grown on acetate (23). The results of this method before characterizing other, perhaps less abun- illustrated in Fig. 7 concur with these observations. 602 Molecular & Cellular Proteomics 5.4
- 15. E. coli Proteome Analysis FIG. 7—continued Downloaded from www.mcponline.org at CELL SIGNALING TECHNOLOGY on May 22, 2007 The consistency of the expression profiles for the ribosomal tosidase (LACZ), which is detected only in the lactose condition proteins in the paired conditions is striking (Figs. 6 and 7). with 30% sequence coverage, catalyzes that hydrolysis of lac- Growth on acetate results in consistent down-regulation of tose to -D-glucose and -D-galactose. Aldolase-1-epimerase these proteins relative to growth on either glucose or lactose. (GALM, 41% sequence coverage), which converts the epimer These results are consistent with the work of Marr (23), who of galactose to the epimer, was up-regulated 2.7-fold (ln(Lac- was able to correlate the specific growth rates of E. coli on tose/Acetate) 0.99 0.14, 95% CI) in the lactose relative to various carbon sources with the absolute quantity of riboso- the acetate growth condition. Similarly galactokinase (GALK, mal proteins. The growth rate of E. coli in acetate decreases 21% sequence coverage) was also identified and found to be when compared with the growth rate on either glucose or up-regulated by 6.8-fold (ln(Lactose/Acetate) 1.91 0.35, lactose. The lower growth rate correlates to a lower rate of 95% CI) in the lactose relative to the acetate growth condition. protein synthesis and results in a decrease in the level of Another essential protein required for lactose/galactose utiliza- ribosomal proteins. With a decrease in protein synthesis and tion, GALT, was also found to be unique to the lactose growth ribosomal proteins, the demand for amino acid biosynthesis is condition ( 16% sequence coverage). It catalyzes the reaction also attenuated. Conversely the level of ribosomal proteins is of UDP-D-glucose and -D-galactose-1-phosphate to -D-glu- not affected by substituting lactose for glucose. Because cose-1-phosphate and UDP-galactose. This reaction is coupled TUFA was used to normalize the data across all experiments, with another enzyme, GALE, that concomitantly converts -D- it does not show any change throughout the three different galactose-1-phosphate and UTP to UDP-galactose and pyro- growth conditions. A number of other associated ribosomal phosphate. GALE was identified ( 33% sequence coverage) proteins and protein translation chaperones were also identi- and found to be up-regulated by 7.4-fold (ln(Lactose/Acetate) fied, and their relative quantitation was determined. Among 1.99 0.24, 95% CI) in the lactose relative to the acetate these proteins were EFG, DNAK, GROEL, GROES, CLPA, and condition. These are among some of the characteristic proteins CLPB. Although EFG was not affected, the other proteins essential for lactose metabolism. A similar study by Vollmer et were all up-regulated in both glucose and lactose. Growth on al. (24) identified a subset of lactose-specific proteins using a either glucose or lactose supports higher growth rates, and as two-dimensional LC strategy by combining strong cation ex- a result there is a concomitant increase in protein production, change and reverse phase chromatography. From the multidi- providing the need for these chaperones to facilitate protein mensional analysis performed in their study, Vollmer et al. (24) folding and post-translational modification. identified LACZ and GALM from their analysis with 15 and 3% Lactose Utilization—As the PAGE data (Fig. 1) and the inten- total sequence coverage, respectively. Although they were able sity ratio plots of matched peptides (Fig. 3, C and D) suggest, to identify a subset of lactose-metabolizing proteins, the results there are relatively few differentially expressed proteins between from their data did not provide any information regarding the the glucose and lactose growth conditions. Those that are dif- relative quantitation of the characterized proteins between the ferentially expressed in the lactose condition (summarized in lactose and glucose growth conditions. Table III) are significant to the metabolism of lactose. -Galac- Acetate Utilization—Comparison of acetate condition to Molecular & Cellular Proteomics 5.4 603
- 16. E. coli Proteome Analysis TABLE III Subset of quantified proteins involved in carbon source utilization AG ln (average intensity ratio) between acetate and glucose; AL ln (average intensity ratio) between acetate and lactose; LG ln (average intensity ratio) between lactose and glucose; 95CI, corresponding 95% confidence interval; Ace, acetate; Lac, lactose; Glc, glucose; —, not applicable or not determined. Protein Alternative Blattner Description AG 95 CI AL 95 CI LG 95 CI Lactose degradation LACZ LACZ b0344 -Galactosidase — — Lac — Lac — GALM GALM b0756 Aldolase-1-epimerase 1.32 0.21 0.99 0.14 2.13 0.21 GALK GALK b0757 Galactokinase Ace — 1.91 0.35 Lac — GALT GALT b0758 UDP-glucose-hexose-1-phosphate — — Lac — Lac — uridylyltransferase GALE GALD b0759 UDP-glucose-4-epimerase 1.06 0.29 1.99 0.24 3.00 0.29 AGP AGP b1002 Glucose-1-phosphatase 0.24 0.25 Ace — Glc — GLK GLK b2388 Glucokinase 0.65 0.33 0.58 0.10 0.06 0.31 Downloaded from www.mcponline.org at CELL SIGNALING TECHNOLOGY on May 22, 2007 Acetate degradation ACS ACSA b4069 Acetyl-CoA synthetase 2.81 0.25 Ace — Glc — ACKA ACKA b2296 Acetate kinase 0.63 0.22 0.58 0.23 0.05 0.09 PTA PTA b2297 Phosphate acetyltransferase 0.47 0.10 0.44 0.13 0.04 0.10 Glycolysis PGI PGI b4025 Phosphoglucose isomerase 0.65 0.13 0.78 0.10 0.12 0.15 PFKA PFKA b3916 6-Phosphofructokinase-1 0.53 0.10 0.54 0.12 0.01 0.16 PFKB PFKB b1723 6-Phosphofructokinase-2 0.07 0.20 0.20 0.21 0.14 0.10 FBAB ALF b2925 Fructose-bisphosphate aldolase class II 0.38 0.13 0.25 0.19 0.13 0.13 TPIA TPI b3919 Triose-phosphate isomerase 0.42 0.16 0.40 0.12 0.02 0.13 GAPA GAPA b1779 Glyceraldehyde-3-phosphate dehydrogenase-A 0.58 0.09 0.77 0.14 0.20 0.08 complex PGK PGK b2926 Phosphoglycerate kinase 0.53 0.11 0.38 0.07 0.15 0.09 PGMA GPMA b0755 Phosphoglycerate mutase I 0.56 0.12 0.62 0.18 0.07 0.10 ENO ENO b2779 Enolase 0.42 0.09 0.54 0.05 0.08 0.07 ACEE ODP1 b0114 Pyruvate dehydrogenase multienzyme complex, 0.23 0.08 0.15 0.07 0.08 0.06 E1p ACEF ODP2 b0115 Pyruvate dehydrogenase multienzyme complex, 0.18 0.05 0.17 0.05 0.01 0.06 lipoate/dihydrolipoamide acetyltransferase LPDA DLDH b0116 Pyruvate dehydrogenase multienzyme complex, 1.85 0.10 1.98 0.14 0.12 0.11 E3 monomer Citric acid cycle GLTA ICDB b0720 Citrate synthase 2.32 0.26 2.43 0.25 0.09 0.10 ACNA ACON1 b1276 Aconitase 0.27 0.09 0.27 0.10 0.00 0.05 ACNB ACON2 b0118 Aconitase B 1.48 0.23 1.58 0.19 0.10 0.11 ICDA IDH b1136 Isocitrate dehydrogenase 1.08 0.14 1.21 0.12 0.13 0.07 SUCA ODO1 b0726 2-Oxoglutarate dehydrogenase complex, E1p 1.99 0.19 2.16 0.27 0.17 0.09 SUCB ODO2 b0727 2-Oxoglutarate dehydrogenase complex, 2.58 0.54 3.11 0.29 0.54 0.27 dihydrolipoamide succinyltransferase SUCC SUCC b0728 Succinyl-CoA synthase, 1.88 0.14 2.03 0.13 0.16 0.07 SUCD SUCD b0729 Succinyl-CoA synthase, 1.82 0.14 1.96 0.14 0.14 0.06 FUMC FUMC b1611 Fumarate hydratase, class II 0.52 0.14 0.60 0.17 0.05 0.09 MDH MDH b3236 Malate dehydrogenase 1.98 0.11 2.15 0.11 0.17 0.04 Glyoxylate bypass ACEA ICL b4015 Isocitrate lyase 4.48 0.27 4.29 0.21 0.16 0.15 ACEB MASY b4014 Malate synthase A 3.35 0.41 Ace — Glc — either the glucose or lactose conditions reveals more diversity in a single step using the acetyl-CoA synthetase (ACS). The than the comparison of glucose to lactose (Figs. 1A and 3, other is a more circuitous route that converts acetate to E–H). These results should not be surprising because growth acetyl-CoA in two steps. The first step, which is catalyzed by on acetate, instead of glucose or lactose, requires the cell to acetate kinase (ACKA), involves activation of acetate by phos- redirect the carbon flux through different metabolic pathways phorylation to form acetylphosphate. The second step is cat- to sustain growth. A major adaptation is the induction of alyzed by phosphate acetyltransferase (PTA) to transfer CoA enzymes to convert acetate, rather than pyruvate, to acetyl- to the activated form of acetate and liberate inorganic phos- CoA (Fig. 4). Two such pathways exist in E. coli. The first is an phate. The relative quantitation results from this study indicate efficient pathway that directly converts acetate to acetyl-CoA that both pathways are up-regulated, although the pathway 604 Molecular & Cellular Proteomics 5.4
- 17. E. coli Proteome Analysis TABLE IV Comparison with 2DGE and transcriptional microarrays AG ln (average intensity ratio) between acetate and glucose. Column A shows protein levels as determined by the label-free quantitation method described in this study. Column B shows transcript levels as reported by Oh et al. (7). Column C shows proteins levels as determined from 2DGE reported by Peng and Shimizu (18). NR, not determined in the study. AG Protein Alternative Blattner Description A B C Acetate degradation ACS ACSA b4069 Acetyl-CoA synthetase 2.81 2.25 NR ACKA ACKA b2296 Acetate kinase 0.63 0.67 0.51 PTA PTA b2297 Phosphate acetyltransferase 0.47 0.43 0.22 Glycolysis PGI PGI b4025 Phosphoglucose isomerase 0.65 0.12 0.51 PFKA PFKA b3916 6-Phosphofructokinase-1 0.53 0.53 0.69 PFKB PFKB b1723 6-Phosphofructokinase-2 0.07 0.18 0.00 FBAB ALF b2925 Fructose-bisphosphate aldolase class II 0.38 0.69 0.51 Downloaded from www.mcponline.org at CELL SIGNALING TECHNOLOGY on May 22, 2007 TPIA TPI b3919 Triose-phosphate isomerase 0.42 0.05 0.11 GAPA GAPA b1779 Glyceraldehyde-3-phosphate dehydrogenase-A complex 0.58 0.80 0.69 PGK PGK b2926 Phosphoglycerate kinase 0.53 0.53 0.69 PGMA GPMA b0755 Phosphoglycerate mutase I 0.56 0.53 0.51 ENO ENO b2779 Enolase 0.42 0.62 NR ACEE ODP1 b0114 Pyruvate dehydrogenase multienzyme complex, E1p 0.23 0.12 0.51 ACEF ODP2 b0115 Pyruvate dehydrogenase multienzyme complex, lipoate/ 0.18 0.82 0.51 dihydrolipoamide acetyltransferase Citric acid cycle GLTA ICDB b0720 Citrate synthase 2.32 1.59 1.50 ACNA ACON1 b1276 Aconitase 0.27 0.41 0.74 ACNB ACON2 b0118 Aconitase B 1.48 1.93 1.19 ICDA IDH b1136 Isocitrate dehydrogenase 1.08 0.59 0.41 SUCA ODO1 b0726 2-Oxoglutarate dehydrogenase complex, E1p 1.99 0.47 1.48 SUCB ODO2 b0727 2-Oxoglutarate dehydrogenase complex, dihydrolipoamide 2.58 0.79 1.34 succinyltransferase SUCC SUCC b0728 Succinyl-CoA synthase, 1.88 1.03 1.48 SUCD SUCD b0729 Succinyl-CoA synthase, 1.82 1.13 1.34 FUMC FUMC b1611 Fumarate hydratase, class II 0.52 0.74 0.74 MDH MDH b3236 Malate dehydrogenase 1.98 1.36 1.22 Glyoxylate bypass ACEA ICL b4015 Isocitrate lyase 4.48 3.66 2.40 ACEB MASY b4014 Malate synthase A 3.35 2.83 2.33 involving ACS is elevated to a much greater extent (Table III). acetate sample. Another hallmark of growth on acetate is the ACS was identified with 38% sequence coverage and found induction of the glyoxylate shunt pathway. Specifically isoci- to be unique to the acetate up-regulated by 16.6-fold (ln(Ac- trate lyase (ACEA) and malate synthase A (ACEB) redirect the etate/Glucose) 2.81 0.25, 95% CI) in the acetate growth carbon flux through the citric acid cycle to conserve the use of condition. In addition, ACKA was identified with 25% se- the acetyl-CoA for production of primary metabolites and quence coverage and up-regulated by 1.9-fold (ln(Acetate/ energy management without loss of carbon as carbon diox- Glucose) 0.63 0.22, 95% CI), whereas PTA was identified ide. Both ACEA and ACEB were identified in the acetate with 31% sequence coverage and up-regulated by 1.6-fold condition (58 and 32% sequence coverage, respectively) and (ln(Acetate/Glucose) 0.47 0.10, 95% CI) in the acetate were found to be highly up-regulated, 88.2-fold (ln(Acetate/ growth condition. These results are consistent with Oh et al. Glucose) 4.48 0.27, 95% CI) in the case of ACEA and (7), who reported that ACS was the main path for acetate 28.5-fold (ln(Acetate/Glucose) 3.35 0.41, 95% CI) in the uptake from microarray analysis of E. coli grown on acetate case of ACEB. and glucose. They are also consistent with the results of Glucose Utilization (Glycolysis and Tricarboxylic Acid Cy- Kakuda et al. (25), who showed that mutation of both ackA cle)—Several glycolysis proteins (PGI, GAPA, and ENO) were and pta inhibited cell growth in acetate, indicating that this down-regulated in acetate relative to either glucose or lactose pathway also delivers a significant amount of carbon flux into (Fig. 7 and Tables III and IV). Although the media conditions the cell. In the absence of glucose in the growth medium we were not identical among the three studies, the directionality also observed that a number of enzymes in the glycolysis of the relative abundance data is consistent with the microar- pathway, including phosphoglucose isomerase (PGI), glycer- ray data reported by Oh et al. (7) and the 2DGE data by Peng aldehyde-3-phosphate dehydrogenase-A complex (GAPA), and Shimizu (18) and serve to help validate our methodology. and enolase (ENO) are significantly down-regulated in the Peng and Shimizu (18) point out that these same proteins are Molecular & Cellular Proteomics 5.4 605