Jan to Dec 2011 Newsletter
•
0 j'aime•209 vues

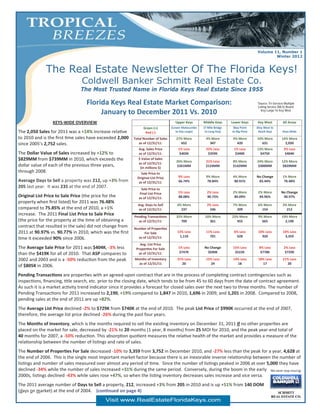
Sales and prices comparing 2011 to 2010. More sales and, in Key West, higher sales prices.

Recommandé
Recommandé
Contenu connexe
Tendances
Tendances (8)
Similaire à Jan to Dec 2011 Newsletter
Similaire à Jan to Dec 2011 Newsletter (20)
Jan to Dec 2011 Newsletter
- 1. Volume 11, Number 1 Winter 2012 The Real Estate Newsletter Of The Florida Keys! Coldwell Banker Schmitt Real Estate Co. The Most Trusted Name in Florida Keys Real Estate Since 1955 Florida Keys Real Estate Market Comparison: *Source: Tri-Services Multiple Listing Service (MLS) Board January to December 2011 Vs. 2010 Key Largo To Key West KEYS‐WIDE OVERVIEW Upper Keys Middle Keys Lower Keys Key West All Areas (Lower Matecumbe (7 Mile Bridge (Bay Point (Key West to Green (+) The 2,050 Sales for 2011 was a +14% increase rela ve Red (‐) to Key Largo) to Long Key) to Big Pine) Shark Key) Keys‐Wide to 2010 and is the first me sales have exceeded 2,000 Total Number of Sales 27% More 4% More 9% More 10% More 14% More since 2005’s 2,752 sales. as of 12/31/11: 652 347 420 631 2,050 Avg. Sales Price 1% Less 32% Less 1% Less 13% More 3% Less The Dollar Value of Sales increased by +12% to as of 12/31/11: $402K $359K $340K $475K $404K $829MM from $739MM in 2010, which exceeds the $ Value of Sales 26% More 21% Less 8% More 24% More 12% More as of 12/31/11: dollar value of each of the previous three years, (in millions $) $261MM $124MM $142MM $300MM $829MM through 2008. Sale Price to Original List Price 9% Less 9% More 4% More No Change 1% More Average Days to Sell a property was 212, up +3% from as of 12/31/11: 66.74% 78.84% 80.91% 83.44% 76.48% 205 last year. It was 235 at the end of 2007. Sale Price to Final List Price 1% Less 2% Less 2% More 2% More No Change Original List Price to Sale Price (the price for the as of 12/31/11: 88.08% 90.75% 89.09% 94.96% 90.97% property when first listed) for 2011 was 76.48% Avg. Days to Sell 4% More 2% Less 7% More 6% More 3% More compared to 75.85% at the end of 2010, a +1% as of 12/31/11: 237 246 209 154 212 increase. The 2011 Final List Price to Sale Price Pending Transac ons 32% More 10% More 23% More 9% More 19% More (the price for the property at the me of obtaining a as of 12/31/11: 709 361 455 665 2,190 contract that resulted in the sale) did not change from Number of Proper es 2011 at 90.97% vs. 90.77% in 2010, which was the first For Sale 13% Less 11% Less 6% Less 10% Less 10% Less as of 12/31/11: 1,110 701 628 920 3,359 me it exceeded 90% since 2006. Avg. List Price The Average Sale Price for 2011 was $404K, ‐3% less Proper es For Sale 1% Less No Change 15% Less 8% Less 2% Less than the $419K for all of 2010. That ASP compares to as of 12/31/11: $747K $690K $522K $778K $729K 2002 and 2003 and is a ‐50% reduc on from the peak Months of Inventory 31% Less 15% Less 14% Less 18% Less 21% Less as of 12/31/11 20 24 18 17 20 of $805K in 2006. Pending Transac ons are proper es with an agreed‐upon contract that are in the process of comple ng contract con ngencies such as inspec ons, financing, tle search, etc. prior to the closing date, which tends to be from 45 to 60 days from the date of contract agreement. As such it is a market ac vity trend indicator since it provides a forecast for closed sales over the next two to three months. The number of Pending Transac ons for 2011 increased to 2,190, +19% compared to 1,847 in 2010, 1,696 in 2009, and 1,201 in 2008. Compared to 2008, pending sales at the end of 2011 are up +82%. The Average List Price declined ‐2% to $729K from $740K at the end of 2010. The peak List Price of $990K occurred at the end of 2007, therefore, the average list price declined ‐26% during the past four years. The Months of Inventory, which is the months required to sell the exis ng inventory on December 31, 2011 if no other proper es are placed on the market for sale, decreased by ‐21% to 20 months (1 year, 8 months) from 25 MOI for 2010, and the peak year‐end total of 40 months for 2007, a ‐50% reduc on. This absorp on quo ent measures the rela ve health of the market and provides a measure of the rela onship between the number of lis ngs and rate of sales. The Number of Proper es For Sale decreased ‐10% to 3,359 from 3,752 in December 2010, and ‐27% less than the peak for a year, 4,628 at the end of 2006. This is the single most important market factor because there is an inexorable inverse rela onship between the number of lis ngs and number of sales measured over almost any period of me. Since the number of lis ngs peaked in 2006 at over 5,000 they have declined ‐34% while the number of sales increased +31% during the same period. Conversely, during the boom in the early 2000s, lis ngs declined ‐43% while sales rose +47%, so when the lis ng inventory decreases sales increase and vice versa. The 2011 average number of Days to Sell a property, 212, increased +3% from 205 in 2010 and is up +51% from 140 DOM (days on market) at the end of 2004. (con nued on page 4) Visit www.RealEstateFloridaKeys.com
- 2. Florida Keys Real Estate Market News The two charts on this page display the changes in the Keys real estate market over the past 13 years. The first chart presents the number of proper es Listed at the end of each year along with the percentage change from the previous year, as well as the Average List Price (ALP) and percent of change in List Price. The second chart contains Sales and the percent of change year‐to‐year with the yearly change in Average Sale Price (ASP) and year‐over‐year percent of change. From the end of 1999 to the end of 2003, the number of lis ngs declined ‐43%, primarily the result of increasing numbers of sales which rose +47% during that period. During that same period, the average List Price increased +96%, $303K to $594K, while the ASP increased +76% going from $246K to $433K. During 2004 Lis ngs remained in the 1,800 range, however, the ALP increased +33% from $594K to $792K while Sales were up +4% to a peak total of 3,510. The ASP rose +30% to $563K. The number of proper es Listed at the end of 2005 was nearly double that of 2004 while the ALP increased +23% to $976K, however, the number of sales dropped ‐22% as the market started a decline in the late spring. This was accelerated by the nega ve impact of Hurricane Wilma in October coupled with the advent of the na onwide real estate recession, which resulted in Keys wide sales falling another ‐45% during 2006 even though the ASP reached a record $805K. Addi onally, during 2006, the number of listed proper es rose +33% to end the year at 4,628 a er peaking at 5,073 in November. The ALP increased less than +1% in 2006 and in 2007, when it topped out at $990K before dropping ‐26% to $729K at the end of 2011. Addi onally, the number of lis ngs on the market has declined ‐25% since 2006 going from 4,628 to 3,359 at the end of 2011. Sales, a er declining each year from 2005 through 2008, finally increased in 2009, +34% over 2008, and, as noted on page one, rose +14% in 2011. The ASP declined from $805K in 2006 to $404K in 2011, ‐50% over five years, which returns the ASP to 2002/2003 levels and offers excellent buying opportuni es from Key Largo to Key West. The lis ng inventory needs to further recede below 3,000 lis ngs before sales prices can consistently increase even though we an cipate the number of sales will con nue to increase as it has since 2009, and that lis ngs will con nue to decrease as well. Visit www.RealEstateFloridaKeys.com
- 3. Keys-Wide Ranking of Top Real Estate Companies & Offices January — December 2011 Coldwell Banker Schmi is the #1 company for sales Keys‐wide with over 2.3 mes the sales volume of the #2 company. Each of our offices ranks #1 in its Market Area from Key West through the Lower Keys, Middle Keys and Upper Keys and all rank within the top 10 offices of the 294 real estate offices in The Keys. Our agents are the most produc ve in the Keys with more agents in the Top 10, 25, 50, and 75 than the next six (6) companies combined. CBSREC agents also dominate each market with over 40% of the Top Ten agents in each market area. No ma er if you are looking for the Top Company, Top Office or Top Agent, you will find it at CBSREC from Key Largo to Key West. Sales Volume # Offices Company Ranking Sales Volume Market Share 6 Coldwell Banker Schmi #1 $389M 23.6% 7 C‐21 Schwartz #2 $164M 10.0% 1 Truman & Co. #3 $110M 6.7% 1 Pruden al K. & G. #4 $73M 4.5% 3 American Caribbean #5 $59M 3.6% Office Rankings of the 290 Offices Keys‐Wide # Offices Company Individual Office Rankings # Sales Sides 6 CBSREC #1, #2, #3, #9 & #12 7 C‐21 Schwartz #4, #15, #17, #30. #40, #45, #68 1 Pruden al K&G #5 1 Amer Carib ‐ MK #6 Sales Associate Ranking of 900 Agents Keys‐Wide by Sales Volume Company # Agents Top 10 Top 25 Top 50 Top 75 Top 100 CBSREC 123 6 13 21 25 34 C‐21 Schwartz 83 0 0 2 9 11 Truman 11 2 3 4 5 6 American Caribbean MK 15 0 1 5 5 6 Pruden al K & G 38 1 1 1 4 5 Exit 30 0 0 0 2 3 Freewheeler 27 1 1 1 2 3
- 4. (con nued from page 1) KEYS‐WIDE MARKET AREA DETAILS More Florida Keys History Number of Sales: All four market areas saw an increase in the number of sales in 2011. The Upper Keys led in sales with 652, +27% followed by Key West, +10% and 631 sales. The Lower Keys closed 420 sales, +9% with 347 for the Middle Keys, +4% over 2010. Dollar Value of Sales: The Upper Keys rose by +26% to $261MM. Key West grew by +24% with $300MM followed by the Lower Keys +8% to $142MM. Only the Middle Keys declined, ‐21% to $124MM as a result of the reduced average sales price which was largely due to fewer larger transac ons in 2011 versus 2010. Average Days to Sell: The Middle Keys dropped ‐2% to 246 days. The Lower Keys increased +7% to 209, Key West +6% to 154, while the Upper Keys days went up +4% to 237. Average Sale Price: The largest reduc on occurred in the Middle Keys market, ‐32% to $359K. The Lower Keys and Upper Keys Pat Schmi ’s House of Furniture each dropped ‐1% to $340K and $402K respec vely. Key West was the only market area that increased, +13% reaching $475K. For in 1959. Now, NAPA Auto Parts comparison, the average sale price by market area at the end of 2006 was: UK ‐ $770K, MK ‐ $811K, LK ‐ $651K and KW ‐ $936K. The at 122nd Street in Marathon. Average Sale Price opportunity provided by the current market has not been available since 2002 and 2003. See the chart on the page two for the history of sales and lis ngs since 1998. Pending Transac ons: Pending Sales increased in all market areas. The Upper Keys surged by +32% to 709 versus 537, followed by the Lower Keys, +23% to 455 over 371 during 2010. The Middle Keys grew by +10%, 361 vs. 329 the previous year. Key West pending sales of 665 were up +9% from 610 in 2009. Average List Price: All four market areas declined in ALP. The Lower Keys, ‐15% to $522K from $616K in 2009; then Key West at $778K, ‐8% from $847K a year earlier followed by the Upper Keys ‐1% to $747K from $752K in 2010. The Middle Keys had virtually no change at $690K compared to $687K. For comparison, the Average List Price at the end of 2006 was: UK ‐ $1MM, MK ‐ $992K, LK ‐ $781K and KW ‐ $1MM, which was the peak for average asking prices. Months of Inventory: All market areas decreased, with the largest being ‐31% to 20 months in the Upper Keys from 30 a year ago. There was an ‐18% drop to 17 MOI in Key West, (21 MOI at the end of 2010) and the Middle Keys, ‐15% down to 24 months compared to 28 MOI at the end of 2010. The Lower Keys decreased ‐14% to 18 MOI from 21 MOI last December. Number of Proper es for Sale: The inventory declined across the Keys: ‐13% in the Upper Keys to 1,110 from 1,273 a year ago; ‐11% in Middle Keys, 701 compared to 788; ‐10% for Key West, 920 vs. 1,022; and ‐6% for the Lower Keys with 628 vs. 669 in December 2010. What is Ahead for the Keys Real Estate Market? The posi ve market numbers and trends con nued from quarter to quarter during 2011 and indicate a further con nua on during 2012. The Keys market closed the year +14% ahead in number of sales with a +19% increase in pending sales and a ‐10% decline in available proper es for sale, all of which forecasts that the Keys will experience con nued sales growth. Addi onally, as the number of lis ngs con nues to decline while the reduc on in average sale price con nues (it has gone from ‐20% a year during 2008/2009 to ‐8% in 2010 to ‐3% in 2011), sales prices should stabilize in 2012. Currently, there are more pending sales in each market area than there were closed sales in all of 2011 so we are star ng off well. Not all of those Pendings will close and those awai ng Short Sale approval may take a number of months to close, but the predic ve indicators (which are Number of Lis ngs and Number of Pendings) are both very posi ve. PRESORTED STD. U.S. POSTAGE P A I D PERMIT NO. 15 Marathon, FL 11050 Overseas Hwy. — Main Office Marathon, FL 33050 Toll Free: 800‐366‐5181 Office: 305‐743‐5181 Fax: 305‐743‐7012 If you would like a FREE Compara ve Market Analysis, contact one of our five offices at the toll free numbers below. We are “The Most Trusted Name In Florida Keys Real Estate.” Key Largo (877) 289‐0035 Islamorada (800) 207‐4160 Marathon (800) 366‐5181 Big Pine (800) 488‐3050 Key West (800) 598‐7727 Visit www.RealEstateFloridaKeys.com