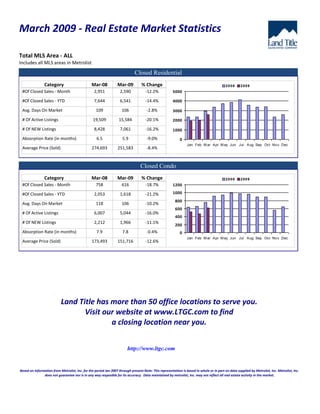
1. March 2009 - Real Estate Market Statistics
Total MLS Area - ALL
Includes all MLS areas in Metrolist
Closed Residential
Category Mar-08 Mar-09 % Change 2008 2009
#Of Closed Sales - Month 2,951 2,590 -12.2% 5000
#Of Closed Sales - YTD 7,644 6,541 -14.4% 4000
Avg. Days On Market 109 106 -2.8% 3000
# Of Active Listings 19,509 15,584 -20.1% 2000
# Of NEW Listings 8,428 7,061 -16.2% 1000
Absorption Rate (in months) 6.5 5.9 -9.0% 0
Jan Feb M ar A pr M ay Jun Jul A ug Sep Oct No v Dec
Average Price (Sold) 274,693 251,583 -8.4%
Closed Condo
Category Mar-08 Mar-09 % Change 2008 2009
#Of Closed Sales - Month 758 616 -18.7% 1200
1000
#Of Closed Sales - YTD 2,053 1,618 -21.2%
800
Avg. Days On Market 118 106 -10.2%
600
# Of Active Listings 6,007 5,044 -16.0%
400
# Of NEW Listings 2,212 1,966 -11.1%
200
Absorption Rate (in months) 7.9 7.8 -0.4% 0
Jan Feb M ar A pr M ay Jun Jul A ug Sep Oct No v Dec
Average Price (Sold) 173,493 151,716 -12.6%
Land Title has more than 50 office locations to serve you.
Visit our website at www.LTGC.com to find
a closing location near you.
http://www.ltgc.com
Based on Information from Metrolist, Inc. for the period Jan 2007 through present.Note: This representation is based in whole or in part on data supplied by Metrolist, Inc. Metrolist, Inc.
does not guarantee nor is in any way resposible for its accuracy. Data maintained by metrolist, Inc. may not reflect all real estate activity in the market.
2. March 2009 - Real Estate Market Statistics
Aurora North - AUN
Closed Residential
Category Mar-08 Mar-09 % Change 2008 2009
#Of Closed Sales - Month 97 114 17.5% 160
140
#Of Closed Sales - YTD 274 305 11.3%
120
100
Avg. Days On Market 111 81 -27.0%
80
# Of Active Listings 556 299 -46.2% 60
40
# Of NEW Listings 217 170 -21.7%
20
Absorption Rate (in months) 5.9 2.7 -53.8% 0
Jan Feb M ar A pr M ay Jun Jul A ug Sep Oct No v Dec
Average Price (Sold) 99,829 97,995 -1.8%
Closed Condo
Category Mar-08 Mar-09 % Change 2008 2009
#Of Closed Sales - Month 19 17 -10.5% 30
25
#Of Closed Sales - YTD 61 39 -36.1%
20
Avg. Days On Market 93 99 6.5%
15
# Of Active Listings 112 49 -56.3%
10
# Of NEW Listings 32 22 -31.3%
5
Absorption Rate (in months) 6.3 2.8 -55.3% 0
Jan Feb M ar A pr M ay Jun Jul A ug Sep Oct No v Dec
Average Price (Sold) 47,518 74,553 56.9%
Land Title has more than 50 office locations to serve you.
Visit our website at www.LTGC.com to find
a closing location near you.
http://www.ltgc.com
Based on Information from Metrolist, Inc. for the period Jan 2007 through present.Note: This representation is based in whole or in part on data supplied by Metrolist, Inc. Metrolist, Inc.
does not guarantee nor is in any way resposible for its accuracy. Data maintained by metrolist, Inc. may not reflect all real estate activity in the market.
3. March 2009 - Real Estate Market Statistics
Aurora South - AUS
Closed Residential
Category Mar-08 Mar-09 % Change 2008 2009
#Of Closed Sales - Month 275 255 -7.3% 500
#Of Closed Sales - YTD 738 641 -13.1% 400
Avg. Days On Market 105 88 -16.2% 300
# Of Active Listings 1,437 782 -45.6% 200
# Of NEW Listings 660 408 -38.2% 100
Absorption Rate (in months) 5.3 3.2 -39.5% 0
Jan Feb M ar A pr M ay Jun Jul A ug Sep Oct No v Dec
Average Price (Sold) 187,424 180,556 -3.7%
Closed Condo
Category Mar-08 Mar-09 % Change 2008 2009
#Of Closed Sales - Month 124 106 -14.5% 200
#Of Closed Sales - YTD 334 263 -21.3%
150
Avg. Days On Market 134 101 -24.6%
100
# Of Active Listings 706 444 -37.1%
50
# Of NEW Listings 261 190 -27.2%
Absorption Rate (in months) 6.1 4.3 -29.0% 0
Jan Feb M ar A pr M ay Jun Jul A ug Sep Oct No v Dec
Average Price (Sold) 92,237 91,125 -1.2%
Land Title has more than 50 office locations to serve you.
Visit our website at www.LTGC.com to find
a closing location near you.
http://www.ltgc.com
Based on Information from Metrolist, Inc. for the period Jan 2007 through present.Note: This representation is based in whole or in part on data supplied by Metrolist, Inc. Metrolist, Inc.
does not guarantee nor is in any way resposible for its accuracy. Data maintained by metrolist, Inc. may not reflect all real estate activity in the market.
4. March 2009 - Real Estate Market Statistics
Brighton, Fort Lupton - BFL
Closed Residential
Category Mar-08 Mar-09 % Change 2008 2009
#Of Closed Sales - Month 78 73 -6.4% 120
100
#Of Closed Sales - YTD 213 184 -13.6%
80
Avg. Days On Market 110 101 -8.2%
60
# Of Active Listings 635 422 -33.5%
40
# Of NEW Listings 199 153 -23.1%
20
Absorption Rate (in months) 8.1 5.7 -29.6% 0
Jan Feb M ar A pr M ay Jun Jul A ug Sep Oct No v Dec
Average Price (Sold) 184,459 168,796 -8.5%
Closed Condo
Category Mar-08 Mar-09 % Change 2008 2009
#Of Closed Sales - Month 4 2 -50.0% 8
7
#Of Closed Sales - YTD 7 8 14.3%
6
5
Avg. Days On Market 115 44 -61.7%
4
# Of Active Listings 28 24 -14.3% 3
2
# Of NEW Listings 5 8 60.0%
1
Absorption Rate (in months) 7.3 9. 24.1% 0
Jan Feb M ar A pr M ay Jun Jul A ug Sep Oct No v Dec
Average Price (Sold) 81,744 110,000 34.6%
Land Title has more than 50 office locations to serve you.
Visit our website at www.LTGC.com to find
a closing location near you.
http://www.ltgc.com
Based on Information from Metrolist, Inc. for the period Jan 2007 through present.Note: This representation is based in whole or in part on data supplied by Metrolist, Inc. Metrolist, Inc.
does not guarantee nor is in any way resposible for its accuracy. Data maintained by metrolist, Inc. may not reflect all real estate activity in the market.
5. March 2009 - Real Estate Market Statistics
Broomfield - BRM
Closed Residential
Category Mar-08 Mar-09 % Change 2008 2009
#Of Closed Sales - Month 67 62 -7.5% 100
#Of Closed Sales - YTD 148 144 -2.7% 80
Avg. Days On Market 108 102 -5.6% 60
# Of Active Listings 319 294 -7.8% 40
# Of NEW Listings 152 147 -3.3% 20
Absorption Rate (in months) 4.4 4.5 1.2% 0
Jan Feb M ar A pr M ay Jun Jul A ug Sep Oct No v Dec
Average Price (Sold) 351,206 331,054 -5.7%
Closed Condo
Category Mar-08 Mar-09 % Change 2008 2009
#Of Closed Sales - Month 12 11 -8.3% 40
35
#Of Closed Sales - YTD 24 25 4.2%
30
25
Avg. Days On Market 104 131 26.0%
20
# Of Active Listings 91 70 -23.1% 15
10
# Of NEW Listings 21 34 61.9%
5
Absorption Rate (in months) 8.5 5.4 -36.9% 0
Jan Feb M ar A pr M ay Jun Jul A ug Sep Oct No v Dec
Average Price (Sold) 202,170 242,237 19.8%
Land Title has more than 50 office locations to serve you.
Visit our website at www.LTGC.com to find
a closing location near you.
http://www.ltgc.com
Based on Information from Metrolist, Inc. for the period Jan 2007 through present.Note: This representation is based in whole or in part on data supplied by Metrolist, Inc. Metrolist, Inc.
does not guarantee nor is in any way resposible for its accuracy. Data maintained by metrolist, Inc. may not reflect all real estate activity in the market.
6. March 2009 - Real Estate Market Statistics
Douglas County West - DCW
Includes - Castle Rock, Larkspur, Sedalia, Palmer Lake, part of Littleton
Closed Residential
Category Mar-08 Mar-09 % Change 2008 2009
#Of Closed Sales - Month 137 106 -22.6% 200
#Of Closed Sales - YTD 347 229 -34.0%
150
Avg. Days On Market 128 175 36.7%
100
# Of Active Listings 1,387 1,399 0.9%
50
# Of NEW Listings 498 480 -3.6%
Absorption Rate (in months) 9.5 12.5 31.4% 0
Jan Feb M ar A pr M ay Jun Jul A ug Sep Oct No v Dec
Average Price (Sold) 394,951 491,779 24.5%
Closed Condo
Category Mar-08 Mar-09 % Change 2008 2009
#Of Closed Sales - Month 16 15 -6.3% 25
#Of Closed Sales - YTD 42 33 -21.4% 20
Avg. Days On Market 119 116 -2.5% 15
# Of Active Listings 116 123 6.0% 10
# Of NEW Listings 45 41 -8.9% 5
Absorption Rate (in months) 7.4 7.5 2.1% 0
Jan Feb M ar A pr M ay Jun Jul A ug Sep Oct No v Dec
Average Price (Sold) 174,533 156,310 -10.4%
Land Title has more than 50 office locations to serve you.
Visit our website at www.LTGC.com to find
a closing location near you.
http://www.ltgc.com
Based on Information from Metrolist, Inc. for the period Jan 2007 through present.Note: This representation is based in whole or in part on data supplied by Metrolist, Inc. Metrolist, Inc.
does not guarantee nor is in any way resposible for its accuracy. Data maintained by metrolist, Inc. may not reflect all real estate activity in the market.
7. March 2009 - Real Estate Market Statistics
Douglas Elbert Parker - DEP
Includes - Parker, Elizabeth, Franktown, Kiowa, Elbert, Deer Trail, Simla
Closed Residential
Category Mar-08 Mar-09 % Change 2008 2009
#Of Closed Sales - Month 141 106 -24.8% 250
#Of Closed Sales - YTD 351 279 -20.5% 200
Avg. Days On Market 105 137 30.5% 150
# Of Active Listings 1,209 1,093 -9.6% 100
# Of NEW Listings 498 412 -17.3% 50
Absorption Rate (in months) 7.9 9.8 25.1% 0
Jan Feb M ar A pr M ay Jun Jul A ug Sep Oct No v Dec
Average Price (Sold) 359,689 339,063 -5.7%
Closed Condo
Category Mar-08 Mar-09 % Change 2008 2009
#Of Closed Sales - Month 19 16 -15.8% 30
25
#Of Closed Sales - YTD 58 43 -25.9%
20
Avg. Days On Market 109 72 -33.9%
15
# Of Active Listings 127 128 0.8%
10
# Of NEW Listings 48 46 -4.2%
5
Absorption Rate (in months) 7.1 7.3 2.8% 0
Jan Feb M ar A pr M ay Jun Jul A ug Sep Oct No v Dec
Average Price (Sold) 156,640 146,846 -6.3%
Land Title has more than 50 office locations to serve you.
Visit our website at www.LTGC.com to find
a closing location near you.
http://www.ltgc.com
Based on Information from Metrolist, Inc. for the period Jan 2007 through present.Note: This representation is based in whole or in part on data supplied by Metrolist, Inc. Metrolist, Inc.
does not guarantee nor is in any way resposible for its accuracy. Data maintained by metrolist, Inc. may not reflect all real estate activity in the market.
8. March 2009 - Real Estate Market Statistics
Douglas Highlands Ranch Lone Tree - DHL
Includes - Highlands Ranch, Lone Tree
Closed Residential
Category Mar-08 Mar-09 % Change 2008 2009
#Of Closed Sales - Month 118 121 2.5% 250
#Of Closed Sales - YTD 337 231 -31.5% 200
Avg. Days On Market 91 94 3.3% 150
# Of Active Listings 634 667 5.2% 100
# Of NEW Listings 400 418 4.5% 50
Absorption Rate (in months) 5.1 5. -0.7% 0
Jan Feb M ar A pr M ay Jun Jul A ug Sep Oct No v Dec
Average Price (Sold) 396,224 349,459 -11.8%
Closed Condo
Category Mar-08 Mar-09 % Change 2008 2009
#Of Closed Sales - Month 18 13 -27.8% 60
50
#Of Closed Sales - YTD 55 40 -27.3%
40
Avg. Days On Market 71 174 145.1%
30
# Of Active Listings 155 120 -22.6%
20
# Of NEW Listings 72 40 -44.4%
10
Absorption Rate (in months) 7.8 9.2 18.7% 0
Jan Feb M ar A pr M ay Jun Jul A ug Sep Oct No v Dec
Average Price (Sold) 238,287 225,842 -5.2%
Land Title has more than 50 office locations to serve you.
Visit our website at www.LTGC.com to find
a closing location near you.
http://www.ltgc.com
Based on Information from Metrolist, Inc. for the period Jan 2007 through present.Note: This representation is based in whole or in part on data supplied by Metrolist, Inc. Metrolist, Inc.
does not guarantee nor is in any way resposible for its accuracy. Data maintained by metrolist, Inc. may not reflect all real estate activity in the market.
9. March 2009 - Real Estate Market Statistics
Denver Northeast - DNE
Closed Residential
Category Mar-08 Mar-09 % Change 2008 2009
#Of Closed Sales - Month 243 232 -4.5% 400
350
#Of Closed Sales - YTD 624 635 1.8%
300
250
Avg. Days On Market 103 106 2.9%
200
# Of Active Listings 1,393 890 -36.1% 150
100
# Of NEW Listings 678 447 -34.1%
50
Absorption Rate (in months) 5.7 4.1 -27.8% 0
Jan Feb M ar A pr M ay Jun Jul A ug Sep Oct No v Dec
Average Price (Sold) 220,089 184,247 -16.3%
Closed Condo
Category Mar-08 Mar-09 % Change 2008 2009
#Of Closed Sales - Month 20 25 25.0% 50
#Of Closed Sales - YTD 71 64 -9.9% 40
Avg. Days On Market 82 148 80.5% 30
# Of Active Listings 397 359 -9.6% 20
# Of NEW Listings 148 132 -10.8% 10
Absorption Rate (in months) 19.6 13.9 -29.0% 0
Jan Feb M ar A pr M ay Jun Jul A ug Sep Oct No v Dec
Average Price (Sold) 254,611 226,258 -11.1%
Land Title has more than 50 office locations to serve you.
Visit our website at www.LTGC.com to find
a closing location near you.
http://www.ltgc.com
Based on Information from Metrolist, Inc. for the period Jan 2007 through present.Note: This representation is based in whole or in part on data supplied by Metrolist, Inc. Metrolist, Inc.
does not guarantee nor is in any way resposible for its accuracy. Data maintained by metrolist, Inc. may not reflect all real estate activity in the market.
10. March 2009 - Real Estate Market Statistics
Denver Northwest - DNW
Closed Residential
Category Mar-08 Mar-09 % Change 2008 2009
#Of Closed Sales - Month 74 73 -1.4% 140
120
#Of Closed Sales - YTD 218 163 -25.2%
100
Avg. Days On Market 106 91 -14.2% 80
60
# Of Active Listings 465 473 1.7%
40
# Of NEW Listings 246 300 22.0%
20
Absorption Rate (in months) 6.3 5.9 -6.7% 0
Jan Feb M ar A pr M ay Jun Jul A ug Sep Oct No v Dec
Average Price (Sold) 262,969 270,525 2.9%
Closed Condo
Category Mar-08 Mar-09 % Change 2008 2009
#Of Closed Sales - Month 9 16 77.8% 25
#Of Closed Sales - YTD 38 25 -34.2% 20
Avg. Days On Market 103 118 14.6% 15
# Of Active Listings 148 200 35.1% 10
# Of NEW Listings 52 73 40.4% 5
Absorption Rate (in months) 15. 11.4 -23.8% 0
Jan Feb M ar A pr M ay Jun Jul A ug Sep Oct No v Dec
Average Price (Sold) 272,600 211,541 -22.4%
Land Title has more than 50 office locations to serve you.
Visit our website at www.LTGC.com to find
a closing location near you.
http://www.ltgc.com
Based on Information from Metrolist, Inc. for the period Jan 2007 through present.Note: This representation is based in whole or in part on data supplied by Metrolist, Inc. Metrolist, Inc.
does not guarantee nor is in any way resposible for its accuracy. Data maintained by metrolist, Inc. may not reflect all real estate activity in the market.
11. March 2009 - Real Estate Market Statistics
Denver Southeast - DSE
Closed Residential
Category Mar-08 Mar-09 % Change 2008 2009
#Of Closed Sales - Month 180 164 -8.9% 350
300
#Of Closed Sales - YTD 465 397 -14.6%
250
Avg. Days On Market 129 132 2.3% 200
150
# Of Active Listings 1,626 1,465 -9.9%
100
# Of NEW Listings 913 768 -15.9%
50
Absorption Rate (in months) 8.5 8.3 -1.2% 0
Jan Feb M ar A pr M ay Jun Jul A ug Sep Oct No v Dec
Average Price (Sold) 425,650 428,805 0.7%
Closed Condo
Category Mar-08 Mar-09 % Change 2008 2009
#Of Closed Sales - Month 127 117 -7.9% 250
#Of Closed Sales - YTD 394 327 -17.0% 200
Avg. Days On Market 135 116 -14.1% 150
# Of Active Listings 1,406 1,145 -18.6% 100
# Of NEW Listings 541 488 -9.8% 50
Absorption Rate (in months) 10.7 9. -15.8% 0
Jan Feb M ar A pr M ay Jun Jul A ug Sep Oct No v Dec
Average Price (Sold) 216,619 162,536 -25.0%
Land Title has more than 50 office locations to serve you.
Visit our website at www.LTGC.com to find
a closing location near you.
http://www.ltgc.com
Based on Information from Metrolist, Inc. for the period Jan 2007 through present.Note: This representation is based in whole or in part on data supplied by Metrolist, Inc. Metrolist, Inc.
does not guarantee nor is in any way resposible for its accuracy. Data maintained by metrolist, Inc. may not reflect all real estate activity in the market.
12. March 2009 - Real Estate Market Statistics
Denver Southwest - DSW
Closed Residential
Category Mar-08 Mar-09 % Change 2008 2009
#Of Closed Sales - Month 162 167 3.1% 300
250
#Of Closed Sales - YTD 474 504 6.3%
200
Avg. Days On Market 97 74 -23.7%
150
# Of Active Listings 958 487 -49.2%
100
# Of NEW Listings 377 305 -19.1%
50
Absorption Rate (in months) 6.3 2.9 -54.8% 0
Jan Feb M ar A pr M ay Jun Jul A ug Sep Oct No v Dec
Average Price (Sold) 134,570 118,262 -12.1%
Closed Condo
Category Mar-08 Mar-09 % Change 2008 2009
#Of Closed Sales - Month 30 25 -16.7% 50
#Of Closed Sales - YTD 79 63 -20.3% 40
Avg. Days On Market 99 154 55.6% 30
# Of Active Listings 223 187 -16.1% 20
# Of NEW Listings 78 81 3.8% 10
Absorption Rate (in months) 7.9 6.9 -12.9% 0
Jan Feb M ar A pr M ay Jun Jul A ug Sep Oct No v Dec
Average Price (Sold) 109,754 176,325 60.7%
Land Title has more than 50 office locations to serve you.
Visit our website at www.LTGC.com to find
a closing location near you.
http://www.ltgc.com
Based on Information from Metrolist, Inc. for the period Jan 2007 through present.Note: This representation is based in whole or in part on data supplied by Metrolist, Inc. Metrolist, Inc.
does not guarantee nor is in any way resposible for its accuracy. Data maintained by metrolist, Inc. may not reflect all real estate activity in the market.
13. March 2009 - Real Estate Market Statistics
Downtown Denver - DTD
Closed Residential
Category Mar-08 Mar-09 % Change 2008 2009
#Of Closed Sales - Month #Num! 1.2
1
#Of Closed Sales - YTD 1 -100.0%
0.8
Avg. Days On Market #Num!
0.6
# Of Active Listings 11 13 18.2%
0.4
# Of NEW Listings 2 -100.0%
0.2
Absorption Rate (in months) . . #Num! 0
Jan Feb M ar A pr M ay Jun Jul A ug Sep Oct No v Dec
Average Price (Sold) #Num!
Closed Condo
Category Mar-08 Mar-09 % Change 2008 2009
#Of Closed Sales - Month 29 16 -44.8% 70
60
#Of Closed Sales - YTD 70 36 -48.6%
50
Avg. Days On Market 128 115 -10.2% 40
30
# Of Active Listings 377 391 3.7%
20
# Of NEW Listings 118 116 -1.7%
10
Absorption Rate (in months) 12.2 23.1 88.4% 0
Jan Feb M ar A pr M ay Jun Jul A ug Sep Oct No v Dec
Average Price (Sold) 506,394 334,088 -34.0%
Land Title has more than 50 office locations to serve you.
Visit our website at www.LTGC.com to find
a closing location near you.
http://www.ltgc.com
Based on Information from Metrolist, Inc. for the period Jan 2007 through present.Note: This representation is based in whole or in part on data supplied by Metrolist, Inc. Metrolist, Inc.
does not guarantee nor is in any way resposible for its accuracy. Data maintained by metrolist, Inc. may not reflect all real estate activity in the market.
14. March 2009 - Real Estate Market Statistics
East Suburban North - ESN
Closed Residential
Category Mar-08 Mar-09 % Change 2008 2009
#Of Closed Sales - Month 8 2 -75.0% 10
#Of Closed Sales - YTD 13 9 -30.8% 8
Avg. Days On Market 205 106 -48.3% 6
# Of Active Listings 75 44 -41.3% 4
# Of NEW Listings 20 18 -10.0% 2
Absorption Rate (in months) 9.1 22.5 146.6% 0
Jan Feb M ar A pr M ay Jun Jul A ug Sep Oct No v Dec
Average Price (Sold) 360,351 245,019 -32.0%
Closed Condo
Category Mar-08 Mar-09 % Change 2008 2009
#Of Closed Sales - Month #Num! 1.2
1
#Of Closed Sales - YTD #Num!
0.8
Avg. Days On Market #Num!
0.6
# Of Active Listings 1 -100.0%
0.4
# Of NEW Listings #Num!
0.2
Absorption Rate (in months) . . #Num! 0
Jan Feb M ar A pr M ay Jun Jul A ug Sep Oct No v Dec
Average Price (Sold) #Num!
Land Title has more than 50 office locations to serve you.
Visit our website at www.LTGC.com to find
a closing location near you.
http://www.ltgc.com
Based on Information from Metrolist, Inc. for the period Jan 2007 through present.Note: This representation is based in whole or in part on data supplied by Metrolist, Inc. Metrolist, Inc.
does not guarantee nor is in any way resposible for its accuracy. Data maintained by metrolist, Inc. may not reflect all real estate activity in the market.
15. March 2009 - Real Estate Market Statistics
East Suburban South - ESS
Closed Residential
Category Mar-08 Mar-09 % Change 2008 2009
#Of Closed Sales - Month 39 34 -12.8% 60
50
#Of Closed Sales - YTD 101 102 1.0%
40
Avg. Days On Market 125 137 9.6%
30
# Of Active Listings 329 323 -1.8%
20
# Of NEW Listings 108 99 -8.3%
10
Absorption Rate (in months) 7.9 9.5 19.9% 0
Jan Feb M ar A pr M ay Jun Jul A ug Sep Oct No v Dec
Average Price (Sold) 246,652 266,085 7.9%
Closed Condo
Category Mar-08 Mar-09 % Change 2008 2009
#Of Closed Sales - Month 2 -100.0% 5
#Of Closed Sales - YTD 3 3 0.0% 4
Avg. Days On Market 105 -100.0% 3
# Of Active Listings 7 12 71.4% 2
# Of NEW Listings 2 3 50.0% 1
Absorption Rate (in months) 3. . -100.0% 0
Jan Feb M ar A pr M ay Jun Jul A ug Sep Oct No v Dec
Average Price (Sold) 75,500 -100.0%
Land Title has more than 50 office locations to serve you.
Visit our website at www.LTGC.com to find
a closing location near you.
http://www.ltgc.com
Based on Information from Metrolist, Inc. for the period Jan 2007 through present.Note: This representation is based in whole or in part on data supplied by Metrolist, Inc. Metrolist, Inc.
does not guarantee nor is in any way resposible for its accuracy. Data maintained by metrolist, Inc. may not reflect all real estate activity in the market.
16. March 2009 - Real Estate Market Statistics
Jefferson County Central - JFC
Closed Residential
Category Mar-08 Mar-09 % Change 2008 2009
#Of Closed Sales - Month 57 46 -19.3% 80
70
#Of Closed Sales - YTD 136 115 -15.4%
60
50
Avg. Days On Market 125 121 -3.2%
40
# Of Active Listings 292 233 -20.2% 30
20
# Of NEW Listings 132 124 -6.1%
10
Absorption Rate (in months) 5.4 4.7 -13.1% 0
Jan Feb M ar A pr M ay Jun Jul A ug Sep Oct No v Dec
Average Price (Sold) 256,936 213,260 -17.0%
Closed Condo
Category Mar-08 Mar-09 % Change 2008 2009
#Of Closed Sales - Month 13 8 -38.5% 20
#Of Closed Sales - YTD 39 23 -41.0%
15
Avg. Days On Market 189 68 -64.0%
10
# Of Active Listings 90 69 -23.3%
5
# Of NEW Listings 30 24 -20.0%
Absorption Rate (in months) 6.7 9. 34.5% 0
Jan Feb M ar A pr M ay Jun Jul A ug Sep Oct No v Dec
Average Price (Sold) 239,940 89,100 -62.9%
Land Title has more than 50 office locations to serve you.
Visit our website at www.LTGC.com to find
a closing location near you.
http://www.ltgc.com
Based on Information from Metrolist, Inc. for the period Jan 2007 through present.Note: This representation is based in whole or in part on data supplied by Metrolist, Inc. Metrolist, Inc.
does not guarantee nor is in any way resposible for its accuracy. Data maintained by metrolist, Inc. may not reflect all real estate activity in the market.
17. March 2009 - Real Estate Market Statistics
Jefferson County North - JFN
Closed Residential
Category Mar-08 Mar-09 % Change 2008 2009
#Of Closed Sales - Month 39 31 -20.5% 50
#Of Closed Sales - YTD 97 83 -14.4% 40
Avg. Days On Market 95 72 -24.2% 30
# Of Active Listings 179 105 -41.3% 20
# Of NEW Listings 84 59 -29.8% 10
Absorption Rate (in months) 4.2 3.5 -17.7% 0
Jan Feb M ar A pr M ay Jun Jul A ug Sep Oct No v Dec
Average Price (Sold) 221,757 210,954 -4.9%
Closed Condo
Category Mar-08 Mar-09 % Change 2008 2009
#Of Closed Sales - Month 6 3 -50.0% 20
#Of Closed Sales - YTD 22 12 -45.5%
15
Avg. Days On Market 181 72 -60.2%
10
# Of Active Listings 44 32 -27.3%
5
# Of NEW Listings 16 12 -25.0%
Absorption Rate (in months) 6.7 10. 50.0% 0
Jan Feb M ar A pr M ay Jun Jul A ug Sep Oct No v Dec
Average Price (Sold) 120,200 176,300 46.7%
Land Title has more than 50 office locations to serve you.
Visit our website at www.LTGC.com to find
a closing location near you.
http://www.ltgc.com
Based on Information from Metrolist, Inc. for the period Jan 2007 through present.Note: This representation is based in whole or in part on data supplied by Metrolist, Inc. Metrolist, Inc.
does not guarantee nor is in any way resposible for its accuracy. Data maintained by metrolist, Inc. may not reflect all real estate activity in the market.
18. March 2009 - Real Estate Market Statistics
Jefferson County South - JFS
Closed Residential
Category Mar-08 Mar-09 % Change 2008 2009
#Of Closed Sales - Month 98 91 -7.1% 200
#Of Closed Sales - YTD 271 217 -19.9%
150
Avg. Days On Market 110 98 -10.9%
100
# Of Active Listings 549 499 -9.1%
50
# Of NEW Listings 293 257 -12.3%
Absorption Rate (in months) 5.4 5.4 0.6% 0
Jan Feb M ar A pr M ay Jun Jul A ug Sep Oct No v Dec
Average Price (Sold) 316,255 279,682 -11.6%
Closed Condo
Category Mar-08 Mar-09 % Change 2008 2009
#Of Closed Sales - Month 31 28 -9.7% 60
50
#Of Closed Sales - YTD 86 71 -17.4%
40
Avg. Days On Market 79 109 38.0%
30
# Of Active Listings 230 193 -16.1%
20
# Of NEW Listings 98 81 -17.3%
10
Absorption Rate (in months) 7.2 6.7 -6.2% 0
Jan Feb M ar A pr M ay Jun Jul A ug Sep Oct No v Dec
Average Price (Sold) 161,061 154,624 -4.0%
Land Title has more than 50 office locations to serve you.
Visit our website at www.LTGC.com to find
a closing location near you.
http://www.ltgc.com
Based on Information from Metrolist, Inc. for the period Jan 2007 through present.Note: This representation is based in whole or in part on data supplied by Metrolist, Inc. Metrolist, Inc.
does not guarantee nor is in any way resposible for its accuracy. Data maintained by metrolist, Inc. may not reflect all real estate activity in the market.
19. March 2009 - Real Estate Market Statistics
Jefferson County West - JFW
Closed Residential
Category Mar-08 Mar-09 % Change 2008 2009
#Of Closed Sales - Month 40 33 -17.5% 70
60
#Of Closed Sales - YTD 110 80 -27.3%
50
Avg. Days On Market 111 76 -31.5% 40
30
# Of Active Listings 273 291 6.6%
20
# Of NEW Listings 132 130 -1.5%
10
Absorption Rate (in months) 6.6 8.7 32.7% 0
Jan Feb M ar A pr M ay Jun Jul A ug Sep Oct No v Dec
Average Price (Sold) 396,735 353,348 -10.9%
Closed Condo
Category Mar-08 Mar-09 % Change 2008 2009
#Of Closed Sales - Month 9 11 22.2% 14
12
#Of Closed Sales - YTD 29 23 -20.7%
10
Avg. Days On Market 138 146 5.8% 8
6
# Of Active Listings 60 72 20.0%
4
# Of NEW Listings 25 19 -24.0%
2
Absorption Rate (in months) 5.9 6.3 6.5% 0
Jan Feb M ar A pr M ay Jun Jul A ug Sep Oct No v Dec
Average Price (Sold) 177,193 212,518 19.9%
Land Title has more than 50 office locations to serve you.
Visit our website at www.LTGC.com to find
a closing location near you.
http://www.ltgc.com
Based on Information from Metrolist, Inc. for the period Jan 2007 through present.Note: This representation is based in whole or in part on data supplied by Metrolist, Inc. Metrolist, Inc.
does not guarantee nor is in any way resposible for its accuracy. Data maintained by metrolist, Inc. may not reflect all real estate activity in the market.
20. March 2009 - Real Estate Market Statistics
Jefferson County Northcentral - JNC
Closed Residential
Category Mar-08 Mar-09 % Change 2008 2009
#Of Closed Sales - Month 104 86 -17.3% 160
140
#Of Closed Sales - YTD 238 209 -12.2%
120
100
Avg. Days On Market 98 80 -18.4%
80
# Of Active Listings 460 392 -14.8% 60
40
# Of NEW Listings 256 213 -16.8%
20
Absorption Rate (in months) 4.3 4.3 -0.5% 0
Jan Feb M ar A pr M ay Jun Jul A ug Sep Oct No v Dec
Average Price (Sold) 222,556 201,349 -9.5%
Closed Condo
Category Mar-08 Mar-09 % Change 2008 2009
#Of Closed Sales - Month 34 16 -52.9% 50
#Of Closed Sales - YTD 68 46 -32.4% 40
Avg. Days On Market 118 93 -21.2% 30
# Of Active Listings 150 146 -2.7% 20
# Of NEW Listings 71 57 -19.7% 10
Absorption Rate (in months) 4.2 8.4 99.2% 0
Jan Feb M ar A pr M ay Jun Jul A ug Sep Oct No v Dec
Average Price (Sold) 124,556 122,119 -2.0%
Land Title has more than 50 office locations to serve you.
Visit our website at www.LTGC.com to find
a closing location near you.
http://www.ltgc.com
Based on Information from Metrolist, Inc. for the period Jan 2007 through present.Note: This representation is based in whole or in part on data supplied by Metrolist, Inc. Metrolist, Inc.
does not guarantee nor is in any way resposible for its accuracy. Data maintained by metrolist, Inc. may not reflect all real estate activity in the market.
21. March 2009 - Real Estate Market Statistics
Jefferson County Southcentral - JSC
Closed Residential
Category Mar-08 Mar-09 % Change 2008 2009
#Of Closed Sales - Month 68 56 -17.6% 120
100
#Of Closed Sales - YTD 188 151 -19.7%
80
Avg. Days On Market 80 91 13.8%
60
# Of Active Listings 383 332 -13.3%
40
# Of NEW Listings 205 173 -15.6%
20
Absorption Rate (in months) 5.5 5.7 5.1% 0
Jan Feb M ar A pr M ay Jun Jul A ug Sep Oct No v Dec
Average Price (Sold) 244,124 222,333 -8.9%
Closed Condo
Category Mar-08 Mar-09 % Change 2008 2009
#Of Closed Sales - Month 39 31 -20.5% 60
50
#Of Closed Sales - YTD 102 95 -6.9%
40
Avg. Days On Market 105 91 -13.3%
30
# Of Active Listings 232 192 -17.2%
20
# Of NEW Listings 93 101 8.6%
10
Absorption Rate (in months) 5.8 5.8 -0.1% 0
Jan Feb M ar A pr M ay Jun Jul A ug Sep Oct No v Dec
Average Price (Sold) 167,755 106,910 -36.3%
Land Title has more than 50 office locations to serve you.
Visit our website at www.LTGC.com to find
a closing location near you.
http://www.ltgc.com
Based on Information from Metrolist, Inc. for the period Jan 2007 through present.Note: This representation is based in whole or in part on data supplied by Metrolist, Inc. Metrolist, Inc.
does not guarantee nor is in any way resposible for its accuracy. Data maintained by metrolist, Inc. may not reflect all real estate activity in the market.
22. March 2009 - Real Estate Market Statistics
Lafayette - LAF
Closed Residential
Category Mar-08 Mar-09 % Change 2008 2009
#Of Closed Sales - Month 17 9 -47.1% 30
25
#Of Closed Sales - YTD 37 34 -8.1%
20
Avg. Days On Market 107 124 15.9%
15
# Of Active Listings 81 100 23.5%
10
# Of NEW Listings 30 36 20.0%
5
Absorption Rate (in months) 4.5 9.9 118.3% 0
Jan Feb M ar A pr M ay Jun Jul A ug Sep Oct No v Dec
Average Price (Sold) 373,947 332,633 -11.0%
Closed Condo
Category Mar-08 Mar-09 % Change 2008 2009
#Of Closed Sales - Month 6 4 -33.3% 10
#Of Closed Sales - YTD 15 8 -46.7% 8
Avg. Days On Market 81 104 28.4% 6
# Of Active Listings 13 17 30.8% 4
# Of NEW Listings 5 8 60.0% 2
Absorption Rate (in months) 3.8 5.3 37.0% 0
Jan Feb M ar A pr M ay Jun Jul A ug Sep Oct No v Dec
Average Price (Sold) 149,417 145,081 -2.9%
Land Title has more than 50 office locations to serve you.
Visit our website at www.LTGC.com to find
a closing location near you.
http://www.ltgc.com
Based on Information from Metrolist, Inc. for the period Jan 2007 through present.Note: This representation is based in whole or in part on data supplied by Metrolist, Inc. Metrolist, Inc.
does not guarantee nor is in any way resposible for its accuracy. Data maintained by metrolist, Inc. may not reflect all real estate activity in the market.
23. March 2009 - Real Estate Market Statistics
Mountain Clear Creek - MCC
Closed Residential
Category Mar-08 Mar-09 % Change 2008 2009
#Of Closed Sales - Month 6 4 -33.3% 12
10
#Of Closed Sales - YTD 15 10 -33.3%
8
Avg. Days On Market 73 103 41.1%
6
# Of Active Listings 94 108 14.9%
4
# Of NEW Listings 21 25 19.0%
2
Absorption Rate (in months) 15.5 24.3 56.5% 0
Jan Feb M ar A pr M ay Jun Jul A ug Sep Oct No v Dec
Average Price (Sold) 228,250 153,225 -32.9%
Closed Condo
Category Mar-08 Mar-09 % Change 2008 2009
#Of Closed Sales - Month 3 #Div/0! 3.5
3
#Of Closed Sales - YTD 1 4 300.0%
2.5
Avg. Days On Market 100 #Div/0! 2
1.5
# Of Active Listings 33 30 -9.1%
1
# Of NEW Listings 12 -100.0%
0.5
Absorption Rate (in months) . 11.3 #Div/0! 0
Jan Feb M ar A pr M ay Jun Jul A ug Sep Oct No v Dec
Average Price (Sold) 84,746 #Div/0!
Land Title has more than 50 office locations to serve you.
Visit our website at www.LTGC.com to find
a closing location near you.
http://www.ltgc.com
Based on Information from Metrolist, Inc. for the period Jan 2007 through present.Note: This representation is based in whole or in part on data supplied by Metrolist, Inc. Metrolist, Inc.
does not guarantee nor is in any way resposible for its accuracy. Data maintained by metrolist, Inc. may not reflect all real estate activity in the market.
24. March 2009 - Real Estate Market Statistics
Mountain Conifer Pine - MCP
Closed Residential
Category Mar-08 Mar-09 % Change 2008 2009
#Of Closed Sales - Month 31 18 -41.9% 35
30
#Of Closed Sales - YTD 73 37 -49.3%
25
Avg. Days On Market 192 181 -5.7% 20
15
# Of Active Listings 209 257 23.0%
10
# Of NEW Listings 49 72 46.9%
5
Absorption Rate (in months) 6.6 13.8 108.3% 0
Jan Feb M ar A pr M ay Jun Jul A ug Sep Oct No v Dec
Average Price (Sold) 372,804 305,177 -18.1%
Closed Condo
Category Mar-08 Mar-09 % Change 2008 2009
#Of Closed Sales - Month #Num! 1
#Of Closed Sales - YTD #Num! 0.8
Avg. Days On Market #Num! 0.6
# Of Active Listings #Num! 0.4
# Of NEW Listings #Num! 0.2
Absorption Rate (in months) . . #Num! 0
Jan Feb M ar A pr M ay Jun Jul A ug Sep Oct No v Dec
Average Price (Sold) #Num!
Land Title has more than 50 office locations to serve you.
Visit our website at www.LTGC.com to find
a closing location near you.
http://www.ltgc.com
Based on Information from Metrolist, Inc. for the period Jan 2007 through present.Note: This representation is based in whole or in part on data supplied by Metrolist, Inc. Metrolist, Inc.
does not guarantee nor is in any way resposible for its accuracy. Data maintained by metrolist, Inc. may not reflect all real estate activity in the market.
25. March 2009 - Real Estate Market Statistics
Mountain Evergreen North - MEN
Closed Residential
Category Mar-08 Mar-09 % Change 2008 2009
#Of Closed Sales - Month 16 14 -12.5% 25
#Of Closed Sales - YTD 54 31 -42.6% 20
Avg. Days On Market 134 145 8.2% 15
# Of Active Listings 181 236 30.4% 10
# Of NEW Listings 57 64 12.3% 5
Absorption Rate (in months) 10.3 15.9 53.8% 0
Jan Feb M ar A pr M ay Jun Jul A ug Sep Oct No v Dec
Average Price (Sold) 504,619 369,629 -26.8%
Closed Condo
Category Mar-08 Mar-09 % Change 2008 2009
#Of Closed Sales - Month 3 1 -66.7% 3.5
3
#Of Closed Sales - YTD 5 3 -40.0%
2.5
Avg. Days On Market 235 97 -58.7% 2
1.5
# Of Active Listings 22 36 63.6%
1
# Of NEW Listings 6 12 100.0%
0.5
Absorption Rate (in months) 7.3 34. 363.6% 0
Jan Feb M ar A pr M ay Jun Jul A ug Sep Oct No v Dec
Average Price (Sold) 136,000 225,000 65.4%
Land Title has more than 50 office locations to serve you.
Visit our website at www.LTGC.com to find
a closing location near you.
http://www.ltgc.com
Based on Information from Metrolist, Inc. for the period Jan 2007 through present.Note: This representation is based in whole or in part on data supplied by Metrolist, Inc. Metrolist, Inc.
does not guarantee nor is in any way resposible for its accuracy. Data maintained by metrolist, Inc. may not reflect all real estate activity in the market.
26. March 2009 - Real Estate Market Statistics
Mountain Evergreen South - MES
Closed Residential
Category Mar-08 Mar-09 % Change 2008 2009
#Of Closed Sales - Month 15 11 -26.7% 20
#Of Closed Sales - YTD 34 22 -35.3%
15
Avg. Days On Market 173 154 -11.0%
10
# Of Active Listings 107 130 21.5%
5
# Of NEW Listings 38 45 18.4%
Absorption Rate (in months) 6.7 10.6 59.5% 0
Jan Feb M ar A pr M ay Jun Jul A ug Sep Oct No v Dec
Average Price (Sold) 392,260 332,636 -15.2%
Closed Condo
Category Mar-08 Mar-09 % Change 2008 2009
#Of Closed Sales - Month #Num! 3.5
3
#Of Closed Sales - YTD #Num!
2.5
Avg. Days On Market #Num! 2
1.5
# Of Active Listings 4 8 100.0%
1
# Of NEW Listings 3 #Div/0!
0.5
Absorption Rate (in months) . . #Num! 0
Jan Feb M ar A pr M ay Jun Jul A ug Sep Oct No v Dec
Average Price (Sold) #Num!
Land Title has more than 50 office locations to serve you.
Visit our website at www.LTGC.com to find
a closing location near you.
http://www.ltgc.com
Based on Information from Metrolist, Inc. for the period Jan 2007 through present.Note: This representation is based in whole or in part on data supplied by Metrolist, Inc. Metrolist, Inc.
does not guarantee nor is in any way resposible for its accuracy. Data maintained by metrolist, Inc. may not reflect all real estate activity in the market.
27. March 2009 - Real Estate Market Statistics
Mountain Gilpin County - MGC
Closed Residential
Category Mar-08 Mar-09 % Change 2008 2009
#Of Closed Sales - Month 6 3 -50.0% 14
12
#Of Closed Sales - YTD 15 13 -13.3%
10
Avg. Days On Market 117 138 17.9% 8
6
# Of Active Listings 94 102 8.5%
4
# Of NEW Listings 19 24 26.3%
2
Absorption Rate (in months) 14.3 31.7 120.9% 0
Jan Feb M ar A pr M ay Jun Jul A ug Sep Oct No v Dec
Average Price (Sold) 200,095 263,833 31.9%
Closed Condo
Category Mar-08 Mar-09 % Change 2008 2009
#Of Closed Sales - Month #Num! 1.2
1
#Of Closed Sales - YTD 2 1 -50.0%
0.8
Avg. Days On Market #Num!
0.6
# Of Active Listings 5 5 0.0%
0.4
# Of NEW Listings 3 #Div/0!
0.2
Absorption Rate (in months) . . #Num! 0
Jan Feb M ar A pr M ay Jun Jul A ug Sep Oct No v Dec
Average Price (Sold) #Num!
Land Title has more than 50 office locations to serve you.
Visit our website at www.LTGC.com to find
a closing location near you.
http://www.ltgc.com
Based on Information from Metrolist, Inc. for the period Jan 2007 through present.Note: This representation is based in whole or in part on data supplied by Metrolist, Inc. Metrolist, Inc.
does not guarantee nor is in any way resposible for its accuracy. Data maintained by metrolist, Inc. may not reflect all real estate activity in the market.