
Recommandé
Recommandé
Contenu connexe
En vedette
En vedette (19)
Plus de jenniferpurgill
Dernier
Dernier (20)
Leaf disk lab
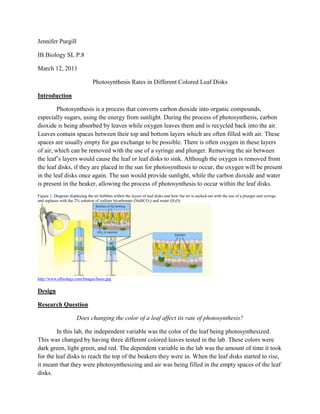
- 1. Jennifer Purgill IB Biology SL P.8 March 12, 2011 Photosynthesis Rates in Different Colored Leaf Disks Introduction Photosynthesis is a process that converts carbon dioxide into organic compounds, especially sugars, using the energy from sunlight. During the process of photosynthesis, carbon dioxide is being absorbed by leaves while oxygen leaves them and is recycled back into the air. Leaves contain spaces between their top and bottom layers which are often filled with air. These spaces are usually empty for gas exchange to be possible. There is often oxygen in these layers of air, which can be removed with the use of a syringe and plunger. Removing the air between the leaf’s layers would cause the leaf or leaf disks to sink. Although the oxygen is removed from the leaf disks, if they are placed in the sun for photosynthesis to occur, the oxygen will be present in the leaf disks once again. The sun would provide sunlight, while the carbon dioxide and water is present in the beaker, allowing the process of photosynthesis to occur within the leaf disks. Figure 1: Diagram displaying the air bubbles within the layers of leaf disks and how the air is sucked out with the use of a plunger and syringe and replaces with the 2% solution of sodium bicarbonate (NaHCO3) and water (H2O) http://www.elbiology.com/Images/basis.jpg Design Research Question Does changing the color of a leaf affect its rate of photosynthesis? In this lab, the independent variable was the color of the leaf being photosynthesized. This was changed by having three different colored leaves tested in the lab. These colors were dark green, light green, and red. The dependent variable in the lab was the amount of time it took for the leaf disks to reach the top of the beakers they were in. When the leaf disks started to rise, it meant that they were photosynthesizing and air was being filled in the empty spaces of the leaf disks.
- 2. Controlled Variables There were multiple controlled variables in this lab. One of the controls was the time that the experiment was done. All of the trials were conducted during the same class period, ensuring that there is almost a constant in the amount of sun bring shone on the leaf disks. Another control was the location of where all the trials of the lab were done. Since all of the trials were done in the same location, there was an equal amount of sun shining on the leaf disks in all trials. A third control of this lab was the size of the leaf disks used in the experiment for each trial. This was kept constant by using the same hole-puncher to create all of the leaf disks. It is important that the size of the leaf disks is kept constant because if some disks are larger than others, then they would have a larger surface area to absorb the sunlight and may photosynthesize faster. For each of the 4 trials done per leaf, all of the leaves of each color were taken from the same plant. This ensures that the color of the leaves used in each trial for the different colors was the same. Using different leaves with only similar color but not from the same plant could affect the results as one type of plant could possibly photosynthesize faster. Materials and Procedure 500 mL of water (H2O) was placed inside a 500 mL beaker and 10 g of sodium bicarbonate (NaHCO3) were added. This created a 2% solution when the NaHCO3was mixed with the 500 mL of H2O. Three different colors of leaves were collected: light green leaves, dark green leaves, and red leaves. 40 holes were punched in each colored leaf with a single hole-puncherto create the 40 leaf disks used in the lab. 40 mL of the 2% solution was added to a syringe. A cap was placed on one end of the syringe and the plunger was put in the other end. The plunger was pulled repeatedly until all of the 40 leaf disks inside the syringe sunk to the bottom. Once all of the leaf disks sank, this meant that all of the oxygen had been removed from the leaf disks. After all of the oxygen was removed from the leaf disks, they were placed inside a dark drawer until needed to prevent them from coming in contact with any form of light. After all the leaf disks were made, 4 40 mL sized beakers were filled to the 40 mL mark with the 2% solution and placed in the sun. Next, 10 leaf disks from the dark green leaf were placed into each beaker. The times of the first 4 leaf disks to rise in each beaker were recorded with one stop watchand written down in tables. This process was repeated for another 3 trials with the same colored leaf disks. All of the beakers were washed between each trial and new, unused solution was added into the beakers. The process was then repeated 4 times for the light green colored leaf disks, then another 4 times for the red colored leaf disks.
- 3. Figure 2: 40 Leaf Disks cut from dark green leaves of the same plant; the disks were cut with the same hole puncher. This figure shows the 40 leaf disks which were used for the first trial for the dark green leaves. All of the disks were cut with the same hole-puncher, ensuring they were all the exact same size. Figure 3: 4 Beakers set up in the same location, each containing 10 red leaf disks This figure shows the setup of the small beakers filled with 40 mL of 2% solution of sodium bicarbonate (NaHCO3) and Water (H2O). There were 10 leaf disks in each beaker. The times of the first 4 leaf disks to rise in each beaker were recorded. Figure 4: A syringe filled with 20 light green disks to have the oxygen removed from them This figure shows leaf disks being placed inside a syringe to have the air bubbles between the layers of the leaf removed in order for the disks to have a chance to re-photosynthesize.
- 4. Data Collection and Processing Table 1: Table showing the times measured in seconds for the first 4 dark green leaf disks to rise to the top of each beaker for each trial and their averages Dark Green Times of the first 4 leaf disks to rise per trial (s) (±2) Trials Leaf Disk 1 Leaf Disk 2 Leaf Disk 3 Leaf Disk 4 Average 1 263 344 345 350 326 2 294 295 296 299 296 3 231 270 369 402 318 4 203 219 228 241 223 It can be seen that it did not take a very long time for the first 4 dark green leaf disks to rise in each of the 4 beakers compared to the times of the light green and red leaf disks. Table 2: Table showing the times measured in seconds for the first 4 light green leaf disks to rise to the top of each beaker for each trial and their averages Light Green Times of the first 4 leaf disks to rise per trial (s) (±2) Trials Leaf Disk 1 Leaf Disk 2 Leaf Disk 3 Leaf Disk 4 Average 1 345 790 869 917 730 2 400 621 705 891 654 3 372 1097 1103 1137 927 4 874 934 939 961 927 It can be seen here that the first 4leaf disks of each beaker took a longer time to rise to the top of the beakers than the dark green leaf disks. This means that the rate of photosynthesis for the light green leaf disks was lower than the rate of photosynthesis for the dark green leaves. Table 3: Table showing the times measured in seconds for the first 4 red leaf disks to rise to the top of each beaker for each trial and their averages Red Time of the first 4 leaf disks to rise per trial (s) (±2) Trials Leaf Disk 1 Leaf Disk 2 Leaf Disk 3 Leaf Disk 4 Average 1 513 921 1101 1612 1037 2 498 636 666 1376 794 3 443 653 1108 1227 858 4 420 428 1644 1652 1036 It can be seen here that the first 4 red leaf disks of each beaker took on average the longest time to rise to the top. This means that the red colored leaves had the lowest rate of photosynthesis when being compared to the rate of dark green and light green leaves. The times in all of the tables were found by using a stopwatch to time how long it took for the first 4 leaf disks to rise to the top of each beaker in all 4 trials for each differently colored leaf. The times were then converted into seconds. The averages times for the first 4 leaf disks to rise to the top of each of the beakers was calculated by adding up the times that the leaf disks rose in each trial then dividing by 4 because there were 4 leaf disks. The formula for this is Average= . When expressed in numbers if the red leaf disks’ average time to rising to the top in trial 1 was being calculated, the formula would be Average= , which would state that the average time was 1037 seconds.
- 5. Figure 5: Sample Graph showing the first trial of red leaf disks where the x-axis represents the number of the leaf disks in the order they rose and the y-axis represents the times in seconds at which the leaf disks rose This is a sample graph showing the times at which the first 4 red leaf disks rose for trial one of this lab. Three T-tests were done in order to test if there was a significant difference in the amount of time it took for the first 4 leaf disks to rise to the top of the 4 beakers. The data which was put into the T-tests was the raw data which was collected while the lab was being conducted. The first T-test which was conducted compared the times at which the dark green leaf disks and the light green lead disks rose to the top of their beakers. According to the test, the two-tailed P value was less than 0.0001. By conventional criteria, this difference is considered to be extremely statistically significant. The next T-test which was done compared the dark green leaf disk and red leaf disk times at which the disks reached the top of the beaker. The two-tailed P value was less that 0.0001 and by conventional criteria, this difference is considered to be extremely statistically significant. The third T-test which was done compared the times at which the light green leaf disks and the red leaf disks rose to the top of the beakers. The two-tailed P value was equal to 0.3608 and by conventional criteria, this difference is considered to not be statistically significant. These results support the idea that the rate at which leaves photosynthesize could change based on the color of the leaves. The T-tests stated that when comparing the times at which the first 4 leaf disks of each beaker rose to the top, there was a significant difference at which the times of the dark green leaf disks rose compared to the times of both the light green leaf disks and the red leaf disks.
- 6. Conclusion and Evaluation It can be concluded from the results found in this lab that the color of leaves can affect the rate at which they photosynthesize. This idea can be supported with the use of the T-tests which state that the dark green leaf disks rose at a significantly higher rate than the light green leaf disks and red leaf disks. When comparing the light green and red leaf disks though, there was not a significant difference in the rates at which the leaf disks rose. Although this is true, there is still a significant difference between the rates of the dark green leaf disks compared to the other two colors that were tested. The color of a leaf may affect the rate of photosynthesis because the greener a leaf is, the more chlorophyll it contains. The more chlorophyll a leaf contains, the faster a leaf photosynthesizes because there are more enzymes and chlorophyll to react with the sunlight. There were a few problems which occurred when this lab was being conducted. One problem was that the sunlight was not constant throughout the lab because sometimes there were clouds which would change the amount of sunlight hitting the leaf disks. Another problem was that there was no way to tell exactly how much air had been sucked out of the leaf disks. This was a problem because if there was a lot of air sucked out of one leaf disk but not another, then the one with more air would rise before the leaf disk with less air between the leaf disk layers. Some problems which occurred during the lab could have been prevented. The problem with the sunlight not being constant could be fixed by using a lamp indoors rather than sunlight because this would keep the amount of light being shined on the leaves constant. The problem with not knowing how much air is still left in each leaf disk could be solved by repeating the process of removing the air from the leaf disks twice to ensure that most of the air is removed from all of the leaf disks.