SlideShare une entreprise Scribd logo
1  sur  13
Télécharger pour lire hors ligne
1	
	
“Field Lubricity Measurements Correlate with Improved Performance of
Novel Water-Based Drilling Fluid”
M. Redburn, H. Dearing, Newpark Drilling Fluids, F. Growcock, Occidental Oil and
Gas Corporation
This paper was presented at the 11
th
Offshore Mediterranean Conference and Exhibition in Ravenna, Italy, March 20-22, 2013. It
was selected for presentation by OMC 2013 Programme Committee following review of information contained in the abstract
submitted by the author(s). The Paper as presented at OMC 2013 has not been reviewed by the Programme Committee.
Abstract
A significant function of drilling fluids is reduction of frictional forces between the wellbore and
the drill string. New techniques in drilling and completions are being used to drill horizontal
wells in unconventional resources. Because these frictional forces can potentially limit the lateral
length of a well, it is especially important to manage friction to avoid excessive torque and drag
on the drill string. A high-performance water based fluid has been developed that reduces
torque and drag to levels normally associated with non-aqueous fluids (NAFs).
A lubricity tester is often used to evaluate and predict the impact made from the use of a drilling
fluid additive on friction. The most common tester, the Fann or OFITE Model 212, is normally
used in a laboratory setting. This EP (Extreme Pressure) and Lubricity Tester is designed to
simulate contact between a drill string and casing and consists of a rotating ring and stationary
block, which are immersed in the drilling fluid. Since an exact load under wellbore conditions is
hard to determine, typically fixed levels of contact forces are used.
While the EP and Lubricity Tester has been used in drilling fluid laboratories for many years, it
has not been used as an instrument in the field on a regular basis until now. When the results
of lubricity tests are measured and reported daily, the fluid can be modified with additives to
maintain a target Coefficient of Friction, or CoF. Because fluid lubricity is affected by changing
drilling fluid properties and wellbore conditions, infrequent laboratory lubricity tests provide little
benefit, whereas field measurements made on a regular basis can help to ensure that the
lubricity of the fluid stays on target. Regular field measurements also allow for detailed
statistical analysis of the lubricity and its relationship to other fluid properties.
Controlling the drilling fluid lubricity within specified ranges and comparing the CoF to wellbore
torque and drag achieves the results required of a high-performance fluid in critical applications.
Post-well analysis with industry-accepted software can be used to find a corresponding wellbore
friction factor on the final casing run. In this study, over 50 casing runs made with the high-
performance drilling fluid were analyzed and correlated with the measured CoF. By doing so,
the benefits of the high-performance water based fluid system could be quantified and its
performance optimized for future applications.
Introduction
With the explosive growth of drilling into unconventional shale plays, operators have found that
it is imperative to have an effective solution to manage the frictional forces seen in long
horizontal laterals. Although conventional NAFs (oil-based and synthetic-based drilling fluids)
usually provide sufficient lubricity, they also have significant disadvantages, especially high cost,
expensive infrastructure, and growing environmental concerns. To manage the frictional forces
experienced without using NAFs, a high performance water-based fluid was developed that
focuses on reducing friction in long laterals.
2	
	
The concepts associated with friction have been explored by scientists including da Vinci and
Coulomb.1
One useful parameter, the coefficient of friction (CoF), is a unitless number that
serves to indicate the mechanical interaction between two surfaces. The static CoF is the ratio
of the force required to initiate movement to the normal force holding the surfaces together. The
kinetic CoF is the ratio of the force required to continuously move the surfaces to the normal
force holding the surfaces together. Generally, it is the kinetic CoF that is measured and is
thought to provide a measure of the frictional forces encountered while drilling ahead. When the
contact surfaces are immersed in a fluid, such as the drilling fluid, the force required to move the
surfaces is usually lower. Thus the drilling fluid acts to lubricate the drillstring. The reduction in
CoF provided by the drilling fluid is a function of fluid composition. CoFs measured for water-
based drilling fluids generally range from 0.15 to 0.45, but typically vary from 0.20 to 0.28. CoFs
measured for NAFs generally range from 0.05 to 0.15, but typically vary from 0.07 to 0.14.
The lower the CoF, the easier it is to initiate or sustain movement of the two surfaces. In oil and
gas well drilling, a reduced CoF will allow an operator to easily move and rotate the drill string in
the wellbore. Every well encounters losses of transitional power to drill the wellbore. This
occurs whether the well is directional or vertical. These losses of power are usually lumped
together and labeled torque and drag and combined in the term “friction factor.” The friction
factor and the CoF are thought to track each other. Overcoming some of the negative forces
exerted on a drill string while drilling a well can provide better weight transfer to the bit and
increase the rate of penetration. Once the well is complete, the power from the drilling rig must
overcome the axial forces to retrieve the pipe from the hole. Reducing the friction factor can
result in longer laterals; less expensive equipment, reduced wear on tools, reduced casing
wear, increased tool life, and reduced vibration.
CoFs can be measured with devices as simple as a sliding block on an inclined plane to high
pressure/temperature systems which have the capability of measuring effects of solid and liquid
additives and periodically replenishing the additive between the contact surfaces. In this study,
CoF measurements were made in the field with a simple ambient pressure and temperature
device that measures the force required to maintain rotation of a steel ring in contact with a steel
block immersed in the drilling fluid. Lubricity tests were conducted on 50 wells, and the results
were compared with friction factors derived from torque and drag data collected while running
casing. The latter were determined using industry-accepted torque and drag software. The
analysis results in a friction factor that can be compared to industry-accepted values as well as
used for design purposes in well planning.
Reducing Friction
There have been numerous mechanical methods proposed to reduce frictional forces in
wellbores. While the advances in mechanical tools to reduce friction have proven successful,
adding this hardware can increase risk from mechanical failure or change the flow pattern and
increase the risk for packing off the annulus with drilled cuttings. In addition, most of these aids
are not available when the casing is run in the wellbore. Since this analysis utilizes data from
casing runs without mechanical aids, their effect cannot be investigated.
Additions to drilling fluids to reduce the frictional forces that are present at contact points
between the well bore and drill pipe have mixed success. Solid materials like beads made from
glass or plastic are used with the idea that the beads act essentially as ball bearings between
the drill pipe and the wellbore. Most successes with solid materials have been in horizontal
wells using smooth, hard materials. However, size degradation of the beads from high speed
ejection through bit nozzles and grinding between the drill string and casing or open hole can be
3	
	
problematic, as will the increase in surface area of the solids.. Drilling beads add to the fluid
expense, and in most cases a significant fraction is removed by solids control equipment at the
surface.
Liquid lubricants added to drilling fluid have successfully achieved a reduction in torque and
drag but effects are generally short lived and or affect the mud properties. Most effective use
has been spot applications and slug treatments on an as needed basis for temporary relief. This
allows the lubricant to effectively wet the surface and maintain a film with some strength.
However, the effect is fleeting, because the film strength is usually not great enough to
withstand the large forces exerted between the drill string and casing or open hole.
Furthermore, liquid lubricants generally lose their effectiveness as they are increasingly
emulsified by shear or by chemical additions needed to maintain drilling fluid properties.2
With the advent of extended reach horizontal wells, it became increasingly clear that water-
based drilling fluids would need to undergo a step change in lubricity. Because of the
limitations of solids and liquid lubricants, it was decided to focus on developing a WBM that had
an intrinsically low CoF and possessed some of the other attributes of NAFs, especially high
levels of shale inhibition. Thus, the development efforts focused on a high-performance (highly
inhibitive, highly lubricious) WBM. Furthermore, since extended reach wells are becoming
increasingly deeper, the drilling fluid would also need to be rugged and versatile to handle
unforgiving environments like elevated temperatures and high fluid densities. A newly
developed clay-free polymer fluid with a liquid lubricant was designed to resist harsh
environments and still perform equivalently to or outperform conventional NAFs.3
This high-
performance water-based mud enhanced with the liquid lubricant was designed to provide
greater than normal film strength and resist excessive emulsification. Since its introduction, this
high-performance WBM has been used on over a thousand wells.
Onsite measurements of CoF of the high-
performance water-based drilling fluid were
made with the OFITE 212 EP (Extreme
Pressure) and Lubricity Tester (see Fig. 1).
These were conducted in Lubricity Test mode
by measuring the amount of force required to
continuously rotate a hardened steel ring in
contact with a hardened steel block while
immersed in the high-performance WBM.
Establishing Measurement Criteria
A comprehensive assessment of 50 wells
drilled with the high-performance water-based
fluid was randomly chosen from a data set of
over 100 wells. A program to obtain data from
casing runs for analysis was established in
2011. This data is used with industry-accepted software4
to analyze the casing runs to
determine an equivalent wellbore friction factor. The information obtained includes CoF and
friction factor, which provides a basis for establishing system performance and future fluid
property goals. These wells encompass regions in the United States where the high-
performance fluid has been used. Every well is unique in that there is variability in lateral
lengths, build angles, formations, drilling fluid, etc. As expected these inputs affect the wellbore
friction as evidenced by the hook loads when running casing. Under ideal circumstances, the
friction factor should be independent of the depth, well path, casing size/weight and formation.
Figure 1. OFITE 112 EP & Lubricity Tester
4	
	
In most analyses, two friction factors are utilized, one for the cased portion of the hole and one
for the open hole section. This analysis used a single friction factor for both casing and open
hole. This is an acceptable simplification because the bulk of the frictional forces in horizontal
wells are found in the build and lateral sections, which are open hole. Table 1 gives typical
values used for friction factor for various types of drilling fluids. The values given for the “high-
performance water-based” system analyzed for this work of 0.10 – 0.30 will be discussed at
length later. Typical values of CoF for steel on steel are also given in Table 1.
Table 1. Typical Friction Factors and CoFs Used in Modeling Torque and Drag
Drilling Fluid
Open Hole Friction
Factor4
Steel on Steel Coefficient
of Friction (CoF)
Air 0.40 – 0.60 --
Foam Water-Based 0.35 – 0.55 --
Lignosulfonate Water-Based 0.20 – 0.30 0.20 – 0.28
Polymer Water-Based 0.20 – 0.30 0.20 – 0.28
Oil-Based 0.15 – 0.20 0.07 – 0.13
High-Performance Water-Based 0.10 – 0.30 0.04 – 0.10
The protocol followed for the lubricity tests included rotation of the test ring at 60 rpm and
application of 150 in-lb torque to the block, which generated 720 psi between the two steel
surfaces. The surfaces are a hardened steel block and a hardened rotating steel Timken ring.
Though the use of a steel block does not exactly represent the wellbore, it reduces variability
and increases reproducibility of the measurements. Though the CoF observed for steel on rock
is expected to be higher than for steel on steel, the trends are expected to be similar. T.C.
Mondshine found in his experimental lubricity tests that many lubricants which performed well in
lab-built fluids did not perform as well in the field.5
Once contaminants and mud additives
(solids, crude, emulsifiers, thinners, etc.) were incorporated into the drilling fluid, these
lubricants were rendered less effective. The high-performance drilling fluid used in the wells of
this study is unique in that the mud lubricity is maintained fairly well throughout the drilling
process. This was proven by recording similar values of the mud CoF over extended periods of
time using the EP and Lubricity Tester. Nevertheless, as will be shown below, solid additives
like lost circulation materials (LCM) can still affect the friction factor without showing a similar
effect on the CoF, a phenomenon that we believe is an artifact of the EP and Lubricity Tester.
In the field applications used for this study, CoF was measured as part of every mud check
throughout the interval where the high-performance drilling fluid was being used. The CoF
values reported in Tables 2, 3, and 5 are averages over the high-performance mud interval.
The CoFs measured during the casing runs are also reported.
The friction factor is calculated from the force required to move the pipe up and down within the
wellbore. When running casing, this is done during the collection of the pick-up and slack-off
loads. Along with these data, casing size, type, weight, standoff devices, and the surveys for the
well path are used to model the casing run. This information is entered into the computer
modeling software to obtain a friction factor that generates curves that model closely the actual
pick-up and slack-off load data. The output of the software is a graph relating the axial loads
5	
	
required to move the string (see Figs. 5-7). Slack-off values are considered to be most reliable
for obtaining friction factors due to the fact that many times the casing is not fully picked up
when running casing and may only be picked up enough to release the casing slips.
Friction Factor and Lubricity Data Analysis
The aim of this statistical analysis was to determine the significance of mud lubricity and the
impact it has on the friction factor in the wellbore while running casing. In Table 2 and Fig. 2
below, it is seen that, on average, the resulting friction factor with the high-performance fluid
was 0.21.
Table 2. Friction Factor and CoFs for Fifty-Well Data Set
Friction Factor Average CoF
CoF while Running
Casing
Average 0.21 0.11 0.09
N 50 50 50
Standard Deviation 0.07 0.03 0.03
Mode 0.30 0.10 0.10
Median 0.20 0.11 0.09
Minimum 0.10 0.05 0.04
Maximum 0.30 0.19 0.19
0.2000.1750.1500.1250.1000.0750.050
0.30
0.25
0.20
0.15
0.10
Co F w hile Running Ca s ing.
FrictionFactor
F riction F actor v s C oF w hile R unning C as ing
	
Figure 2. Friction Factor vs. CoF in the Open Hole (Wells with and without LCM). Note
that some of the symbols represent two data points.
When a scatter plot of the data is examined, there does not appear to be a strong correlation of
CoF with friction factor. This is confirmed with statistical analysis of the 50-well data. Even
though on average the friction factor is nearly the same as is typical for NAFs (see Table 1), the
spread between 0.10 and 0.30 suggests caution is needed if one were to design wells on the
6	
	
basis of the average friction factor. Another way of describing this situation would be that if a
design factor of 0.20 had been used, on 38% of the wells the friction factor would exceed the
design factor. If achieving a 0.20 friction factor or less on the casing run were critical to success
of the well, this would not be acceptable. It should be noted that for all the wells in the data set,
casing was run successfully to bottom, so the higher friction factors experienced were not
detrimental to well performance.
Discussions with field personnel suggested that at least some of the variability might be
associated with lost circulation material (LCM), which was carried in half of the wells.
Consequently, the wells drilled without LCM were re-analyzed in the same manner. The results
are shown in Table 3 and Fig. 3. The average friction factor for these wells is 25% less than the
data for all 50 wells, and the standard deviation for the friction factor is almost half of the value
of that for the 50-well data set.
Table 3. Friction Factor and CoFs for Wells without LCM
Friction Factor Average Lubricity While running casing
Average 0.15 0.10 0.08
N 25 25 25
Stand Deviation 0.04 0.04 0.03
Mode 0.20 0.09 0.08
Median 0.15 0.11 0.08
Minimum 0.10 0.05 0.040
Maximum 0.22 0.18 0.16
0.2000.1750.1500.1250.1000.0750.050
0.30
0.25
0.20
0.15
0.10
Co F w hile Running Ca s ing
FrictionFactor
0.100
F riction F actor v s C oF w hile R unning C as ing
Figure 3. Friction Factor vs. CoF in the Open Hole (Wells without LCM). Note that some
of the symbols represent two data points.
Removing wells in which LCM was used drastically reduces variability in the friction factor. It
also suggests that setting a specification for CoF while running casing in the absence of LCM is
possible. If the CoF were specified to be 0.10 or less, the friction factor without LCM would be
7	
	
0.20 or less most of the time. Indeed, 96% of the wells drilled without LCM would meet these
criteria. It is interesting to note that the specification of 0.10 or less had informally evolved as a
design criterion for many of the wells drilled with the high-performance fluid. The data described
here support that experience-derived “rule of thumb.”
Table 4 below lists some of the main variables of the wells in the data set. Not only did the base
drilling fluid vary, but also mud density, concentration of lubricant (drilling performance
enhancer, or DPE), well depth and lateral length. The high-performance WBM also used various
types of shale inhibitors.
Table 4. General Well Information for Fifty-Well Data Set
Mud Description High-performance WBM with drilling performance enhancer
(DPE) ranging from 1.5 to 4 vol %, with inhibition as required
Field brine with DPE ranging up to 4 vol %
Shale Inhibitor in
high-performance
WBM
Sodium chloride
Potassium silicate
Potassium carbonate
Amine compounds
Asphaltic materials
Note: Selection and concentration depend on the application
requirements
Mud Density 8.5 to 16.3 ppg (1.02 to 1.96 SG)
True Vertical Depth 6,500 to 14,500 ft (1,980 to 4,420 m)
Measured Depth 10,500 ft to 20,300 ft (3,200 to 6,200 m)
Lateral Length 3,500 to 9,600 ft (1,070 to 2,930 m)
Table 5 shows the friction factor, CoF, dog leg severity, tortuosity, and lost circulation material
concentration used for the 50-well data set. The data are conditionally formatted with the
smaller more desirable values in green graduated to the higher, less desirable values in red.
There does not seem to be any relationship between friction factor and the survey-derived data.
This indicates that the friction factor as determined from the modeling software is independent
of the wellbore path and its variability. Correlation analysis of the survey data and friction factor
confirms this.
8	
	
Table 5. Fifty Well Dataset, Conditionally Formatted
Friction
Factor
CoF
while
running
casing Well
Average
CoF
Max
Dogleg
Severity
°/100ft
Average
Dogleg
Severity
in build
°/100ft
Difference
of Max to
average
Dogleg
severity
Average
absolute
Tortuosity
°/100ft
LCM
while
running
casing
lb/bbl Field
0.200 0.040 1 0.053 19.74 9.65 10.10 0.73 0.00 Region 1
0.100 0.050 2 0.050 10.09 7.30 2.79 0.83 0.00 Region 1
0.100 0.040 3 0.052 17.98 10.06 7.92 0.80 0.00 Region 1
0.100 0.040 4 0.065 19.74 8.37 11.37 0.75 0.00 Region 1
0.300 0.110 5 0.108 13.78 7.78 6.00 1.13 3.00 Region 2
0.150 0.050 6 0.159 10.04 6.85 3.19 0.82 5.00 Region 2
0.150 0.080 7 0.179 10.93 6.94 3.99 1.13 0.00 Region 2
0.100 0.100 8 0.156 11.55 7.26 4.29 1.14 5.00 Region 2
0.300 0.080 9 0.099 12.80 8.62 4.18 1.23 2.00 Region 2
0.150 0.100 10 0.158 12.26 8.30 3.96 1.11 7.00 Region 2
0.100 0.090 11 0.133 10.93 8.63 2.30 0.89 4.00 Region 2
0.200 0.070 12 0.143 11.31 7.70 3.61 1.01 0.00 Region 2
0.300 0.070 13 0.104 11.20 6.77 4.43 1.09 4.00 Region 2
0.200 0.070 14 0.156 11.57 7.27 4.30 0.94 0.00 Region 2
0.300 0.123 15 0.174 11.06 7.09 3.97 1.31 7.00 Region 2
0.200 0.130 16 0.125 10.73 7.95 2.78 1.23 6.00 Region 2
0.150 0.080 17 0.120 11.03 7.49 3.54 1.29 0.00 Region 2
0.100 0.070 18 0.089 14.21 8.49 5.72 0.87 0.00 Region 2
0.120 0.080 19 0.109 13.47 9.43 4.04 1.56 0.00 Region 2
0.220 0.090 20 0.089 15.97 9.83 6.14 1.30 0.00 Region 2
0.240 0.100 21 0.107 12.74 6.84 5.90 1.26 0.00 Region 2
0.300 0.100 22 0.109 24.32 7.86 16.46 1.00 4.00 Region 2
0.200 0.090 23 0.093 11.22 7.49 3.73 1.19 0.50 Region 2
0.170 0.090 24 0.100 19.29 8.61 10.68 0.93 4.00 Region 2
0.300 0.090 25 0.090 11.95 7.56 4.39 1.03 2.00 Region 2
0.300 0.090 26 0.109 12.07 7.19 4.88 1.39 1.00 Region 2
0.300 0.120 27 0.134 14.55 6.65 7.90 1.31 8.00 Region 2
0.160 0.140 28 0.128 12.38 7.82 4.56 1.05 0.00 Region 2
0.300 0.090 29 0.101 13.40 7.46 5.94 1.06 1.00 Region 2
0.200 0.080 30 0.107 11.60 8.35 3.25 1.11 0.00 Region 2
0.100 0.080 31 0.116 13.81 8.63 5.18 1.31 0.00 Region 2
0.300 0.090 32 0.098 10.63 7.12 3.51 0.89 7.00 Region 2
0.190 0.100 33 0.100 12.97 7.23 5.74 1.50 1.50 Region 2
0.120 0.080 34 0.118 14.06 7.41 6.65 1.14 1.00 Region 2
0.200 0.070 35 0.068 10.47 8.43 2.04 0.95 0.00 Region 2
0.220 0.110 36 0.151 10.32 7.23 3.09 1.05 3.00 Region 2
0.300 0.160 37 0.171 13.61 7.15 6.46 1.20 5.00 Region 2
0.250 0.190 38 0.191 13.06 7.20 5.86 1.40 8.00 Region 2
0.300 0.097 39 0.127 12.01 7.00 5.01 1.19 6.00 Region 2
0.300 0.070 40 0.135 10.72 7.44 3.28 0.94 2.00 Region 2
0.300 0.090 41 0.108 11.89 6.98 4.91 1.17 4.00 Region 2
0.300 0.140 42 0.111 12.00 7.23 4.77 1.25 6.00 Region 2
0.200 0.080 43 0.106 15.07 10.70 4.37 0.98 0.00 Region 3
0.200 0.060 44 0.057 17.82 8.99 8.83 1.05 0.00 Region 3
0.150 0.090 45 0.107 18.75 10.48 8.27 1.03 0.00 Region 4
0.100 0.060 46 0.070 14.63 7.92 6.71 0.65 0.00 Region 5
0.200 0.040 47 0.047 15.76 9.93 5.83 0.92 0.00 Region 6
0.200 0.040 48 0.096 12.81 7.42 5.39 1.10 0.00 Region 6
0.200 0.090 49 0.089 14.21 10.89 3.32 1.17 0.00 Region 7
0.150 0.160 50 0.137 13.36 9.52 3.84 1.15 0.00 Region 7
9	
	
Reducing Variability When Using LCM
The variability associated with the use of LCM does suggest that if well designs change,
particularly to longer laterals, steps should be taken to reduce the variability of the friction factor.
Possible actions could include evaluation of LCM concentration effect on friction factor, removal
of the LCM prior to running casing, and alternative LCM materials. An alternative is to use a
different lubricity tester. It is well known that the action involved in measuring CoF with the EP
and Lubricity Tester sweeps solids away from the contact surfaces. Consequently, the effects
of solids larger than a few microns in size are not observed. Other lubricity test devices are
available which retain the solids in the space between the contact surfaces. These have been
shown to be useful for measuring effects of solid lubricants on CoF.6
While the high-performance fluid with LCM continues to be used successfully in this area and is
resulting in reduced well costs, efforts to identify sources of variability are needed in anticipation
of future changes to well design. Closely working with field personnel, including fluid service
technicians, drilling fluid engineering supervisors and operator’s representatives, can help to
improve performance, of course. With this technical support, sources of variability can be
identified and uncertainties can be reduced. A robust program of monitoring performance,
determining and communicating lessons learned, and training in analysis techniques has been
implemented to continue to improve performance through evolution of the fluid technology.
Improving Performance While Drilling
Reducing the axial drag and the rotational torque from contact due to the weight of the pipe
against the wellbore will enable drilling longer horizontal laterals. Since the longer horizontals
expose more formation, there is a tendency to maximize lateral length. If the torque limit on the
drill string is approached, then drilling cannot proceed without greatly increasing the risk of
drillstring failure. Modeling these forces is important to prevent problems and to predict the
results of all operations associated with the wellbore.7
Relating results from a field instrument
can help with evaluation of fluid-treating strategies, such as treatment with an appropriate
lubricant like the drilling performance enhancer (DPE) designed for the high-performance water-
based drilling fluid.
The impact that the DPE has on the friction factor can be discerned by analyzing the on bottom
and off bottom torque. In the example shown in Fig. 4, the lateral of a well in Area 1 that was
being drilled with produced brine began experiencing increasing torque. By the time drilling had
progressed to 13,600 ft (4,150 m), the rate of torque increase was such that it was obvious that
the torque limit of the drill string would be exceeded before reaching planned total depth. The
base CoF of the brine was 0.12. DPE was added at that time in 1 vol % increments. With the
initial addition of DPE, the CoF was reduced to 0.04, but shortly thereafter began increasing and
reached 0.05 by the time the next addition was made. These periodic treatments proceeded
until the nominal DPE concentration (assuming no depletion) reached 4 vol%. At this time, the
torque remained at a sustained low level until reaching a total measured depth of over 20,000 ft
(6,100 m). The torque limit on the drill string was not reached. Use of produced brine to
replace NAFs as drilling fluids has been successful in this application at least in part because of
the lubricant DFE.
10	
	
Figure 4. Sustained Torque Reduction While Drilling
Example Casing Runs
After drilling the well discussed in the previous section, a complete analysis of the casing run
was carried out by recording the hook load after every 20 joints of casing. The hook load was
then compared to a computer generated hook load with a 0.20 friction factor. Fig. 5 below is an
example graphical representation of the data collected during the casing run. The “Actual
Tripping Out” values are much lower than expected because the string was not picked up
completely while running casing. The string was only picked up sufficiently to pull off of the
slips. Correlation of the friction factor to the pickup weight is not possible since full pickup loads
were not recorded and may not have occurred.
11	
	
Hook Load (kip)
60 80 100 120 140 160 180 200
RunMeasuredDepth(ft) 0
5000
10000
15000
20000
L E G E N D
Rotate Off Bottom
Rotate On Bottom
Tripping Out
Tripping In
Actual Tripping In
Actual Tripping Out
Figure 5. Region 1 Casing Run with a 0.20 Friction Factor
On wells using the high-performance fluid, a standard data collection process resulted in the
data required for analysis of the casing run. Figs. 6 and 7 give results for two wells in Region 2.
These show the typical results of the casing run analysis for a friction factor of 0.20 and 0.15.
Other friction factors – both lower and higher – were also examined, but these two values
appeared to show the closest matches between the Tripping In fitted curve and the Actual
Tripping In data. Close examination of Figs. 6 and 7 shows that a friction factor of 0.15 is
probably a better match of the fitted curve to the data than a friction factor of 0.20.
Hook Load (kip)
40 60 80 100 120 140 160 180 200
RunMeasuredDepth(ft)
0
2000
4000
6000
8000
10000
12000
L E G E N D
Rotate Off Bottom
Rotate On Bottom
Tripping Out
Tripping In
Actual Tripping In
Actual Tripping Out
Figure 6. Region 2 Casing Run with a 0.20 Friction Factor
12	
	
Hook Load (kip)
40 60 80 100 120 140 160 180
RunMeasuredDepth(ft)
0
2000
4000
6000
8000
10000
12000
L E G E N D
Rotate Off Bottom
Rotate On Bottom
Tripping Out
Tripping In
Actual Tripping In
Actual Tripping Out
Figure 7. Region 2 Casing Run with a 0.15 Friction Factor
Conclusions
Wellbore friction is an important consideration in horizontal well design. Focusing on the casing
running operations and evaluating their results provides a useful indicator of overall well
success. Analyzing the results of a large number of successful wells, in this case 50, provided
insight into the performance and confidence in predicting future results. Use of the high-
performance water-based fluid developed for horizontal drilling resulted in performance on par
with oil-based mud and other NAFs at considerable well cost savings.
The analysis of data from the 50 casing runs resulted in the following insights:
 Wells drilled with a novel high-performance drilling fluid showed some significant
variability in friction factor, apparently a function of lost circulation material, although the
average friction factor of 0.21 was similar to that of NAFs
 Analysis of the data from the 25 wells in which LCM was not used gave an average
friction factor of 0.15, with 96% of the wells showing less than 0.20
 Studying the variability in torque and drag associated with casing runs can be useful to
find ways to improve performance
The newly developed Drilling Performance Enhancer, DPE, can provide
 Sustained torque reduction while drilling
 Successful drilling of horizontal wells that normally require NAFs
13	
	
Acknowledgments
The authors would like to acknowledge Newpark’s Evolution® certified fluid technicians
for their dedicated data collection that made this paper possible.
References
																																																								
1
	http://en.wikipedia.org/wiki/Friction	
2
	F.B. Growcock, T.P. Frederick, A.R. Reece, Amoco Corp; G.W. Green, University of
Oklahoma; and M.D. Ruffin, University of Tulsa: “Novel Lubricants for Water-Based Drilling
Fluids”, SPE International Symposium on Oilfield Chemistry, February 16-19, 1999, Houston,
Texas.	
3
D. Breeden, C. Dougan, D. Shank and S. Summers, Newpark Drilling Fluids, LLC:
“Haynesville Performance Review: Unique Clay Free Polymer Drilling Fluid System” AADE-11-
NTCE-39, 2011 AADE National Technical Conference, Houston, Texas, April 12-14, 2011.	
4
	Landmark WELLPLAN™ Torque/Drag Analysis software.	
5
	T.C. Mondshine: “Drilling-mud lubricity: Guide to reduced torque and drag,” The Oil and Gas
Journal, December 7, 1970, pp 70-73.
6
A. Vankadari, S. Miska, N. Takach, E. Ozbayoglu, R. Majidi, University of Tulsa, F. Growcock,
M-I SWACO and C. Stouffer, Drilling Specialties Co.: “Experimental Study of Torque-Reducing
Additives for Extended Reach Drilling,” AADE-11-NTCE-14, 2011 AADE National Technical
Conference and Exhibition, Houston, Texas, April 12-14, 2011.
7
M. S. Aston, P. J. Hearn and G. McGhee: “Techniques for Solving Torque and Drag Problems
in Today's Drilling Environment,” SPE 48939, 1998 SPE Annual Technical Conference and
Exhibition, New Orleans, September 27-30, 1998.

Contenu connexe

Tendances

Rheology of Fluids Hydraulic Calculations & Drilling Fluid (Mud) Filtration T...
Rheology of Fluids Hydraulic Calculations & Drilling Fluid (Mud) Filtration T...Rheology of Fluids Hydraulic Calculations & Drilling Fluid (Mud) Filtration T...
Rheology of Fluids Hydraulic Calculations & Drilling Fluid (Mud) Filtration T...Shaoor Kamal
 
Drilling fluids
Drilling fluidsDrilling fluids
Drilling fluidsWajid09
 
Determination of Effect Bentonite and Additives On Drilling Fluids
Determination of Effect Bentonite and Additives On Drilling FluidsDetermination of Effect Bentonite and Additives On Drilling Fluids
Determination of Effect Bentonite and Additives On Drilling FluidsIRJESJOURNAL
 
drilling fluids and its rheology
drilling fluids and its rheology drilling fluids and its rheology
drilling fluids and its rheology SHIKHA THAPA
 
Estimation of skin factor by using pressure transient
Estimation of skin factor by using pressure transientEstimation of skin factor by using pressure transient
Estimation of skin factor by using pressure transientMuhamad Kurdy
 
Hydraulic fracturing
Hydraulic fracturingHydraulic fracturing
Hydraulic fracturingAnkit Sharma
 
Oilfield Chemical ppt one-to-use v2
Oilfield Chemical ppt one-to-use v2Oilfield Chemical ppt one-to-use v2
Oilfield Chemical ppt one-to-use v2David A. Berg
 
introduction to slim hole drilling
introduction to slim hole drillingintroduction to slim hole drilling
introduction to slim hole drillingMubarik Rao
 
Bakri Final Presentation 2
Bakri Final Presentation  2Bakri Final Presentation  2
Bakri Final Presentation 2ahmadbakri991
 
LOST CIRCULATION - THE BASICS
LOST CIRCULATION - THE BASICSLOST CIRCULATION - THE BASICS
LOST CIRCULATION - THE BASICSMohan Doshi
 
Spe 107739-ms-p
Spe 107739-ms-pSpe 107739-ms-p
Spe 107739-ms-pmsmsoft
 
LOSSES CIRCULATION
LOSSES CIRCULATIONLOSSES CIRCULATION
LOSSES CIRCULATIONfalah hassan
 
DRILLING FLUIDS FOR THE HPHT ENVIRONMENT
DRILLING FLUIDS FOR THE HPHT ENVIRONMENTDRILLING FLUIDS FOR THE HPHT ENVIRONMENT
DRILLING FLUIDS FOR THE HPHT ENVIRONMENTMohan Doshi
 
Summer training project on drilling fluid at ongc ppt
Summer training project on drilling fluid at ongc pptSummer training project on drilling fluid at ongc ppt
Summer training project on drilling fluid at ongc pptKeshar Saini
 
Ultra-High-Pressure-Risers-for-Deepwater-Drilling-(DOT-Intl-09)
Ultra-High-Pressure-Risers-for-Deepwater-Drilling-(DOT-Intl-09)Ultra-High-Pressure-Risers-for-Deepwater-Drilling-(DOT-Intl-09)
Ultra-High-Pressure-Risers-for-Deepwater-Drilling-(DOT-Intl-09)Paul Brett
 

Tendances (19)

Rheology of Fluids Hydraulic Calculations & Drilling Fluid (Mud) Filtration T...
Rheology of Fluids Hydraulic Calculations & Drilling Fluid (Mud) Filtration T...Rheology of Fluids Hydraulic Calculations & Drilling Fluid (Mud) Filtration T...
Rheology of Fluids Hydraulic Calculations & Drilling Fluid (Mud) Filtration T...
 
spe fluid
spe fluidspe fluid
spe fluid
 
Drilling fluids
Drilling fluidsDrilling fluids
Drilling fluids
 
Determination of Effect Bentonite and Additives On Drilling Fluids
Determination of Effect Bentonite and Additives On Drilling FluidsDetermination of Effect Bentonite and Additives On Drilling Fluids
Determination of Effect Bentonite and Additives On Drilling Fluids
 
Drilling fluids
Drilling fluidsDrilling fluids
Drilling fluids
 
drilling fluids and its rheology
drilling fluids and its rheology drilling fluids and its rheology
drilling fluids and its rheology
 
Casing design
Casing designCasing design
Casing design
 
Estimation of skin factor by using pressure transient
Estimation of skin factor by using pressure transientEstimation of skin factor by using pressure transient
Estimation of skin factor by using pressure transient
 
Hydraulic fracturing
Hydraulic fracturingHydraulic fracturing
Hydraulic fracturing
 
Oilfield Chemical ppt one-to-use v2
Oilfield Chemical ppt one-to-use v2Oilfield Chemical ppt one-to-use v2
Oilfield Chemical ppt one-to-use v2
 
introduction to slim hole drilling
introduction to slim hole drillingintroduction to slim hole drilling
introduction to slim hole drilling
 
Bakri Final Presentation 2
Bakri Final Presentation  2Bakri Final Presentation  2
Bakri Final Presentation 2
 
Casing design
Casing designCasing design
Casing design
 
LOST CIRCULATION - THE BASICS
LOST CIRCULATION - THE BASICSLOST CIRCULATION - THE BASICS
LOST CIRCULATION - THE BASICS
 
Spe 107739-ms-p
Spe 107739-ms-pSpe 107739-ms-p
Spe 107739-ms-p
 
LOSSES CIRCULATION
LOSSES CIRCULATIONLOSSES CIRCULATION
LOSSES CIRCULATION
 
DRILLING FLUIDS FOR THE HPHT ENVIRONMENT
DRILLING FLUIDS FOR THE HPHT ENVIRONMENTDRILLING FLUIDS FOR THE HPHT ENVIRONMENT
DRILLING FLUIDS FOR THE HPHT ENVIRONMENT
 
Summer training project on drilling fluid at ongc ppt
Summer training project on drilling fluid at ongc pptSummer training project on drilling fluid at ongc ppt
Summer training project on drilling fluid at ongc ppt
 
Ultra-High-Pressure-Risers-for-Deepwater-Drilling-(DOT-Intl-09)
Ultra-High-Pressure-Risers-for-Deepwater-Drilling-(DOT-Intl-09)Ultra-High-Pressure-Risers-for-Deepwater-Drilling-(DOT-Intl-09)
Ultra-High-Pressure-Risers-for-Deepwater-Drilling-(DOT-Intl-09)
 

Similaire à Field Lubricity Measurements Correlate with Improved Performance of Novel Water-Based Drilling Fluid

True Power Law Drilling Fluid Model: Effect of Its Rheological Parameters on ...
True Power Law Drilling Fluid Model: Effect of Its Rheological Parameters on ...True Power Law Drilling Fluid Model: Effect of Its Rheological Parameters on ...
True Power Law Drilling Fluid Model: Effect of Its Rheological Parameters on ...IRJET Journal
 
Drilling Fluid Engineering-Viscosity & Yeild Point.pdf
Drilling Fluid Engineering-Viscosity & Yeild Point.pdfDrilling Fluid Engineering-Viscosity & Yeild Point.pdf
Drilling Fluid Engineering-Viscosity & Yeild Point.pdfSARWAR SALAM
 
REAL-TIME INTELLIGENT FRACTURING: OPTIMIZING FRACTURE SURFACE AREA
REAL-TIME INTELLIGENT FRACTURING: OPTIMIZING FRACTURE SURFACE AREAREAL-TIME INTELLIGENT FRACTURING: OPTIMIZING FRACTURE SURFACE AREA
REAL-TIME INTELLIGENT FRACTURING: OPTIMIZING FRACTURE SURFACE AREAiQHub
 
IRJET- Effect of Roughness of Rectangular Combined Footing based on Ultimate ...
IRJET- Effect of Roughness of Rectangular Combined Footing based on Ultimate ...IRJET- Effect of Roughness of Rectangular Combined Footing based on Ultimate ...
IRJET- Effect of Roughness of Rectangular Combined Footing based on Ultimate ...IRJET Journal
 
Field Failure Analysis of DTH Hammer Bit
Field Failure Analysis of DTH Hammer BitField Failure Analysis of DTH Hammer Bit
Field Failure Analysis of DTH Hammer BitIRJET Journal
 
Horizontal_Well_IPR_Estimations
Horizontal_Well_IPR_EstimationsHorizontal_Well_IPR_Estimations
Horizontal_Well_IPR_EstimationsKrishna Kumar
 
Evaluating sieve tray flooding in a distillation
Evaluating sieve tray flooding in a distillationEvaluating sieve tray flooding in a distillation
Evaluating sieve tray flooding in a distillationAlexander Decker
 
Influence of Local Effects on Hold Period Fatigue Assessments for Reel-Lay
Influence of Local Effects on Hold Period Fatigue Assessments for Reel-LayInfluence of Local Effects on Hold Period Fatigue Assessments for Reel-Lay
Influence of Local Effects on Hold Period Fatigue Assessments for Reel-LayPaul Brett
 
drillingfluids-150902095822-lva1-app6891.pdf
drillingfluids-150902095822-lva1-app6891.pdfdrillingfluids-150902095822-lva1-app6891.pdf
drillingfluids-150902095822-lva1-app6891.pdfMuammerAlakary
 
IRJET- Parameters Affecting the Clogging of Recharge Wells in Different Soil ...
IRJET- Parameters Affecting the Clogging of Recharge Wells in Different Soil ...IRJET- Parameters Affecting the Clogging of Recharge Wells in Different Soil ...
IRJET- Parameters Affecting the Clogging of Recharge Wells in Different Soil ...IRJET Journal
 
IMWA2013_Swanson_511
IMWA2013_Swanson_511IMWA2013_Swanson_511
IMWA2013_Swanson_511Eric Swanson
 
Day 1 SS in WE.pptx
Day 1 SS in WE.pptxDay 1 SS in WE.pptx
Day 1 SS in WE.pptxssuser759598
 
Literature Survey on Self-Compacting Concrete
Literature Survey on Self-Compacting ConcreteLiterature Survey on Self-Compacting Concrete
Literature Survey on Self-Compacting ConcreteIRJET Journal
 
Plasma Pulse Technology in eor.pptx
Plasma Pulse Technology in eor.pptxPlasma Pulse Technology in eor.pptx
Plasma Pulse Technology in eor.pptxCRAZYFIGHTERlol
 
Lab 4 measurement of plastic viscosity of different mud samples by viscometer.
Lab 4 measurement of plastic viscosity of different mud samples by viscometer.Lab 4 measurement of plastic viscosity of different mud samples by viscometer.
Lab 4 measurement of plastic viscosity of different mud samples by viscometer.Awais Qureshi
 
Lyapichev: Analysis, design & behavior of CFRDs
Lyapichev: Analysis, design & behavior of CFRDsLyapichev: Analysis, design & behavior of CFRDs
Lyapichev: Analysis, design & behavior of CFRDsYury Lyapichev
 
Lyapichev. Analysis, design & behavior of CFRDs
Lyapichev. Analysis, design & behavior of CFRDsLyapichev. Analysis, design & behavior of CFRDs
Lyapichev. Analysis, design & behavior of CFRDsYury Lyapichev
 

Similaire à Field Lubricity Measurements Correlate with Improved Performance of Novel Water-Based Drilling Fluid (20)

SPE_97314HPWBM
SPE_97314HPWBMSPE_97314HPWBM
SPE_97314HPWBM
 
True Power Law Drilling Fluid Model: Effect of Its Rheological Parameters on ...
True Power Law Drilling Fluid Model: Effect of Its Rheological Parameters on ...True Power Law Drilling Fluid Model: Effect of Its Rheological Parameters on ...
True Power Law Drilling Fluid Model: Effect of Its Rheological Parameters on ...
 
Drilling Fluid Engineering-Viscosity & Yeild Point.pdf
Drilling Fluid Engineering-Viscosity & Yeild Point.pdfDrilling Fluid Engineering-Viscosity & Yeild Point.pdf
Drilling Fluid Engineering-Viscosity & Yeild Point.pdf
 
REAL-TIME INTELLIGENT FRACTURING: OPTIMIZING FRACTURE SURFACE AREA
REAL-TIME INTELLIGENT FRACTURING: OPTIMIZING FRACTURE SURFACE AREAREAL-TIME INTELLIGENT FRACTURING: OPTIMIZING FRACTURE SURFACE AREA
REAL-TIME INTELLIGENT FRACTURING: OPTIMIZING FRACTURE SURFACE AREA
 
IRJET- Effect of Roughness of Rectangular Combined Footing based on Ultimate ...
IRJET- Effect of Roughness of Rectangular Combined Footing based on Ultimate ...IRJET- Effect of Roughness of Rectangular Combined Footing based on Ultimate ...
IRJET- Effect of Roughness of Rectangular Combined Footing based on Ultimate ...
 
Field Failure Analysis of DTH Hammer Bit
Field Failure Analysis of DTH Hammer BitField Failure Analysis of DTH Hammer Bit
Field Failure Analysis of DTH Hammer Bit
 
Horizontal_Well_IPR_Estimations
Horizontal_Well_IPR_EstimationsHorizontal_Well_IPR_Estimations
Horizontal_Well_IPR_Estimations
 
Evaluating sieve tray flooding in a distillation
Evaluating sieve tray flooding in a distillationEvaluating sieve tray flooding in a distillation
Evaluating sieve tray flooding in a distillation
 
Influence of Local Effects on Hold Period Fatigue Assessments for Reel-Lay
Influence of Local Effects on Hold Period Fatigue Assessments for Reel-LayInfluence of Local Effects on Hold Period Fatigue Assessments for Reel-Lay
Influence of Local Effects on Hold Period Fatigue Assessments for Reel-Lay
 
drillingfluids-150902095822-lva1-app6891.pdf
drillingfluids-150902095822-lva1-app6891.pdfdrillingfluids-150902095822-lva1-app6891.pdf
drillingfluids-150902095822-lva1-app6891.pdf
 
IRJET- Parameters Affecting the Clogging of Recharge Wells in Different Soil ...
IRJET- Parameters Affecting the Clogging of Recharge Wells in Different Soil ...IRJET- Parameters Affecting the Clogging of Recharge Wells in Different Soil ...
IRJET- Parameters Affecting the Clogging of Recharge Wells in Different Soil ...
 
IMWA2013_Swanson_511
IMWA2013_Swanson_511IMWA2013_Swanson_511
IMWA2013_Swanson_511
 
A05810107
A05810107A05810107
A05810107
 
drillingfluids-.pptx
drillingfluids-.pptxdrillingfluids-.pptx
drillingfluids-.pptx
 
Day 1 SS in WE.pptx
Day 1 SS in WE.pptxDay 1 SS in WE.pptx
Day 1 SS in WE.pptx
 
Literature Survey on Self-Compacting Concrete
Literature Survey on Self-Compacting ConcreteLiterature Survey on Self-Compacting Concrete
Literature Survey on Self-Compacting Concrete
 
Plasma Pulse Technology in eor.pptx
Plasma Pulse Technology in eor.pptxPlasma Pulse Technology in eor.pptx
Plasma Pulse Technology in eor.pptx
 
Lab 4 measurement of plastic viscosity of different mud samples by viscometer.
Lab 4 measurement of plastic viscosity of different mud samples by viscometer.Lab 4 measurement of plastic viscosity of different mud samples by viscometer.
Lab 4 measurement of plastic viscosity of different mud samples by viscometer.
 
Lyapichev: Analysis, design & behavior of CFRDs
Lyapichev: Analysis, design & behavior of CFRDsLyapichev: Analysis, design & behavior of CFRDs
Lyapichev: Analysis, design & behavior of CFRDs
 
Lyapichev. Analysis, design & behavior of CFRDs
Lyapichev. Analysis, design & behavior of CFRDsLyapichev. Analysis, design & behavior of CFRDs
Lyapichev. Analysis, design & behavior of CFRDs
 

Dernier

Cybersecurity Awareness Training Presentation v2024.03
Cybersecurity Awareness Training Presentation v2024.03Cybersecurity Awareness Training Presentation v2024.03
Cybersecurity Awareness Training Presentation v2024.03DallasHaselhorst
 
Chapter 9 PPT 4th edition.pdf internal audit
Chapter 9 PPT 4th edition.pdf internal auditChapter 9 PPT 4th edition.pdf internal audit
Chapter 9 PPT 4th edition.pdf internal auditNhtLNguyn9
 
8447779800, Low rate Call girls in Rohini Delhi NCR
8447779800, Low rate Call girls in Rohini Delhi NCR8447779800, Low rate Call girls in Rohini Delhi NCR
8447779800, Low rate Call girls in Rohini Delhi NCRashishs7044
 
Market Sizes Sample Report - 2024 Edition
Market Sizes Sample Report - 2024 EditionMarket Sizes Sample Report - 2024 Edition
Market Sizes Sample Report - 2024 EditionMintel Group
 
Memorándum de Entendimiento (MoU) entre Codelco y SQM
Memorándum de Entendimiento (MoU) entre Codelco y SQMMemorándum de Entendimiento (MoU) entre Codelco y SQM
Memorándum de Entendimiento (MoU) entre Codelco y SQMVoces Mineras
 
Traction part 2 - EOS Model JAX Bridges.
Traction part 2 - EOS Model JAX Bridges.Traction part 2 - EOS Model JAX Bridges.
Traction part 2 - EOS Model JAX Bridges.Anamaria Contreras
 
Kenya’s Coconut Value Chain by Gatsby Africa
Kenya’s Coconut Value Chain by Gatsby AfricaKenya’s Coconut Value Chain by Gatsby Africa
Kenya’s Coconut Value Chain by Gatsby Africaictsugar
 
8447779800, Low rate Call girls in Tughlakabad Delhi NCR
8447779800, Low rate Call girls in Tughlakabad Delhi NCR8447779800, Low rate Call girls in Tughlakabad Delhi NCR
8447779800, Low rate Call girls in Tughlakabad Delhi NCRashishs7044
 
FULL ENJOY Call girls in Paharganj Delhi | 8377087607
FULL ENJOY Call girls in Paharganj Delhi | 8377087607FULL ENJOY Call girls in Paharganj Delhi | 8377087607
FULL ENJOY Call girls in Paharganj Delhi | 8377087607dollysharma2066
 
Marketplace and Quality Assurance Presentation - Vincent Chirchir
Marketplace and Quality Assurance Presentation - Vincent ChirchirMarketplace and Quality Assurance Presentation - Vincent Chirchir
Marketplace and Quality Assurance Presentation - Vincent Chirchirictsugar
 
(Best) ENJOY Call Girls in Faridabad Ex | 8377087607
(Best) ENJOY Call Girls in Faridabad Ex | 8377087607(Best) ENJOY Call Girls in Faridabad Ex | 8377087607
(Best) ENJOY Call Girls in Faridabad Ex | 8377087607dollysharma2066
 
Ten Organizational Design Models to align structure and operations to busines...
Ten Organizational Design Models to align structure and operations to busines...Ten Organizational Design Models to align structure and operations to busines...
Ten Organizational Design Models to align structure and operations to busines...Seta Wicaksana
 
APRIL2024_UKRAINE_xml_0000000000000 .pdf
APRIL2024_UKRAINE_xml_0000000000000 .pdfAPRIL2024_UKRAINE_xml_0000000000000 .pdf
APRIL2024_UKRAINE_xml_0000000000000 .pdfRbc Rbcua
 
Organizational Structure Running A Successful Business
Organizational Structure Running A Successful BusinessOrganizational Structure Running A Successful Business
Organizational Structure Running A Successful BusinessSeta Wicaksana
 
Innovation Conference 5th March 2024.pdf
Innovation Conference 5th March 2024.pdfInnovation Conference 5th March 2024.pdf
Innovation Conference 5th March 2024.pdfrichard876048
 
Unlocking the Future: Explore Web 3.0 Workshop to Start Earning Today!
Unlocking the Future: Explore Web 3.0 Workshop to Start Earning Today!Unlocking the Future: Explore Web 3.0 Workshop to Start Earning Today!
Unlocking the Future: Explore Web 3.0 Workshop to Start Earning Today!Doge Mining Website
 
Cyber Security Training in Office Environment
Cyber Security Training in Office EnvironmentCyber Security Training in Office Environment
Cyber Security Training in Office Environmentelijahj01012
 

Dernier (20)

Cybersecurity Awareness Training Presentation v2024.03
Cybersecurity Awareness Training Presentation v2024.03Cybersecurity Awareness Training Presentation v2024.03
Cybersecurity Awareness Training Presentation v2024.03
 
Chapter 9 PPT 4th edition.pdf internal audit
Chapter 9 PPT 4th edition.pdf internal auditChapter 9 PPT 4th edition.pdf internal audit
Chapter 9 PPT 4th edition.pdf internal audit
 
8447779800, Low rate Call girls in Rohini Delhi NCR
8447779800, Low rate Call girls in Rohini Delhi NCR8447779800, Low rate Call girls in Rohini Delhi NCR
8447779800, Low rate Call girls in Rohini Delhi NCR
 
Market Sizes Sample Report - 2024 Edition
Market Sizes Sample Report - 2024 EditionMarket Sizes Sample Report - 2024 Edition
Market Sizes Sample Report - 2024 Edition
 
Memorándum de Entendimiento (MoU) entre Codelco y SQM
Memorándum de Entendimiento (MoU) entre Codelco y SQMMemorándum de Entendimiento (MoU) entre Codelco y SQM
Memorándum de Entendimiento (MoU) entre Codelco y SQM
 
Traction part 2 - EOS Model JAX Bridges.
Traction part 2 - EOS Model JAX Bridges.Traction part 2 - EOS Model JAX Bridges.
Traction part 2 - EOS Model JAX Bridges.
 
Kenya’s Coconut Value Chain by Gatsby Africa
Kenya’s Coconut Value Chain by Gatsby AfricaKenya’s Coconut Value Chain by Gatsby Africa
Kenya’s Coconut Value Chain by Gatsby Africa
 
8447779800, Low rate Call girls in Tughlakabad Delhi NCR
8447779800, Low rate Call girls in Tughlakabad Delhi NCR8447779800, Low rate Call girls in Tughlakabad Delhi NCR
8447779800, Low rate Call girls in Tughlakabad Delhi NCR
 
FULL ENJOY Call girls in Paharganj Delhi | 8377087607
FULL ENJOY Call girls in Paharganj Delhi | 8377087607FULL ENJOY Call girls in Paharganj Delhi | 8377087607
FULL ENJOY Call girls in Paharganj Delhi | 8377087607
 
Marketplace and Quality Assurance Presentation - Vincent Chirchir
Marketplace and Quality Assurance Presentation - Vincent ChirchirMarketplace and Quality Assurance Presentation - Vincent Chirchir
Marketplace and Quality Assurance Presentation - Vincent Chirchir
 
(Best) ENJOY Call Girls in Faridabad Ex | 8377087607
(Best) ENJOY Call Girls in Faridabad Ex | 8377087607(Best) ENJOY Call Girls in Faridabad Ex | 8377087607
(Best) ENJOY Call Girls in Faridabad Ex | 8377087607
 
Ten Organizational Design Models to align structure and operations to busines...
Ten Organizational Design Models to align structure and operations to busines...Ten Organizational Design Models to align structure and operations to busines...
Ten Organizational Design Models to align structure and operations to busines...
 
No-1 Call Girls In Goa 93193 VIP 73153 Escort service In North Goa Panaji, Ca...
No-1 Call Girls In Goa 93193 VIP 73153 Escort service In North Goa Panaji, Ca...No-1 Call Girls In Goa 93193 VIP 73153 Escort service In North Goa Panaji, Ca...
No-1 Call Girls In Goa 93193 VIP 73153 Escort service In North Goa Panaji, Ca...
 
Call Us ➥9319373153▻Call Girls In North Goa
Call Us ➥9319373153▻Call Girls In North GoaCall Us ➥9319373153▻Call Girls In North Goa
Call Us ➥9319373153▻Call Girls In North Goa
 
APRIL2024_UKRAINE_xml_0000000000000 .pdf
APRIL2024_UKRAINE_xml_0000000000000 .pdfAPRIL2024_UKRAINE_xml_0000000000000 .pdf
APRIL2024_UKRAINE_xml_0000000000000 .pdf
 
Organizational Structure Running A Successful Business
Organizational Structure Running A Successful BusinessOrganizational Structure Running A Successful Business
Organizational Structure Running A Successful Business
 
Innovation Conference 5th March 2024.pdf
Innovation Conference 5th March 2024.pdfInnovation Conference 5th March 2024.pdf
Innovation Conference 5th March 2024.pdf
 
Unlocking the Future: Explore Web 3.0 Workshop to Start Earning Today!
Unlocking the Future: Explore Web 3.0 Workshop to Start Earning Today!Unlocking the Future: Explore Web 3.0 Workshop to Start Earning Today!
Unlocking the Future: Explore Web 3.0 Workshop to Start Earning Today!
 
Cyber Security Training in Office Environment
Cyber Security Training in Office EnvironmentCyber Security Training in Office Environment
Cyber Security Training in Office Environment
 
Corporate Profile 47Billion Information Technology
Corporate Profile 47Billion Information TechnologyCorporate Profile 47Billion Information Technology
Corporate Profile 47Billion Information Technology
 

Field Lubricity Measurements Correlate with Improved Performance of Novel Water-Based Drilling Fluid

  • 1. 1 “Field Lubricity Measurements Correlate with Improved Performance of Novel Water-Based Drilling Fluid” M. Redburn, H. Dearing, Newpark Drilling Fluids, F. Growcock, Occidental Oil and Gas Corporation This paper was presented at the 11 th Offshore Mediterranean Conference and Exhibition in Ravenna, Italy, March 20-22, 2013. It was selected for presentation by OMC 2013 Programme Committee following review of information contained in the abstract submitted by the author(s). The Paper as presented at OMC 2013 has not been reviewed by the Programme Committee. Abstract A significant function of drilling fluids is reduction of frictional forces between the wellbore and the drill string. New techniques in drilling and completions are being used to drill horizontal wells in unconventional resources. Because these frictional forces can potentially limit the lateral length of a well, it is especially important to manage friction to avoid excessive torque and drag on the drill string. A high-performance water based fluid has been developed that reduces torque and drag to levels normally associated with non-aqueous fluids (NAFs). A lubricity tester is often used to evaluate and predict the impact made from the use of a drilling fluid additive on friction. The most common tester, the Fann or OFITE Model 212, is normally used in a laboratory setting. This EP (Extreme Pressure) and Lubricity Tester is designed to simulate contact between a drill string and casing and consists of a rotating ring and stationary block, which are immersed in the drilling fluid. Since an exact load under wellbore conditions is hard to determine, typically fixed levels of contact forces are used. While the EP and Lubricity Tester has been used in drilling fluid laboratories for many years, it has not been used as an instrument in the field on a regular basis until now. When the results of lubricity tests are measured and reported daily, the fluid can be modified with additives to maintain a target Coefficient of Friction, or CoF. Because fluid lubricity is affected by changing drilling fluid properties and wellbore conditions, infrequent laboratory lubricity tests provide little benefit, whereas field measurements made on a regular basis can help to ensure that the lubricity of the fluid stays on target. Regular field measurements also allow for detailed statistical analysis of the lubricity and its relationship to other fluid properties. Controlling the drilling fluid lubricity within specified ranges and comparing the CoF to wellbore torque and drag achieves the results required of a high-performance fluid in critical applications. Post-well analysis with industry-accepted software can be used to find a corresponding wellbore friction factor on the final casing run. In this study, over 50 casing runs made with the high- performance drilling fluid were analyzed and correlated with the measured CoF. By doing so, the benefits of the high-performance water based fluid system could be quantified and its performance optimized for future applications. Introduction With the explosive growth of drilling into unconventional shale plays, operators have found that it is imperative to have an effective solution to manage the frictional forces seen in long horizontal laterals. Although conventional NAFs (oil-based and synthetic-based drilling fluids) usually provide sufficient lubricity, they also have significant disadvantages, especially high cost, expensive infrastructure, and growing environmental concerns. To manage the frictional forces experienced without using NAFs, a high performance water-based fluid was developed that focuses on reducing friction in long laterals.
  • 2. 2 The concepts associated with friction have been explored by scientists including da Vinci and Coulomb.1 One useful parameter, the coefficient of friction (CoF), is a unitless number that serves to indicate the mechanical interaction between two surfaces. The static CoF is the ratio of the force required to initiate movement to the normal force holding the surfaces together. The kinetic CoF is the ratio of the force required to continuously move the surfaces to the normal force holding the surfaces together. Generally, it is the kinetic CoF that is measured and is thought to provide a measure of the frictional forces encountered while drilling ahead. When the contact surfaces are immersed in a fluid, such as the drilling fluid, the force required to move the surfaces is usually lower. Thus the drilling fluid acts to lubricate the drillstring. The reduction in CoF provided by the drilling fluid is a function of fluid composition. CoFs measured for water- based drilling fluids generally range from 0.15 to 0.45, but typically vary from 0.20 to 0.28. CoFs measured for NAFs generally range from 0.05 to 0.15, but typically vary from 0.07 to 0.14. The lower the CoF, the easier it is to initiate or sustain movement of the two surfaces. In oil and gas well drilling, a reduced CoF will allow an operator to easily move and rotate the drill string in the wellbore. Every well encounters losses of transitional power to drill the wellbore. This occurs whether the well is directional or vertical. These losses of power are usually lumped together and labeled torque and drag and combined in the term “friction factor.” The friction factor and the CoF are thought to track each other. Overcoming some of the negative forces exerted on a drill string while drilling a well can provide better weight transfer to the bit and increase the rate of penetration. Once the well is complete, the power from the drilling rig must overcome the axial forces to retrieve the pipe from the hole. Reducing the friction factor can result in longer laterals; less expensive equipment, reduced wear on tools, reduced casing wear, increased tool life, and reduced vibration. CoFs can be measured with devices as simple as a sliding block on an inclined plane to high pressure/temperature systems which have the capability of measuring effects of solid and liquid additives and periodically replenishing the additive between the contact surfaces. In this study, CoF measurements were made in the field with a simple ambient pressure and temperature device that measures the force required to maintain rotation of a steel ring in contact with a steel block immersed in the drilling fluid. Lubricity tests were conducted on 50 wells, and the results were compared with friction factors derived from torque and drag data collected while running casing. The latter were determined using industry-accepted torque and drag software. The analysis results in a friction factor that can be compared to industry-accepted values as well as used for design purposes in well planning. Reducing Friction There have been numerous mechanical methods proposed to reduce frictional forces in wellbores. While the advances in mechanical tools to reduce friction have proven successful, adding this hardware can increase risk from mechanical failure or change the flow pattern and increase the risk for packing off the annulus with drilled cuttings. In addition, most of these aids are not available when the casing is run in the wellbore. Since this analysis utilizes data from casing runs without mechanical aids, their effect cannot be investigated. Additions to drilling fluids to reduce the frictional forces that are present at contact points between the well bore and drill pipe have mixed success. Solid materials like beads made from glass or plastic are used with the idea that the beads act essentially as ball bearings between the drill pipe and the wellbore. Most successes with solid materials have been in horizontal wells using smooth, hard materials. However, size degradation of the beads from high speed ejection through bit nozzles and grinding between the drill string and casing or open hole can be
  • 3. 3 problematic, as will the increase in surface area of the solids.. Drilling beads add to the fluid expense, and in most cases a significant fraction is removed by solids control equipment at the surface. Liquid lubricants added to drilling fluid have successfully achieved a reduction in torque and drag but effects are generally short lived and or affect the mud properties. Most effective use has been spot applications and slug treatments on an as needed basis for temporary relief. This allows the lubricant to effectively wet the surface and maintain a film with some strength. However, the effect is fleeting, because the film strength is usually not great enough to withstand the large forces exerted between the drill string and casing or open hole. Furthermore, liquid lubricants generally lose their effectiveness as they are increasingly emulsified by shear or by chemical additions needed to maintain drilling fluid properties.2 With the advent of extended reach horizontal wells, it became increasingly clear that water- based drilling fluids would need to undergo a step change in lubricity. Because of the limitations of solids and liquid lubricants, it was decided to focus on developing a WBM that had an intrinsically low CoF and possessed some of the other attributes of NAFs, especially high levels of shale inhibition. Thus, the development efforts focused on a high-performance (highly inhibitive, highly lubricious) WBM. Furthermore, since extended reach wells are becoming increasingly deeper, the drilling fluid would also need to be rugged and versatile to handle unforgiving environments like elevated temperatures and high fluid densities. A newly developed clay-free polymer fluid with a liquid lubricant was designed to resist harsh environments and still perform equivalently to or outperform conventional NAFs.3 This high- performance water-based mud enhanced with the liquid lubricant was designed to provide greater than normal film strength and resist excessive emulsification. Since its introduction, this high-performance WBM has been used on over a thousand wells. Onsite measurements of CoF of the high- performance water-based drilling fluid were made with the OFITE 212 EP (Extreme Pressure) and Lubricity Tester (see Fig. 1). These were conducted in Lubricity Test mode by measuring the amount of force required to continuously rotate a hardened steel ring in contact with a hardened steel block while immersed in the high-performance WBM. Establishing Measurement Criteria A comprehensive assessment of 50 wells drilled with the high-performance water-based fluid was randomly chosen from a data set of over 100 wells. A program to obtain data from casing runs for analysis was established in 2011. This data is used with industry-accepted software4 to analyze the casing runs to determine an equivalent wellbore friction factor. The information obtained includes CoF and friction factor, which provides a basis for establishing system performance and future fluid property goals. These wells encompass regions in the United States where the high- performance fluid has been used. Every well is unique in that there is variability in lateral lengths, build angles, formations, drilling fluid, etc. As expected these inputs affect the wellbore friction as evidenced by the hook loads when running casing. Under ideal circumstances, the friction factor should be independent of the depth, well path, casing size/weight and formation. Figure 1. OFITE 112 EP & Lubricity Tester
  • 4. 4 In most analyses, two friction factors are utilized, one for the cased portion of the hole and one for the open hole section. This analysis used a single friction factor for both casing and open hole. This is an acceptable simplification because the bulk of the frictional forces in horizontal wells are found in the build and lateral sections, which are open hole. Table 1 gives typical values used for friction factor for various types of drilling fluids. The values given for the “high- performance water-based” system analyzed for this work of 0.10 – 0.30 will be discussed at length later. Typical values of CoF for steel on steel are also given in Table 1. Table 1. Typical Friction Factors and CoFs Used in Modeling Torque and Drag Drilling Fluid Open Hole Friction Factor4 Steel on Steel Coefficient of Friction (CoF) Air 0.40 – 0.60 -- Foam Water-Based 0.35 – 0.55 -- Lignosulfonate Water-Based 0.20 – 0.30 0.20 – 0.28 Polymer Water-Based 0.20 – 0.30 0.20 – 0.28 Oil-Based 0.15 – 0.20 0.07 – 0.13 High-Performance Water-Based 0.10 – 0.30 0.04 – 0.10 The protocol followed for the lubricity tests included rotation of the test ring at 60 rpm and application of 150 in-lb torque to the block, which generated 720 psi between the two steel surfaces. The surfaces are a hardened steel block and a hardened rotating steel Timken ring. Though the use of a steel block does not exactly represent the wellbore, it reduces variability and increases reproducibility of the measurements. Though the CoF observed for steel on rock is expected to be higher than for steel on steel, the trends are expected to be similar. T.C. Mondshine found in his experimental lubricity tests that many lubricants which performed well in lab-built fluids did not perform as well in the field.5 Once contaminants and mud additives (solids, crude, emulsifiers, thinners, etc.) were incorporated into the drilling fluid, these lubricants were rendered less effective. The high-performance drilling fluid used in the wells of this study is unique in that the mud lubricity is maintained fairly well throughout the drilling process. This was proven by recording similar values of the mud CoF over extended periods of time using the EP and Lubricity Tester. Nevertheless, as will be shown below, solid additives like lost circulation materials (LCM) can still affect the friction factor without showing a similar effect on the CoF, a phenomenon that we believe is an artifact of the EP and Lubricity Tester. In the field applications used for this study, CoF was measured as part of every mud check throughout the interval where the high-performance drilling fluid was being used. The CoF values reported in Tables 2, 3, and 5 are averages over the high-performance mud interval. The CoFs measured during the casing runs are also reported. The friction factor is calculated from the force required to move the pipe up and down within the wellbore. When running casing, this is done during the collection of the pick-up and slack-off loads. Along with these data, casing size, type, weight, standoff devices, and the surveys for the well path are used to model the casing run. This information is entered into the computer modeling software to obtain a friction factor that generates curves that model closely the actual pick-up and slack-off load data. The output of the software is a graph relating the axial loads
  • 5. 5 required to move the string (see Figs. 5-7). Slack-off values are considered to be most reliable for obtaining friction factors due to the fact that many times the casing is not fully picked up when running casing and may only be picked up enough to release the casing slips. Friction Factor and Lubricity Data Analysis The aim of this statistical analysis was to determine the significance of mud lubricity and the impact it has on the friction factor in the wellbore while running casing. In Table 2 and Fig. 2 below, it is seen that, on average, the resulting friction factor with the high-performance fluid was 0.21. Table 2. Friction Factor and CoFs for Fifty-Well Data Set Friction Factor Average CoF CoF while Running Casing Average 0.21 0.11 0.09 N 50 50 50 Standard Deviation 0.07 0.03 0.03 Mode 0.30 0.10 0.10 Median 0.20 0.11 0.09 Minimum 0.10 0.05 0.04 Maximum 0.30 0.19 0.19 0.2000.1750.1500.1250.1000.0750.050 0.30 0.25 0.20 0.15 0.10 Co F w hile Running Ca s ing. FrictionFactor F riction F actor v s C oF w hile R unning C as ing Figure 2. Friction Factor vs. CoF in the Open Hole (Wells with and without LCM). Note that some of the symbols represent two data points. When a scatter plot of the data is examined, there does not appear to be a strong correlation of CoF with friction factor. This is confirmed with statistical analysis of the 50-well data. Even though on average the friction factor is nearly the same as is typical for NAFs (see Table 1), the spread between 0.10 and 0.30 suggests caution is needed if one were to design wells on the
  • 6. 6 basis of the average friction factor. Another way of describing this situation would be that if a design factor of 0.20 had been used, on 38% of the wells the friction factor would exceed the design factor. If achieving a 0.20 friction factor or less on the casing run were critical to success of the well, this would not be acceptable. It should be noted that for all the wells in the data set, casing was run successfully to bottom, so the higher friction factors experienced were not detrimental to well performance. Discussions with field personnel suggested that at least some of the variability might be associated with lost circulation material (LCM), which was carried in half of the wells. Consequently, the wells drilled without LCM were re-analyzed in the same manner. The results are shown in Table 3 and Fig. 3. The average friction factor for these wells is 25% less than the data for all 50 wells, and the standard deviation for the friction factor is almost half of the value of that for the 50-well data set. Table 3. Friction Factor and CoFs for Wells without LCM Friction Factor Average Lubricity While running casing Average 0.15 0.10 0.08 N 25 25 25 Stand Deviation 0.04 0.04 0.03 Mode 0.20 0.09 0.08 Median 0.15 0.11 0.08 Minimum 0.10 0.05 0.040 Maximum 0.22 0.18 0.16 0.2000.1750.1500.1250.1000.0750.050 0.30 0.25 0.20 0.15 0.10 Co F w hile Running Ca s ing FrictionFactor 0.100 F riction F actor v s C oF w hile R unning C as ing Figure 3. Friction Factor vs. CoF in the Open Hole (Wells without LCM). Note that some of the symbols represent two data points. Removing wells in which LCM was used drastically reduces variability in the friction factor. It also suggests that setting a specification for CoF while running casing in the absence of LCM is possible. If the CoF were specified to be 0.10 or less, the friction factor without LCM would be
  • 7. 7 0.20 or less most of the time. Indeed, 96% of the wells drilled without LCM would meet these criteria. It is interesting to note that the specification of 0.10 or less had informally evolved as a design criterion for many of the wells drilled with the high-performance fluid. The data described here support that experience-derived “rule of thumb.” Table 4 below lists some of the main variables of the wells in the data set. Not only did the base drilling fluid vary, but also mud density, concentration of lubricant (drilling performance enhancer, or DPE), well depth and lateral length. The high-performance WBM also used various types of shale inhibitors. Table 4. General Well Information for Fifty-Well Data Set Mud Description High-performance WBM with drilling performance enhancer (DPE) ranging from 1.5 to 4 vol %, with inhibition as required Field brine with DPE ranging up to 4 vol % Shale Inhibitor in high-performance WBM Sodium chloride Potassium silicate Potassium carbonate Amine compounds Asphaltic materials Note: Selection and concentration depend on the application requirements Mud Density 8.5 to 16.3 ppg (1.02 to 1.96 SG) True Vertical Depth 6,500 to 14,500 ft (1,980 to 4,420 m) Measured Depth 10,500 ft to 20,300 ft (3,200 to 6,200 m) Lateral Length 3,500 to 9,600 ft (1,070 to 2,930 m) Table 5 shows the friction factor, CoF, dog leg severity, tortuosity, and lost circulation material concentration used for the 50-well data set. The data are conditionally formatted with the smaller more desirable values in green graduated to the higher, less desirable values in red. There does not seem to be any relationship between friction factor and the survey-derived data. This indicates that the friction factor as determined from the modeling software is independent of the wellbore path and its variability. Correlation analysis of the survey data and friction factor confirms this.
  • 8. 8 Table 5. Fifty Well Dataset, Conditionally Formatted Friction Factor CoF while running casing Well Average CoF Max Dogleg Severity °/100ft Average Dogleg Severity in build °/100ft Difference of Max to average Dogleg severity Average absolute Tortuosity °/100ft LCM while running casing lb/bbl Field 0.200 0.040 1 0.053 19.74 9.65 10.10 0.73 0.00 Region 1 0.100 0.050 2 0.050 10.09 7.30 2.79 0.83 0.00 Region 1 0.100 0.040 3 0.052 17.98 10.06 7.92 0.80 0.00 Region 1 0.100 0.040 4 0.065 19.74 8.37 11.37 0.75 0.00 Region 1 0.300 0.110 5 0.108 13.78 7.78 6.00 1.13 3.00 Region 2 0.150 0.050 6 0.159 10.04 6.85 3.19 0.82 5.00 Region 2 0.150 0.080 7 0.179 10.93 6.94 3.99 1.13 0.00 Region 2 0.100 0.100 8 0.156 11.55 7.26 4.29 1.14 5.00 Region 2 0.300 0.080 9 0.099 12.80 8.62 4.18 1.23 2.00 Region 2 0.150 0.100 10 0.158 12.26 8.30 3.96 1.11 7.00 Region 2 0.100 0.090 11 0.133 10.93 8.63 2.30 0.89 4.00 Region 2 0.200 0.070 12 0.143 11.31 7.70 3.61 1.01 0.00 Region 2 0.300 0.070 13 0.104 11.20 6.77 4.43 1.09 4.00 Region 2 0.200 0.070 14 0.156 11.57 7.27 4.30 0.94 0.00 Region 2 0.300 0.123 15 0.174 11.06 7.09 3.97 1.31 7.00 Region 2 0.200 0.130 16 0.125 10.73 7.95 2.78 1.23 6.00 Region 2 0.150 0.080 17 0.120 11.03 7.49 3.54 1.29 0.00 Region 2 0.100 0.070 18 0.089 14.21 8.49 5.72 0.87 0.00 Region 2 0.120 0.080 19 0.109 13.47 9.43 4.04 1.56 0.00 Region 2 0.220 0.090 20 0.089 15.97 9.83 6.14 1.30 0.00 Region 2 0.240 0.100 21 0.107 12.74 6.84 5.90 1.26 0.00 Region 2 0.300 0.100 22 0.109 24.32 7.86 16.46 1.00 4.00 Region 2 0.200 0.090 23 0.093 11.22 7.49 3.73 1.19 0.50 Region 2 0.170 0.090 24 0.100 19.29 8.61 10.68 0.93 4.00 Region 2 0.300 0.090 25 0.090 11.95 7.56 4.39 1.03 2.00 Region 2 0.300 0.090 26 0.109 12.07 7.19 4.88 1.39 1.00 Region 2 0.300 0.120 27 0.134 14.55 6.65 7.90 1.31 8.00 Region 2 0.160 0.140 28 0.128 12.38 7.82 4.56 1.05 0.00 Region 2 0.300 0.090 29 0.101 13.40 7.46 5.94 1.06 1.00 Region 2 0.200 0.080 30 0.107 11.60 8.35 3.25 1.11 0.00 Region 2 0.100 0.080 31 0.116 13.81 8.63 5.18 1.31 0.00 Region 2 0.300 0.090 32 0.098 10.63 7.12 3.51 0.89 7.00 Region 2 0.190 0.100 33 0.100 12.97 7.23 5.74 1.50 1.50 Region 2 0.120 0.080 34 0.118 14.06 7.41 6.65 1.14 1.00 Region 2 0.200 0.070 35 0.068 10.47 8.43 2.04 0.95 0.00 Region 2 0.220 0.110 36 0.151 10.32 7.23 3.09 1.05 3.00 Region 2 0.300 0.160 37 0.171 13.61 7.15 6.46 1.20 5.00 Region 2 0.250 0.190 38 0.191 13.06 7.20 5.86 1.40 8.00 Region 2 0.300 0.097 39 0.127 12.01 7.00 5.01 1.19 6.00 Region 2 0.300 0.070 40 0.135 10.72 7.44 3.28 0.94 2.00 Region 2 0.300 0.090 41 0.108 11.89 6.98 4.91 1.17 4.00 Region 2 0.300 0.140 42 0.111 12.00 7.23 4.77 1.25 6.00 Region 2 0.200 0.080 43 0.106 15.07 10.70 4.37 0.98 0.00 Region 3 0.200 0.060 44 0.057 17.82 8.99 8.83 1.05 0.00 Region 3 0.150 0.090 45 0.107 18.75 10.48 8.27 1.03 0.00 Region 4 0.100 0.060 46 0.070 14.63 7.92 6.71 0.65 0.00 Region 5 0.200 0.040 47 0.047 15.76 9.93 5.83 0.92 0.00 Region 6 0.200 0.040 48 0.096 12.81 7.42 5.39 1.10 0.00 Region 6 0.200 0.090 49 0.089 14.21 10.89 3.32 1.17 0.00 Region 7 0.150 0.160 50 0.137 13.36 9.52 3.84 1.15 0.00 Region 7
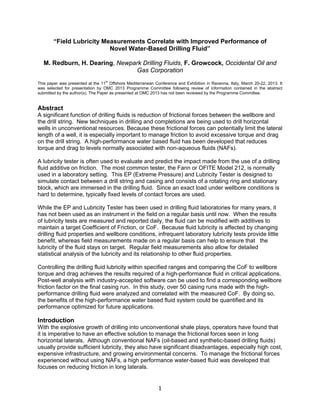
  • 9. 9 Reducing Variability When Using LCM The variability associated with the use of LCM does suggest that if well designs change, particularly to longer laterals, steps should be taken to reduce the variability of the friction factor. Possible actions could include evaluation of LCM concentration effect on friction factor, removal of the LCM prior to running casing, and alternative LCM materials. An alternative is to use a different lubricity tester. It is well known that the action involved in measuring CoF with the EP and Lubricity Tester sweeps solids away from the contact surfaces. Consequently, the effects of solids larger than a few microns in size are not observed. Other lubricity test devices are available which retain the solids in the space between the contact surfaces. These have been shown to be useful for measuring effects of solid lubricants on CoF.6 While the high-performance fluid with LCM continues to be used successfully in this area and is resulting in reduced well costs, efforts to identify sources of variability are needed in anticipation of future changes to well design. Closely working with field personnel, including fluid service technicians, drilling fluid engineering supervisors and operator’s representatives, can help to improve performance, of course. With this technical support, sources of variability can be identified and uncertainties can be reduced. A robust program of monitoring performance, determining and communicating lessons learned, and training in analysis techniques has been implemented to continue to improve performance through evolution of the fluid technology. Improving Performance While Drilling Reducing the axial drag and the rotational torque from contact due to the weight of the pipe against the wellbore will enable drilling longer horizontal laterals. Since the longer horizontals expose more formation, there is a tendency to maximize lateral length. If the torque limit on the drill string is approached, then drilling cannot proceed without greatly increasing the risk of drillstring failure. Modeling these forces is important to prevent problems and to predict the results of all operations associated with the wellbore.7 Relating results from a field instrument can help with evaluation of fluid-treating strategies, such as treatment with an appropriate lubricant like the drilling performance enhancer (DPE) designed for the high-performance water- based drilling fluid. The impact that the DPE has on the friction factor can be discerned by analyzing the on bottom and off bottom torque. In the example shown in Fig. 4, the lateral of a well in Area 1 that was being drilled with produced brine began experiencing increasing torque. By the time drilling had progressed to 13,600 ft (4,150 m), the rate of torque increase was such that it was obvious that the torque limit of the drill string would be exceeded before reaching planned total depth. The base CoF of the brine was 0.12. DPE was added at that time in 1 vol % increments. With the initial addition of DPE, the CoF was reduced to 0.04, but shortly thereafter began increasing and reached 0.05 by the time the next addition was made. These periodic treatments proceeded until the nominal DPE concentration (assuming no depletion) reached 4 vol%. At this time, the torque remained at a sustained low level until reaching a total measured depth of over 20,000 ft (6,100 m). The torque limit on the drill string was not reached. Use of produced brine to replace NAFs as drilling fluids has been successful in this application at least in part because of the lubricant DFE.
  • 10. 10 Figure 4. Sustained Torque Reduction While Drilling Example Casing Runs After drilling the well discussed in the previous section, a complete analysis of the casing run was carried out by recording the hook load after every 20 joints of casing. The hook load was then compared to a computer generated hook load with a 0.20 friction factor. Fig. 5 below is an example graphical representation of the data collected during the casing run. The “Actual Tripping Out” values are much lower than expected because the string was not picked up completely while running casing. The string was only picked up sufficiently to pull off of the slips. Correlation of the friction factor to the pickup weight is not possible since full pickup loads were not recorded and may not have occurred.
  • 11. 11 Hook Load (kip) 60 80 100 120 140 160 180 200 RunMeasuredDepth(ft) 0 5000 10000 15000 20000 L E G E N D Rotate Off Bottom Rotate On Bottom Tripping Out Tripping In Actual Tripping In Actual Tripping Out Figure 5. Region 1 Casing Run with a 0.20 Friction Factor On wells using the high-performance fluid, a standard data collection process resulted in the data required for analysis of the casing run. Figs. 6 and 7 give results for two wells in Region 2. These show the typical results of the casing run analysis for a friction factor of 0.20 and 0.15. Other friction factors – both lower and higher – were also examined, but these two values appeared to show the closest matches between the Tripping In fitted curve and the Actual Tripping In data. Close examination of Figs. 6 and 7 shows that a friction factor of 0.15 is probably a better match of the fitted curve to the data than a friction factor of 0.20. Hook Load (kip) 40 60 80 100 120 140 160 180 200 RunMeasuredDepth(ft) 0 2000 4000 6000 8000 10000 12000 L E G E N D Rotate Off Bottom Rotate On Bottom Tripping Out Tripping In Actual Tripping In Actual Tripping Out Figure 6. Region 2 Casing Run with a 0.20 Friction Factor
  • 12. 12 Hook Load (kip) 40 60 80 100 120 140 160 180 RunMeasuredDepth(ft) 0 2000 4000 6000 8000 10000 12000 L E G E N D Rotate Off Bottom Rotate On Bottom Tripping Out Tripping In Actual Tripping In Actual Tripping Out Figure 7. Region 2 Casing Run with a 0.15 Friction Factor Conclusions Wellbore friction is an important consideration in horizontal well design. Focusing on the casing running operations and evaluating their results provides a useful indicator of overall well success. Analyzing the results of a large number of successful wells, in this case 50, provided insight into the performance and confidence in predicting future results. Use of the high- performance water-based fluid developed for horizontal drilling resulted in performance on par with oil-based mud and other NAFs at considerable well cost savings. The analysis of data from the 50 casing runs resulted in the following insights:  Wells drilled with a novel high-performance drilling fluid showed some significant variability in friction factor, apparently a function of lost circulation material, although the average friction factor of 0.21 was similar to that of NAFs  Analysis of the data from the 25 wells in which LCM was not used gave an average friction factor of 0.15, with 96% of the wells showing less than 0.20  Studying the variability in torque and drag associated with casing runs can be useful to find ways to improve performance The newly developed Drilling Performance Enhancer, DPE, can provide  Sustained torque reduction while drilling  Successful drilling of horizontal wells that normally require NAFs
  • 13. 13 Acknowledgments The authors would like to acknowledge Newpark’s Evolution® certified fluid technicians for their dedicated data collection that made this paper possible. References 1 http://en.wikipedia.org/wiki/Friction 2 F.B. Growcock, T.P. Frederick, A.R. Reece, Amoco Corp; G.W. Green, University of Oklahoma; and M.D. Ruffin, University of Tulsa: “Novel Lubricants for Water-Based Drilling Fluids”, SPE International Symposium on Oilfield Chemistry, February 16-19, 1999, Houston, Texas. 3 D. Breeden, C. Dougan, D. Shank and S. Summers, Newpark Drilling Fluids, LLC: “Haynesville Performance Review: Unique Clay Free Polymer Drilling Fluid System” AADE-11- NTCE-39, 2011 AADE National Technical Conference, Houston, Texas, April 12-14, 2011. 4 Landmark WELLPLAN™ Torque/Drag Analysis software. 5 T.C. Mondshine: “Drilling-mud lubricity: Guide to reduced torque and drag,” The Oil and Gas Journal, December 7, 1970, pp 70-73. 6 A. Vankadari, S. Miska, N. Takach, E. Ozbayoglu, R. Majidi, University of Tulsa, F. Growcock, M-I SWACO and C. Stouffer, Drilling Specialties Co.: “Experimental Study of Torque-Reducing Additives for Extended Reach Drilling,” AADE-11-NTCE-14, 2011 AADE National Technical Conference and Exhibition, Houston, Texas, April 12-14, 2011. 7 M. S. Aston, P. J. Hearn and G. McGhee: “Techniques for Solving Torque and Drag Problems in Today's Drilling Environment,” SPE 48939, 1998 SPE Annual Technical Conference and Exhibition, New Orleans, September 27-30, 1998.