Strategic Analysis of Mobile Social Networks from a Spanish Operator
•
90 j'aime•2,341 vues

The research deals with a Strategic Analysis of Mobile Social Networks under a Spanish operator’s point of view that I presented in public last 18th of November at the UPM University of Madrid, Spain. The slides are: Social networks and virtual communities Social Network Sites Social Network Site users Mobile communication technologies Mobile Internet Mobile virtual communities Economic paradigms Advertising on the Internet SNS y MSNS adversiting trends General environment and ICT Hyper-sector The mobile communications sub-sector SWOT analysis of the main Spanish mobile operators Competitive forces. PORTER Analysis SNS y MSNS competitive scenario Service provision scenarios Strategic recommendations

Recommandé
Recommandé
Contenu connexe
Tendances
Tendances (20)
Similaire à Strategic Analysis of Mobile Social Networks from a Spanish Operator
Similaire à Strategic Analysis of Mobile Social Networks from a Spanish Operator (20)
Dernier
Dernier (20)
Strategic Analysis of Mobile Social Networks from a Spanish Operator
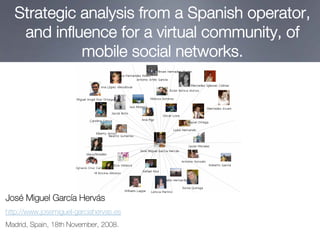
- 1. Strategic analysis from a Spanish operator, and influence for a virtual community, of mobile social networks. José Miguel García Hervás http://www.josemiguel-garciahervas.es Madrid, Spain, 18th November, 2008.
- 2. Index and distribution of the presentation sent ation volution of the pre E Business Strategic analysis of Internet and scenario and mobile social context of mobile networks from a Social networks virtual mobile social networks Spanish operator and virtual communities supply Communities The Spanish mobile operators sub-sector SWOT of the main Spanish mobile operators Mobile communication technologies Competitive forces. PORTER Analysis Mobile Internet Competitive scene for SNS and MSNS Mobile virtual communities MSMS Service provision scenario Strategic recommendations Social networks and virtual communities Economic paradigms and implications Social Network Sites Advertising on the Internet Social Network Site users SNS y MSNS advertising trends Spanish environment and ICT Hype-Sector
- 3. Social Networks and Virtual Communities •Information Society: social changes, capacity to access information in any format, moment and place. Context • Web 2.0: Internet stops being a mere consult instrument and gives way to an open platform based on participation. • Social Computing: the individual’s conduct is influenced by technology. Social Networks: • Structure formed as result of the interaction between individuals/groups. They’re represented by graphs formed by nodes and links. There are different types. • The relation between nodes is as important as their attributes. Virtual communities: • Social Networks whose members share interests, ideas or objectives using IT solutions for their communications. The 6 Degrees of Separation Hypothesis: any person is connected to any other by no more than 5 intermediaries.
- 4. Social Network Sites Internet page category which offers Social Software (applications with the described objective) online for the interaction between users and the instantaneous sharing of digital information. • The value resides in the software – user data relationship (infoware). • SNS (Social Network Services) are classified as ISN (Internal Social Networking) and ESN (External Social Networking) and in any case allow: • The creation of user profiles: to identify themselves and make themselves known. • Contacts list: the user’s position in the community depends on them. • Communication and interaction between nodes: message delivery and reception. • UGC (User Generated Content) generation and publication : giving growing power to the user, who has creative freedom and freedom of speech. • Associated Risks: privacy, ill-intentioned use, identity theft… • They are classified as general (without specific purpose), for professionals (oriented towards work) and specialized (oriented towards certain audiences).
- 5. Social Network Site users The number of Internet users increases and the use of The Net intensifies. The penetration rate of mobile phones exceeds 110% in Spain where data services are the ones that experiment the most increase in use (but it’s still low). General SNS Between 18 and 32 years old, more women (53%) than men (47%), with middle-high education, mobile phone and Internet user, born in the digital age or who has adapted easily to IT solutions. 79% of users connect at least once a week, 21% several times a day, using between 0 and 30 minutes (53,9% of the total of users). Professional SNS Professionals between 30 and 45 years old, mobile phone users. 86% wants to maintain their contacts and 75,4% wants to establish new ones. 62% connects every day or several times a weekend does it during their work hours.
- 6. Mobile communication technologies Digital Universal Network: Meta-network resulting from the interconnection of a heterogeneous and multiple group (of data, mobile phones, etc). Internet is the most notable component, where mobile communications multiply its net effect (Metcalfe’s Law), its usefulness, functionality and potential. • The Mobile Broadband supply and its derived services are partial and limited. • Mobile Internet provides the user with capacity to be present in virtual environments under conditions of ubiquity, guaranteeing access to contents and solutions. • Wireless solutions such as Wi-Fi don’t offer global continuity to the mobility services as of yet. The development of mobile technologies makes some substitute others: • UMTS: Limited Mobile Broadband, multimedia services, 300 Kbps. • HSDPA: optimization, 1 Mbps downstream, real time multimedia solutions. • HSUPA: complements HSDPA, 1,4 Mbps upstream. • Smart mobile phones (smartphones) multimedia and multifunction, currently more prepared as Internet terminals. IMS development: standard for control of Risk for the operator: sessions and global solutions supply, integral being a mere provider of and transversal independently of the access connections network.
- 7. Mobile Internet Common technique in Spain, Free surfing through Internet Don’t require use of a extended and desired by browsers. It entails risk of browser, operated with an operators for traffic control loss of control for operators. application. and its functionalities. WML, xHTML y transcoding. HTML. Java. • Mobility in the New Techno-social Environment (scenario with new social relation forms using IT solutions) is strengthened by the availability of Mobile Internet, its services and SNS ubiquity supply. • The supply depends on the user’s behavior and trends, available technologies and subjacent exploitation models/business models. • Adoption headed by Internet users who demand mobility services. • Still reduced penetration rate because of cost and limited user experience. • Supply from mobile controlled by operators who desire vertical integration of applications, services and contents, not only the connectivity supply. • Traffic can be onnet y offnet: onnet offnet • Tendency to use widgets and location capacities.
- 8. Mobile Virtual Communities • Clients who carry out an early and intensive use, although 58% indicate that Mobile Internet doesn’t satisfy their expectations. Leading • 80% of traffic is generated by 10% of users. 6% of European users users have a set rate for mobile data. • Young, male, digital native. 85% are interested in new forms of communication, 65% in Mobile Internet. • Mobiles play an important role in real time and ubiquitous socialization and in generating content: impact of technology in social habits. • SNS evolve towards the supply of MSNS (Mobile Social Network Services), allowing participation in virtual communities through them and separating the development of a virtual space from position thanks to mobile social communication. • The most significant SNS have their MSNS versions with functions homonymous to the ones available fixed accesses. • Synergy between mobile and Internet communication capacities. • 174 million users in the World in 2011. • Tendency towards OpenSocial, open interfaces, widgets, Webbrowsers and LBS (Location Based Services).
- 9. Economic paradigms and implications Information Net Economy Digital Economy Economy Integrates information assets The value of the product Sector which includes and services as a result of data depends on its number of users. development, production and and work. Knowledge is a Potential based on the distribution of assets and productive resource & an asset. interconnection of all nets. services produced with IT 281.000 millions of GB in the Economic activity tied to the solutions. World (43GB/person). Web 2.0 supply. • Exchange of digital services and assets through IT solutions. • Reduction of barriers to entry, intensification of information competition and saturation. • Reduction of transactional costs of digital assets. It’s not necessary to concentrate the activity around massive products, others are offered as well, others destined for segments and niche markets giving way to the long tail phenomenon. • Vertical disintegration of the value chain giving way to the value constellation of which the user is part, carrying out a role as provider for himself. Final users exchange work, Advertisers, advertising agents attention, data and time for free and market researchers are services. Audiences. clients.
- 10. Advertising on the Internet Substantial increase in Internet audiences: more users who are there more time, strengthening value and usefulness. Consumers exercise control over their entertainment: audience fragmentation. Availability of contents of all kinds, including UGC. Audiences and mostly free digital services, make business models based on advertising consolidate part of the business. • Advertisers invest online to reach their target audience in detriment of traditional media, which are increasing in number and saturation and decreasing in audience. • Types of online advertising: on search engines, in graphic format (premium or not) and classifieds; where graphic and multimedia formats will be increased. • With the Web 2.0: appearance of micro-audiences on multiple webs, blogs and forums in which its possible to carry out an economic exploitation through advertising networks. The online market is 7,4% of the worldwide advertising market, which means a 2 year delay with respect to the forecasts made only 3 years ago. In Spain, this increase will depend on the Internet’s and, it will barely reach 4,5% of the local advertising market, it’s expected to close 2008 with 700 million euros, with a 74,8% growth rate which is clearly at risk because of the economic situation.
- 11. SNS and MSNS advertising trends Techniques are being developed for the supply of adequate advertising for the adequate person, at the right moment and in the adequate format: Data available in SNS + • Contextual selection. Users • Segmentation based on personal information. + • Segmentation according to behavior. Their dedication The mobile is an ideal device for the advertising market: • Constant presence and penetration rate. • Personal and personalized. • Reaches the audience in an individual way. It’s in its test phase. It requires standardization (MMA) and the development of Mobile Internet, as well as of the operators’ help, which for the moment are cautious. It also depends on traditional mass media to be a success for the audience. Both the SNS market as well as that of MSNS are in their initial phase and the success of advertising actions has been very limited. Marketing techniques associated with SNS and MSNS are an opportunity : viral marketing, social networks, corporate profiles, UGC, virtual worlds, blogs, etc. The appearance of Google, Yahoo or Microsoft in the mobile scene show the interest. It’s expected to reach 57.540 million dollars in 2011.
- 12. Spanish environment and ICT Hype-Sector Spain is 3rd in the EU in population growth and 1st in immigration. Social Increase in one-person and one-parent homes. Local and global crisis: decrease in growth and deficit by 2009. Risk of recession by 2009. Increase of unemployment although inflation will be more moderate. Economic Unstable markets and constant turbulence. Drop in consumption and of trust rate. The company creation rate decreases and the rate of dissolution increases. Political National Reform Plan. Among its ideas are: Ingenio 2010 (I+D+i) and the Plan Avanza (more competition, Broadband, innovation, ICT adoption…). Technological Fixed and mobile Broadband network development (HSDPA/HSUPA, LTE). Converging products (quadruple play) and ICT devices. The ICT Hyper-sector (Telecommunication Services, Information Technologies, Telecommunications Industry, Consumer Electronics, Electronic Components and others) is slowing down its growth in 2008 and will do so even more in 2009. The Telecommunication Services sector represents 57% of the Hyper-sector’s revenue, being the main economic contributor, though it has reduced its growth (to 4% per year). At the same time, the main component of this area is the mobile communications sector (46%), with an annual growth of 8%.
- 13. The Spanish mobile operators sub-sector Opposed to the saturation and index of rotation (churn), strategy based Mobile on new services and applications to develop the user’s engagement and penetration rate the improvement of customer loyalty, the market share and the ARPU 111,4% (Average Revenue Per Rate). Search for new ways of business. • Wholesale market: reduction of revenue by 15% as a result of regulation of services. • Retail market: decrease in voice revenue but the total increased at a rate of 6,5% per year in the first trimester of 2008 (Q1 of 2008), as opposed to 14,3% in 2007. In net revenue: • Prepaid grew 3,82% annually and postpaid (83,6% of the total net revenue) 6,95%. • Mobile Internet grew 69,3% annually, it’s not a representative business line so far. • MVNO (Mobile Virtual Network Operator): resellers and whole; low market share. • Competition and threat to the Operators where content suppliers and Internet agents could launch their MVNOs. • To make profitable investments and attend to the segmented market. • Set flat rates for mobile data. Integrated offer of access, telephone service, contents and added value service so as not to be relegated to being a connectivity provider. • Intention of retaining audiences and traffic in the walled gardens to pay off investments. Obsolete and insufficient supply for the long tail. •Opportunity for the supply of contents and services with alliances with the main agents of digital leisure (contents) and Internet.
- 14. SWOT of the main Spanish mobile operators Weaknesses Threats Stock market & political decisions Vertical disintegration, loss of control Slowness and impact of restructuring More competition, new incomings ICT orientation and own services Economic and political situation Strengths Movistar Opportunities Consolidated results and solid ICT Broadband (fixed/mobile), quadruple play Global and local, I+D+i Alliances with Internet agents Market diversity Leadership in new services and contents Weaknesses Threats Complete orientation towards mobile Fixed/ mobile+ contents service packages Insufficient diversification of products More competition, new incomings Discreet results. Impact on Stock market Vodafone Failed forecasts & consumption decease Strengths Opportunities Market segmentation and rates Early alliances with Internet Driving force of mobile Broadband Rates, services and contents Alliances with Internet and contents Substitutes of real quadruple play Weaknesses Threats Macro-figures, political decisions Vertical disintegration, loss of control Slowness and impact of restructuring More competition, new incomings Mobile is the main line of business Economic and political situation Orange Strengths Opportunities Leader in launching of quadruple play Broadband (fixed/mobile), quadruple play Structured in business units Alliances with Internet agents Market diversity Multiservice flat rates
- 15. Competitive forces. PORTER Analysis. New competitors MVNO: competition in price and added value, they acquire market share (1,3%, 32,7% of new lines). They adjust quicker to changes and they focus their business around a distinctive capacity. This service is used as a second line ARPU decrease of MNO (Mobile Network Operator). Attracts digital content and Internet suppliers . Suppliers Companies and competitors Buyers Segmented Stationery: cycle of expansion decrease in growth ARPU adjustment Smartphones. (16% less revenue, 57% less new customers), focus on balance, margins and investments (15% less). 3% of home Market leaded by expenses for Nokia (40,9%), Operators in a reasonable position: • Reduction of consumption free digital leisure. telecommunication Samsung (16,4%), • Those with diversification will have a better position. and Motorola 17,7% less • Redefinition of strategies. (8,7%). expenses, that Intensification of competition, liberalization, multiplied by 2,5 in Iphone changed regulatory pressure: prices, MVNO, possible previous years. the market , G1? Broadband regulation in the horizon… Will use more Own content Supply of converging and added value services, and than 1 mobile services with contents in integrated packages. • Polarization of clients: quality/cost. line. direct agreements with content and • Fragmentation of supply for long tail. Search, compare, Internet suppliers Strategic: digital contents, flat rates, personalize, (OVI). MSNS, Web 2.0 and new ways of communication. complain. Substitutes 4G, wireless Internet, mobile Wi-Fi, FON, terminals, frequencies. Risk for walled gardens, services and operator’s business models.
- 16. Competitive scene for SNS and MSNS • Networks of general purpose are the most successful along with professional ones. The spectacular growth figures are becoming moderate: • SNS time drops 5% and the activity drops 18%. • However, LinkedIn grows at a pace of more than 200% per year in 2008. •SNS proliferate, the novelty effect is lost and they stop being an added value, a lot of them substitute others. • Effort to differentiate and orient towards the target audience. • Strong competition (e.g. OpenSocial vs. Facebook) • Specialized SNS will be more relevant. • Overrated SNS: expectation, advertising battle: • Facebook = 15.000 M$ (100 times its annual sales) • Difficulties to obtain profits: dependent on the capacity to make audiences profitable analyzing information, using it to give added value advertising services and maintaining said audiences. MSNS figures: embryonic state. Barely 1% of worldwide SNS users connects to MSNS. Dependent on 3G terminals, set rates, user experience… The supply of mobile SNS will help find formulas for profits. • Traffic, SMS/MMS, mobile marketing, advertising in MSNS • Appearance of Internet giants, search for agreements with operators. Market will be leaded by UK, Spain and Italy and will develop as a consequence of the development of set rates, multimedia capacities and habits.
- 17. MSMS Service provision scenario Competition between operators and MSNS • Operators Launch their own MSNS (e.g. Telefónica’s keteke) as an answer to: • SNS’ growing power (client base, business volume). • The threat to their walled gardens, control over Mobile Internet and the sale of contents. • ARPU impact of MSNS as opposed to traditional communications (voice, SMS/MMS). • Integral service packages: quadruple play, IMS, available BBDD, location … Alliances between mobile operators and MSNS • Compromised solution: partial opening of walled gardens which were invested in, free and linked provision from operators’ web pages (e.g., MySpace in Orange). • SNS suppliers gain mobility and visibility in their communication actions along with the operators, promote their growth and use, develop new applications. • Operators attract audiences, partially attend to the long tail, generate traffic and business. • Mutual effort to adapt the Internet sector and that of mobile communications. Specialized MVNO launch • Appearance of Internet agents as MVNOs. Requires that MNOs see it as an opportunity, natural evolution and complement making the most of the MVNO characteristics. • Direct competition in exchange for better market segmentation, data experience, externalization of the risk to a specialized third party, the MNO is left to the generic supply. Disappearance of walled gardens and opening of Mobile Internet • Evolution of regulation or access technologies and terminals until replicating fixed accesses. • Responds to the mobile manufacturer’s power and to the pressure of Internet agents.
- 18. Strategic recommendations Mobile operators • Develop alliances with main Internet agents, content producers and Web 2.0 agents as a solution to recover relevance, attract and intensify the use of Fixed and Mobile Internet solutions without distinction and make the most of their audiences. • Progressive opening of walled gardens to attend to the long tail and respond to the improvements made in Access Networks and terminals. • Launch quadruple play service packages + contents with one only flat rate. • Promote market segmentation by launching products with their own brands or those of others competing in price (low-cost rates) and value (service packages): • Launching of their own products or provided by another with experience. • Use and agreement with MVNO, experiment with the disintegration of activities. • Try out new business models based on advertising and on new forms of communication subjacent to the Web 2.0 with the use of flat rates. Social Network Sites • Look for agreement with the telecommunication operators and the synergy with their communication products and contents which complement their own offer. • Define robust and contrasted business models based not only on advertising, but also on services of added value to the user. • Evolve their applications and functionalities offer continually guaranteeing privacy and the correct use of their users’ data. • Develop valuable and effective advertising solutions, as well as measurement tools.
- 19. Thank you! Questions? http://www.josemiguel-garciahervas.es