Contenu connexe
Similaire à Annie Williams Real Estate Market Trends Aug/Sep 2013 (9)
Annie Williams Real Estate Market Trends Aug/Sep 2013
- 1. local market trends
The Real Estate Report
Sඉඖ Fකඉඖඋඑඛඋ
CONDO/LOFT STATISTICS…
The median price for condos/lofts rose 10.3% from
June, and was up 24.6% year-over-year.
Sales were in July by 26.3% from June. Year-over-
year, sales gained 18.9%.
The sales price to list price ratio stayed
over 100% for the seventeenth month
in a row: 105.8%.
This is an extraordinarily tough market
for buyers. It’s important to be calm
and realistic. If you don’t know what to
do or where to begin, give me a call
and let’s discuss your situation and
your options.
Mortgage Closing Costs Rising
Mortgage closing costs have increased by 6% over
the past year, according to Bankrate’s annual
closing cost survey.
So why are fees rising? You can blame two things:
Low and rising mortgage rates, and
New regulations.
Low mortgage rates over the last year have
brought in a wave of refinancing. Loan originators
have plenty of business so they don’t have to
compete. Plus, they realize rates are going to rise
which will decrease the number of loans made.
At that point, they will have to decrease fees to be
more competitive.
The second component of rising costs is the
Consumer Financial Protection Bureau and its new
mortgage regulations.
At any rate, all puns intended, if you haven’t re-
financed yet, it’s time to do it.
JULY MARKET STATISTICS
Sales of single-family, re-sale homes were up
19.9% from last July.
The median price for homes dipped for the
second month in a row, it was down 7.3% from
June. Year-over-year, the median price was up
17.3%.
The sale price to list price ratio has been over
100% since September 2011, except for
December 2012. Last month is was 107%.
SALES MOMENTUM…
for single-family, re-sale homes in San Francisco
rose 1.1 points to +7.5. Sales momentum for
condos/lofts gained 0.4 of a point to +10.3. (See
charts below)
PRICING MOMENTUM…
gained 0.8 of a point to +18.5. Pricing momentum
for condos/lofts rose 0.5 of a point to +17.6.
WE CALCULATE…
momentum by using a 12-month moving average
to eliminate seasonality. By comparing this year’s
12-month moving average to last year’s, we get a
percentage showing market momentum.
Hill & Company
1880 Lombard Street
San Francisco 94123
Fax: (415) 202-1686
Cell: (415) 819-2663
AnnieWilliamsSF@gmail.com
http://www.anniewilliamshomes.com
DRE #01393923
Annie Williams
Annie Williams | AnnieWilliamsSF@gmail.com | Fax: (415) 202-1686
AUGUST/SEPTEMBER 2013
Inside This Issue
> LOCAL MARKET TRENDS.....................1
> MORTGAGE RATE OUTLOOK ...............2
> HOME STATISTICS ..............................2
> FORECLOSURE STATS ........................3
> CONDO STATISTICS ............................3
> MOMENTUM CHARTS ..........................4
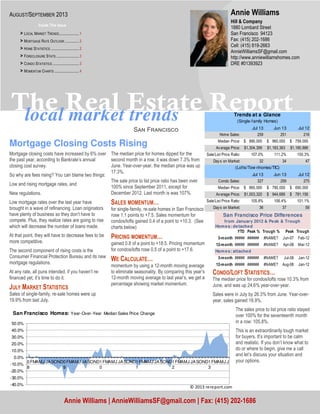
Jul 13 Jun 13 Jul 12
Home Sales: 259 251 216
Median Price: 890,000$ 960,000$ 759,000$
Average Price: 1,304,399$ 1,183,363$ 1,180,886$
Sale/List Price Ratio: 107.0% 111.2% 100.3%
Days on Market: 32 34 47
Jul 13 Jun 13 Jul 12
Condo Sales: 327 259 275
Median Price: 860,000$ 780,000$ 690,000$
Average Price: 1,003,320$ 944,689$ 781,156$
Sale/List Price Ratio: 105.8% 106.4% 101.1%
Days on Market: 36 37 59
(Lofts/Tow nhomes/TIC)
Trends at a Glance
(Single-family Homes)
Homes: detached
YTD Peak % Trough % Peak Trough
3-month ##### ###### #NAME? Jun-07 Feb-12
12-month ##### ###### #NAME? Apr-08 Mar-12
Homes: attached
3-month ##### ###### #NAME? Jul-08 Jan-12
12-month ##### ###### #NAME? Aug-08 Jan-12
San Francisco Price Differences
from January 2012 & Peak & Trough
-40.0%
-30.0%
-20.0%
-10.0%
0.0%
10.0%
20.0%
30.0%
40.0%
50.0%
0
8
FMAMJ JASOND0
9
FMAMJ JASOND1
0
FMAMJ JASOND1
1
FMAMJ JASOND1
2
FMAMJ JASOND1
3
FMAMJ J
San Francisco Homes: Year-Over-Year Median Sales Price Change
© 2013 rereport.com
- 2. Page 2
The Real Estate Report
The chart above shows the
National monthly average for
30-year fixed rate mortgages
as compiled by HSH.com. The
average includes mortgages of
all sizes, including conforming,
"expanded conforming," and
jumbo.
MORTGAGE RATE OUTLOOK
Aug 2, 2013 -- Although the Federal Reserve failed to tip
its hand about future plans for its Treasury and
Mortgage-Backed Security buying programs, new
suggestions about the strength of the economy
moved mortgage rates higher, regardless.
This continues a stretch of ambiguous economic
data. At times, stronger signals have come, only to
be offset by those exhibiting less strength. Even the
Fed itself doesn't have a clear grasp, as it seemed to
mark down its assessment of the economy's recent
pattern from "moderate" to only "modest."
HSH.com's broad-market mortgage tracker -- our
weekly Fixed-Rate Mortgage Indicator (FRMI) --
found that the overall average rate for 30-year fixed-
rate mortgages rose by four basis points (0.04%) to
4.59%, erasing all of last week's dip plus a little bit
more. The FRMI's 15-year companion also increased
by four basis points (0.04%), landing at 3.68% for the
week. FHA-backed 30-year FRMs firmed up by five
basis points, ticking up to 4.23%, while the overall 5/1
Hybrid ARM fell by just one one-hundredths of a
percentage point (0.01%) to an average 3.32%.
A bit of concern might be found in the report covering
construction spending for June. The 0.6% overall
decline wasn't particularly scary, as outlays for public
and commercial construction projects have been soft
at times this year. Rather, it was the turn to flatline for
spending on residential construction projects during
the month. Home construction has been a pretty
reliable support for the economy over the past year,
and the stall here does make us wonder if the rise in
rates, which began in earnest in June, is the
proximate cause of the lack of activity, and how much
down force it might end up exerting on the .
Mortgage rates are more likely to rise than fall. To
see us return to even a 4% level would require a
litany of very soft economic data, and that not
tempered by any kind of strength or a panic
somewhere else in the world which would see a flood
of cash looking for a safe haven. Nothing is
impossible, of course, but the likely course is that
pretty solid and stable growth gives the Fed a chance
to move closer to the exit and a process of slipping
out the door as quietly and quickly as they can.
All indications at the moment suggest that mortgage
rates are likely to be flat to slightly higher next week,
with an increase of perhaps a handful of basis points
at most. Between now and then, we'll be reading the
tea leaves and polishing the crystal ball as we work
on the next two-month forecast, due out next Friday.
0
50
100
150
200
250
300
350
$300
$500
$700
$900
$1,100
$1,300
$1,500
0
8
FMAMJ JASOND0
9
FMAMJ JASOND1
0
FMAMJ JASOND1
1
FMAMJ JASOND1
2
FMAMJ JASOND1
3
FMAMJ J
San Francisco Homes: Sold Prices & Unit Sales
(3-month moving average — $000's)
Ave Med Units © 2013 rereport.com
Unit
Median Average Sales DOM SP/LP Median Average Sales Median Average Sales
San Francisco #NAME? #NAME? ##### ##### ###### ####### #NAME? #NAME? ####### #NAME? #NAME?
D1: Northwest #NAME? #NAME? ##### ##### ###### ####### #NAME? #NAME? ####### #NAME? #NAME?
D2: Central West #NAME? #NAME? ##### ##### ###### ####### #NAME? #NAME? ####### #NAME? #NAME?
D3: Southwest #NAME? #NAME? ##### ##### ###### ####### #NAME? #NAME? ####### #NAME? #NAME?
D4: Twin Peaks #NAME? #NAME? ##### ##### ###### ####### #NAME? #NAME? ####### #NAME? #NAME?
D5: Central #NAME? #NAME? ##### ##### ###### ####### #NAME? #NAME? ####### #NAME? #NAME?
D6: Central North #NAME? #NAME? ##### ##### ###### ####### #NAME? #NAME? ####### #NAME? #NAME?
D7: North #NAME? #NAME? ##### ##### ###### ####### #NAME? #NAME? ####### #NAME? #NAME?
D8: Northeast #NAME? #NAME? ##### ##### ###### ####### #NAME? #NAME? ####### #NAME? #NAME?
D9: Central East #NAME? #NAME? ##### ##### ###### ####### #NAME? #NAME? ####### #NAME? #NAME?
D10: Southeast #NAME? #NAME? ##### ##### ###### ####### #NAME? #NAME? ####### #NAME? #NAME?
July Sales Statistics
(Single-family Homes)
Prices Yearly Change Monthly Change
3.0% 4.0% 5.0% 6.0% 7.0% 8.0%
01-06
04-06
07-06
10-06
01-07
04-07
07-07
10-07
01-08
04-08
07-08
10-08
01-09
04-09
07-09
10-09
01-10
04-10
07-10
10-10
01-11
04-11
07-11
10-11
01-12
04-12
07-12
10-12
01-13
04-13
30-Year Fixed Mortgage Rates
- 3. Table Definitions
_______________
Median Price
The price at which 50% of
prices were higher and
50%were lower.
Average Price
Add all prices and divide by the
number of sales.
SP/LP
Sales price to list price ratio or
the price paid for the property
divided by the asking price.
DOI
Days of Inventory, or how many
days it would take to sell all the
property for sale at the current
rate of sales.
Pend
Property under contract to sell
that hasn’t closed escrow.
Inven
Number of properties actively
for sale as of the last day of the
month.
There was one notice of default filed in San Francisco
in June! I expect that will be adjusted upward as it was
reported there were no notices of default filed in May,
but that was revised to 36 this month.
There was only one notice of sale filed in June. Again,
expect that to be revised upward.
After the filing of a Notice of Trustee Sale, there are
only three possible outcomes. First, the sale can be
cancelled for reasons that include a successful loan
modification or short sale, a filing error, or a legal
requirement to re-file the notice after extended
postponements.
Alternatively, if the property is taken to sale, the bank
will place the opening bid. If a third party, typically an
investor, bids more than the bank's opening bid, the
FORECLOSURE STATISTICS
property will be sold to the third party; if not, it will go
back to the bank.
There were 59 sales cancelled last month.
Only four homes went back to the bank in June There
was one in May, which was reported correctly.
There are currently 158 properties scheduled for sale.
With the recent surge in prices, many of them will
probably be cancelled.
The total number of properties owned by the banks was
down 40.2% year-over-year. The banks now own
approximately 325 properties in the city.
For further details and a city-by-city breakdown of
foreclosure statistics, go to http://foreclosureradar.com.
0
50
100
150
200
250
300
350
$300
$400
$500
$600
$700
$800
$900
$1,000
$1,100
0
8
FMAMJ JASOND0
9
FMAMJ JASOND1
0
FMAMJ JASOND1
1
FMAMJ JASOND1
2
FMAMJ JASOND1
3
FMAMJ J
San Francisco Condos: Sold Prices & Unit Sales
(3-month moving average — $000's)
Ave Med Units © 2013 rereport.com
-30.0%
-20.0%
-10.0%
0.0%
10.0%
20.0%
30.0%
40.0%
0
8
FMAMJ JASOND0
9
FMAMJ JASOND1
0
FMAMJ JASOND1
1
FMAMJ JASOND1
2
FMAMJ JASOND1
3
FMAMJ J
San Francisco Condos/Lofts: Year-Over-Year Median Sales Price Change
© 2013 rereport.com
Unit
Median Average Sales DOM SP/LP Median Average Sales Median Average Sales
San Francisco #NAME? #NAME? ##### ##### ###### ####### #NAME? #NAME? ####### #NAME? #NAME?
D1: Northwest #NAME? #NAME? ##### ##### ###### ####### #NAME? #NAME? ####### #NAME? #NAME?
D2: Central West #NAME? #NAME? ##### ##### ###### ####### #NAME? #NAME? ####### #NAME? #NAME?
D3: Southwest #NAME? #NAME? ##### ##### ###### ####### #NAME? #NAME? ####### #NAME? #NAME?
D4: Twin Peaks #NAME? #NAME? ##### ##### ###### ####### #NAME? #NAME? ####### #NAME? #NAME?
D5: Central #NAME? #NAME? ##### ##### ###### ####### #NAME? #NAME? ####### #NAME? #NAME?
D6: Central North #NAME? #NAME? ##### ##### ###### ####### #NAME? #NAME? ####### #NAME? #NAME?
D7: North #NAME? #NAME? ##### ##### ###### ####### #NAME? #NAME? ####### #NAME? #NAME?
D8: Northeast #NAME? #NAME? ##### ##### ###### ####### #NAME? #NAME? ####### #NAME? #NAME?
D9: Central East #NAME? #NAME? ##### ##### ###### ####### #NAME? #NAME? ####### #NAME? #NAME?
D10: Southeast #NAME? #NAME? ##### ##### ###### ####### #NAME? #NAME? ####### #NAME? #NAME?
July Sales Statistics
(Condos/TICs/Co-ops/Lofts)
Prices Yearly Change Monthly Change
- 4. The Real Estate Market Trends Report is published and copyrighted by http://rereport.com.
THE REAL ESTATE REPORT
San Francisco
Annie Williams
Hill & Company
1880 Lombard Street
San Francisco 94123
Go online to see the full report
with the district by district breakdown:
HTTP://WWW.ANNIEWILLIAMSHOMES.COM
-25.0
-20.0
-15.0
-10.0
-5.0
0.0
5.0
10.0
15.0
20.0
25.0
0
8
FMAMJ JASOND0
9
FMAMJ JASOND1
0
FMAMJ JASOND1
1
FMAMJ JASOND1
2
FMAMJ JASOND1
3
FMAMJ J
San Francisco Homes: Sales Momentum
Sales Pricing © 2013 rereport.com
-50.0
-40.0
-30.0
-20.0
-10.0
0.0
10.0
20.0
30.0
40.0
0
8
FMAMJ JASOND0
9
FMAMJ JASOND1
0
FMAMJ JASOND1
1
FMAMJ JASOND1
2
FMAMJ JASOND1
3
FMAMJ J
San Francisco Condos/Lofts: Sales Momentum
Sales Pricing © 2013 rereport.com