
Recommandé
Recommandé
Contenu connexe
En vedette
Similaire à GUI
Similaire à GUI (20)
GUI
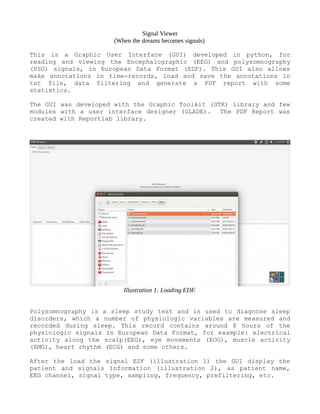
- 1. Signal Viewer (When the dreams becomes signals) This is a Graphic User Interface (GUI) developed in python, for reading and viewing the Encephalographic (EEG) and polysomnography (PSG) signals, in European Data Format (EDF). This GUI also allows make annotations in time-records, load and save the annotations in txt file, data filtering and generate a PDF report with some statistics. The GUI was developed with the Graphic Toolkit (GTK) library and few modules with a user interface designer (GLADE). The PDF Report was created with Reportlab library. Polysomnography is a sleep study test and is used to diagnose sleep disorders, which a number of physiologic variables are measured and recorded during sleep. This record contains around 8 hours of the physiologic signals in European Data Format, for example: electrical activity along the scalp(EEG), eye movements (EOG), muscle activity (EMG), heart rhythm (ECG) and some others. After the load the signal EDF (illustration 1) the GUI display the patient and signals Information (illustration 2), as patient name, EEG channel, signal type, sampling, frequency, prefiltering, etc. Illustration 1: Loading EDF.
- 2. Illustration 2: EDF Information loaded Illustration 4: Signals Display
- 3. In the illustration 4, the GUI displays the selected polysomnography signals by the combo-boxes, also it can change the signal amplitude and the time window size viewing. The GUI allow read, load, add and delete the duration of basic medical annotations, as dream states, cyclic alternate patterns subtypes and some activity autonomic. The illustration 5, show a extra window for filter design, the filter can be applied for any selected signal by the combo-box. For this develops Numpy and Matplotlib python libraries was used. The GUI generate a PDF report (illustration 6, 7) with some statistics: • Distribution of events by sleep states . • Distribution of events by sleep states in time. Illustration 5: Signal Filtering.
- 4. Illustration 6: PDF Report Generate
- 5. Illustration 7: PDF Report Generate