Contenu connexe
Similaire à Daily livestock report apr 16 2013
Similaire à Daily livestock report apr 16 2013 (20)
Plus de joseleorcasita (20)
Daily livestock report apr 16 2013
- 1. Vol. 11, No. 71 / April 16, 2013
Sponsored by
The Daily Livestock Report is published by Steve Meyer & Len Steiner, Inc., Adel, IA and Merrimack, NH. To subscribe, support or unsubscribe visit www.dailylivestockreport.com. Copyright © 2013
Steve Meyer and Len Steiner, Inc. All rights reserved.
The Daily Livestock Report is not owned, controlled, endorsed or sold by CME Group Inc. or its affiliates and CME Group Inc. and its affiliates disclaim any and all responsibility for the informa on
contained herein. CME Group®
, CME®
and the Globe logo are trademarks of Chicago Mercan le Exchange, Inc.
Disclaimer: The Daily Livestock Report is intended solely for informa on purposes and is not to be construed, under any circumstances, by implica on or otherwise, as an offer to sell or a solicita‐
on to buy or trade any commodi es or securi es whatsoever. Informa on is obtained from sources believed to be reliable, but is in no way guaranteed. No guarantee of any kind is implied or
possible where projec ons of future condi ons are a empted. Futures trading is not suitable for all investors, and involves the risk of loss. Past results are no indica on of future performance.
Futures are a leveraged investment, and because only a percentage of a contract’s value is require to trade, it is possible to lose more than the amount of money ini ally deposited for a futures
posi on. Therefore, traders should only use funds that they can afford to lose without affec ng their lifestyle. And only a por on of those funds should be devoted to any one trade because a
trader cannot expect to profit on every trade.
The Daily Livestock Report is made possible with support from readers like you. If you enjoy this report, find if valuable
and would like to sustain it going forward, consider becoming a contributor. Just go to www.DailyLivestockReport.com to
contribute by credit card or send your check to The Daily Livestock Report, P.O. Box 2, Adel, IA 50003.
To say we are “off and running” with this year’s corn
planting would be somewhat of an overstatement, we think. May-
be “off and stumbling” would be a better description. That is our-
take of the first planting progress numbers from USDA’s weekly Crop
Progress report that was released on Monday. Yes, it is very early in
the process but for a year in which every kernel is going to be counted
carefully, this is not the kind of beginning we had hoped for. That state-
ment has nothing to do with the people involved — unless of course one
includes Mother Nature in that group.
First, let’s remember that any planting progress number this
year is going to pale in comparison to those of one year ago. The 16%
of acres planted by mid-April 2012 was record high. The only year that
gets close to that figure was in 2005 when 14% of the acres were plant-
ed by week 16 — the week number that corresponds to this week.
Second, having only 2% of the acres planted by week 16 is in
no way a death knell for corn yields. That was the same figure for plant-
ing progress as at this time in 2008 and 2009. The 2008 national aver-
age yield of 153.9 bushels per acre was 3 bushels above the 1960-
2010 trend line yield and just 0.5 bushels below the 1996-2010 “biotech
years” trend yield of 154.4. 2009, of course is the year of the reigning
record-high national average yield of 164.7 bushels per acre.
Bottom line: Things can still turn out very good — or very bad.
It is indeed a long, long while until the combines roll this fall!
But Monday’s numbers were lower than the 6% expected by
analysts and the 7% average for 2008-2012. Texas corn planting was
right on its 5-year average of 56%. Of the other states that indicated
acres have been planted, only Pennsylvania got within 1% of its 5-year
average. The mid-South states that a) had indicated intentions to plant
significantly more corn acres and b) we and others had hoped would
raise large crops that would help get corn users through to the end of
this crop year are lagging their normal paces rather badly. Tennessee
had planted only 11% of its acres (5-yr average of 27%) as of Monday.
Only 7% of Kentucky acres (5-yr average of 18%) were in the ground.
The same is true for Kansas (3% planted vs. 10% 5-yr average) and
Missouri (8% vs. 17%).
One positive note for feed supplies is that grain sorghum plant-
ing (24%) is slightly ahead of both last year (22%) and the 5-yr average
(22%). Winter wheat condition was steady for the week but remains
poor relative to last year with only 36% (vs. 64% in 2012) of the acres
rated as good or excellent and 31% (vs. 11% in 2012) rated as poor or
very poor. Summer wheat supplies are not likely, at this point, to be
much help in “getting to” the new corn crop.
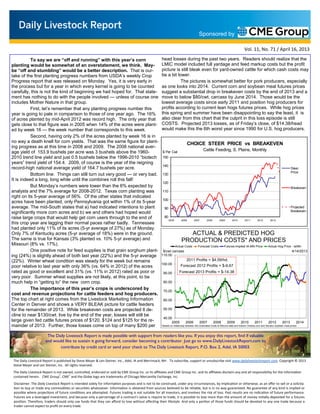
The importance of this year’s crops is underscored by
cost and revenue projections for cattle feeders and hog producers.
The top chart at right comes from the Livestock Marketing Information
Center in Denver and shows a VERY BLEAK picture for cattle feeders
for the remainder of 2013. While breakeven costs are projected tl de-
cline to near $130/cwt. live by the end of the year, losses will still be
large given fed cattle futures prices of $120, $124 and $125 for the re-
mainder of 2013. Further, those losses come on top of many $200 per
head losses during the past two years. Readers should realize that the
LMIC model included full yardage and feed markup costs but the profit
picture is still bleak even for yard-owned cattle for which cash costs may
be a bit lower.
The pictures is somewhat better for pork producers, especially
as one looks into 2014. Current corn and soybean meal futures prices
suggest a substantial drop in breakeven costs by the end of 2013 and a
move to below $80/cwt. carcass by June 2014. Those would be the
lowest average costs since early 2011 and position hog producers for
profits according to current lean hogs futures prices. While hog prices
this spring and summer have been disappointing to say the least, it is
also clear from this chart that the culprit in this loss episode is still
COSTS. Projected 2013 losses, as of Friday’s close, of $14.38/head
would make this the 6th worst year since 1990 for U.S. hog producers.
CHOICE STEER PRICE vs BREAKEVEN
Cattle Feeding, S. Plains, Monthly
80
90
100
110
120
130
140
150
2005 2006 2007 2008 2009 2010 2011 2012 2013
$ Per Cwt
Steer
Price
Breakeven
Projected
Breakeven
40.00
50.00
60.00
70.00
80.00
90.00
100.00
110.00
2005 2006 2007 2008 2009 2010 2011 2012 2013 2014
$/cwt carcass
ACTUAL & PREDICTED HOG
PRODUCTION COSTS* AND PRICES
Actual Costs Forecast Costs Futures-Implied IA-MN Price Actual Hog Price - Ia/Mn
*Based on relationsip between ISU Estimated Costs & Returns data and historic Omaha corn and Decatur soybean meal prices
4/14/2013
2011 Profits = $4.59/hd.
Forecast 2012 Profits = $-9.67
Forecast 2013 Profits = $-14.38