4. Physical Properties of the Sun Interior structure of the Sun: Outer layers are not to scale. The core is where nuclear fusion takes place.
5. Physical Properties of the Sun Luminosity – total energy radiated by the Sun – can be calculated from the fraction of that energy that reaches Earth. Solar constant – amount of Sun's energy reaching Earth – is 1400 W/m 2 . Total luminosity is about 4 × 10 26 W – the equivalent of 10 billion 1-megaton nuclear bombs per second.
6. Physical Properties of the Sun This diagram illustrates how one can extrapolate from the radiation hitting Earth to the entire output of the Sun.
7. The Heart of the Sun Given the Sun’s mass and energy production, we find that, on the average, every kg of the sun produces about 0.2 milliwatts of energy. This is not much – gerbils could do better – but it continues through the 10-billion-year lifetime of the Sun. We find that the total lifetime energy output is about 3 × 10 13 J/kg . This is a lot, and it is produced steadily, not explosively. How?
8. The Heart of the Sun Nuclear fusion is the energy source for the Sun. In general, nuclear fusion works like this: nucleus 1 + nucleus 2 -> nucleus 3 + energy 1 2 3 + Energy!
9. The Heart of the Sun Nuclear fusion requires that like-charged nuclei get close enough to each other to fuse. This can happen only if the temperature is extremely high – over 10 million K.
10. The Heart of the Sun This is the first step in a three-step fusion process that powers most stars.
11. The Heart of the Sun The helium stays in the core; The energy is in the form of gamma rays , which gradually lose their energy as they travel out from the core, emerging as visible light; The previous image depicts proton–proton fusion. In this reaction:
12. But where does the energy come from? It comes from the mass : if you add up the masses of the initial nuclei, you will find that it is more than the mass of the final nucleus. Hydrogen mass: 1.00784 amu x 4 4.03136 amu Helium mass: 4.00260 amu Difference: 0.02876 amu
13. But where does the energy come from? It comes from the mass : if you add up the masses of the initial nuclei, you will find that it is more than the mass of the final nucleus. Hydrogen mass: 1.00784 amu x 4 4.03136 amu Helium mass: 4.00260 amu Difference: 0.02876 amu H H H H He + Energy!
14. But where does the energy come from? The relationship between mass and energy comes from Einstein’s famous equation: E = mc 2 In this equation, c is the speed of light, which is a very large number. Bite me! It works!
15. The Heart of the Sun What this equation is telling us is that a small amount of mass is the equivalent of a large amount of energy – tapping into that energy is how the Sun keeps shining so long. The Sun must convert 4.3 million tons of matter into energy every second. The Sun has enough hydrogen left to continue fusion for about another 5 billion years .
16. The Solar Interior Mathematical models , consistent with observation and physical principles, provide information about the Sun’s interior. In equilibrium , inward gravitational force must be balanced by outward pressure :
17. The Solar Interior Doppler shifts of solar spectral lines indicate a complex pattern of vibrations :
18. The Solar Interior Solar density and temperature , according to the standard solar model:
19. The Solar Interior Energy transport The radiation zone is relatively transparent; the cooler convection zone is opaque:
20. The Solar Interior The visible top layer of the convection zone is granulated , with areas of upwelling material surrounded by areas of sinking material:
21. The Solar Atmosphere Spectral analysis can tell us what elements are present, but only in the chromosphere and photosphere:
23. The Solar Atmosphere The cooler chromosphere is above the photosphere Difficult to see directly, as photosphere is too bright, unless Moon covers photosphere and not chromosphere during eclipse :
31. The Active Sun Sunspots come and go, typically in a few days. Sunspots are linked by pairs of magnetic field lines :
32. The Active Sun The Sun has an 11-year sunspot cycle , during which sunspot numbers rise, fall, and then rise again:
33. The Active Sun This is really a 22-year cycle, because the spots switch polarities between the northern and southern hemispheres every 11 years. Maunder minimum : few, if any, sunspots:
37. The Active Sun Solar flare is a large explosion on Sun’s surface, emitting a similar amount of energy to a prominence, but in seconds or minutes rather than days or weeks:
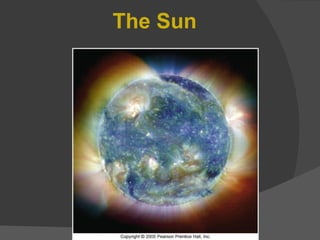
The Sun is our star. It is not merely the center of the solar system or the source of light that distinguishes day from night; it is also the main source of energy that powers weather, climate, and life on Earth. Humans simply would not exist without the Sun. Although we take it for granted each and every day, the Sun is of great importance to us in the cosmic scheme of things. Here, in this composite ultraviolet image made from several observations with the SOHO spacecraft, many active features are revealed on and around the Sun's surface; the various colors are artificial, indicating different wavelengths. (ESA/NASA)
The inner part of this composite, filtered image of the Sun shows a sharp solar limb, although our star, like all stars, is made of a gradually thinning gas. The edge appears sharp because the solar photosphere is so thin. The outer portion of the image is the solar corona, normally too faint to be seen, but visible during an eclipse, when the light from the solar disk is blotted out. Note the blemishes—they are sunspots. (See Sec. 2.4) (NOAO)
The main regions of the Sun, not drawn to scale, with some physical dimensions labeled. The photosphere is the visible "surface" of the Sun. Below it lie the convection zone, the radiation zone, and the core. Above the photosphere, the solar atmosphere consists of the chromosphere, the transition zone, and the corona.
We can draw an imaginary sphere around the Sun so that the sphere's edge passes through Earth's center. The radius of this imaginary sphere equals 1 A.U. The "solar constant" is the amount of power striking a 1-m 2 detector at Earth's distance, as suggested by the inset. By multiplying the sphere's surface area by the solar constant, we can measure the Sun's luminosity—the amount of energy it emits each second.
Since like charges repel, two low-speed protons veer away from one another, never coming close enough for fusion to occur. (b) Sufficiently high-speed protons may succeed in overcoming their mutual repulsion, approaching close enough for the strong force to bind them together—in which case they collide violently, initiating the chain of nuclear fusion that powers the Sun.
A total of six protons (and two electrons) are converted into two protons, one helium-4 nucleus, and two neutrinos. The two leftover protons are available as fuel for new proton-proton reactions, so the net effect is that four protons are fused to form one helium-4 nucleus. Energy, in the form of gamma rays, is produced in each reaction. The fusion events shown at the left, center, and right correspond to reactions (I), (II), and (III), respectively, in the text.
In the interior of a star such as the Sun, the outward pressure of hot gas exactly balances the inward pull of gravity. This is true at every point within the star, guaranteeing its stability. In the interior of a star such as the Sun, the outward pressure of hot gas exactly balances the inward pull of gravity. This is true at every point within the star, guaranteeing its stability.
The Sun has been found to vibrate in a complex way. By observing the motion of the solar surface, scientists can determine the wavelengths and the frequencies of the individual waves and deduce information about the Sun that is not obtainable by other means. The alternating patches represent gas moving down (red) and up (blue). (See also Discovery 16-1.) (b) Depending on their initial directions, the waves contributing to the observed oscillations may travel deep inside the Sun, providing vital information about the solar interior. The wave shown closest to the surface here corresponds approximately to the vibration pattern depicted in part (a). (National Solar Observatory)
(a) A cross section of the Sun, with corresponding graphs of (b) density and (c) temperature, according to the standard solar model.
Physical transport of energy in the Sun's convection zone. We can visualize the upper interior as a boiling, seething sea of gas. Near the surface, each convective cell is about 1000 km across. The sizes of the convective cells become progressively larger at greater depths, reaching some 30,000 km in diameter at the base of the convection zone, 200,000 km below the photosphere. (This is a highly simplified diagram; there are many different cell sizes, and they are not so neatly arranged.)
Photograph of the granulated solar photosphere, taken from the Skylab space station looking directly down on the Sun's surface. Typical solar granules are comparable in size to a large U.S. state. The bright portions of the image are regions where hot material is upwelling from below. The dark regions correspond to cooler gas that is sinking back down into the interior. The inset shows a perpendicular cut through the solar surface. (Big Bear Solar Observatory)
Photons with energies well away from any atomic transition can escape from relatively deep in the photosphere, but those with energies close to a transition are more likely to be reabsorbed before escaping, so those we see on Earth tend to come from higher, cooler levels in the solar atmosphere. The dashed lines indicate schematically the levels in the atmosphere where photons corresponding to different parts of the absorption line originate. The inset shows a close-up tracing of two of the thousands of solar absorption lines: the "H" and "K" lines of calcium at about 395 nm.
A detailed visible spectrum of our Sun shows thousands of dark Fraunhofer spectral lines indicating the presence of some 67 different elements in various stages of excitation and ionization in the lower solar atmosphere. The numbers give wavelengths, in nanometers. (Palomar Observatory/Caltech)
This photograph of a total solar eclipse shows the solar chromosphere, a few thousand kilometers above the Sun’s surface. (G. Schneider)
Short-lived narrow jets of gas that typically last mere minutes, spicules can be seen sprouting up from the solar chromosphere in this image of the Sun. The spicules are the thin, dark, spikelike regions. They appear dark against the face of the Sun because they are cooler than the solar photosphere. (NOAO)
When both the photosphere and the chromosphere are obscured by the Moon during a solar eclipse, the faint corona becomes visible. This photograph clearly shows the emission of radiation from the relatively inactive solar corona. (Bencho Angelov)
The change of gas temperature in the lower solar atmosphere is dramatic. The temperature reaches a minimum of 4500 K in the chromosphere and then rises sharply in the transition zone, finally leveling off at around 3 million K in the corona.
This photograph of the entire Sun, taken during a period of maximum solar activity, shows several groups of sunspots. The largest spots in the image are more than 20,000 km across—nearly twice the diameter of Earth. Typical sunspots are only about half that size. (Palomar Observatory/Caltech)
An enlarged photograph of the largest pair of sunspots in Figure 16.17. Each spot consists of a cool, dark inner region called the umbra, surrounded by a warmer, brighter region called the penumbra. The spots appear dark because they are slightly cooler than the surrounding photosphere. (b) A high-resolution image of a single sunspot shows details of its structure as well as the surface granules surrounding it. This spot is about the size of Earth. (Palomar Observatory/Caltech; National Solar Observatory)
The evolution of some sunspots and lower chromospheric activity over a period of 12 days. The sequence runs from left to right. An Hα filter was used to make these photographs, taken from the Skylab space station in 1975. An arrow follows one set of sunspots over the course of a week as they are carried around the Sun by its rotation. (NASA)
The evolution of some sunspots and lower chromospheric activity over a period of 12 days. The sequence runs from left to right. An Hα filter was used to make these photographs, taken from the Skylab space station in 1975. An arrow follows one set of sunspots over the course of a week as they are carried around the Sun by its rotation. (NASA)
Sunspot pairs are linked by magnetic field lines. The Sun's magnetic field lines emerge from the surface through one member of a pair and reenter the Sun through the other member. The leading members of all sunspot pairs in the solar northern hemisphere have the same polarity (labeled N or S, as described in the text). If the magnetic field lines are directed into the Sun in one leading spot, they are inwardly directed in all other leading spots in that hemisphere. The same is true in the southern hemisphere, except that the polarities are always opposite those in the north. The overall direction of the magnetic field reverses itself roughly every 11 years. (b) A far-ultraviolet image taken by NASA's Transition Region and Coronal Explorer ( TRACE ) satellite in 1999, showing magnetic field lines arching between two sunspot groups. Note the complex structure of the lines, which are seen here via the radiation emitted by superheated gas flowing along them. The resolution is about 700 km. In this negative image (which shows the lines more clearly), the darkest regions have temperatures of about 2 million K. (NASA)
The Sun's differential rotation wraps and distorts the solar magnetic field. Occasionally, the field lines burst out of the surface and loop through the lower atmosphere, thereby creating a sunspot pair. The underlying pattern of the solar field lines explains the observed pattern of sunspot polarities. If the loop happens to occur on the limb of the Sun and is seen against the blackness of space, we see a phenomenon called a prominence, described in Section 16.5.
This particularly large solar prominence was observed by ultraviolet detectors aboard the SOHO spacecraft in June 2002. (b) Like a phoenix rising from the solar surface, this filament of hot gas measures more than 100,000 km in length. Earth could easily fit between its outstretched "arms." Dark regions in this TRACE image have temperatures less than 20,000 K; the brightest regions are about 1 million K. The ionized gas follows the solar magnetic field lines away from the Sun. Most of the gas will subsequently cool and fall back into the photosphere. (NASA)
Much more violent than a prominence, a solar flare is an explosion on the Sun's surface that sweeps across an active region in a matter of minutes, accelerating solar material to high speeds and blasting it into space. (b) A flare occurs when hot gas breaks free of the magnetic field confining it and bursts into space. This composite image shows a dark sunspot group (captured in visible light), the surrounding solar photosphere (in the ultraviolet, shown in red here) and a collection of magnetic loops (extreme ultraviolet, colored green here) confining million-degree gas a few minutes before a major flare in June 2000. (USAF; NASA)
A few times per week, on average, a giant magnetized "bubble" of solar material detaches itself from the Sun and escapes rapidly into space, as shown in this SOHO image taken in 2002. (The Sun itself was intentionally blocked by the disk at the center.) Should such a coronal mass ejection encounter Earth, it could severely disrupt our planet's magnetosphere. (NASA/ESA)
Images of X-ray emission from the Sun observed by the Yohkoh satellite. These frames were taken at roughly two-day intervals, starting at the top. Note the dark, V-shaped coronal hole traveling from left to right, where the X-ray observations outline in dramatic detail the abnormally thin regions through which the high-speed solar wind streams forth. (Lockheed Martin) Charged particles follow magnetic field lines that compete with gravity. When the field is trapped and loops back toward the photosphere, the particles are also trapped; otherwise, they can escape as part of the solar wind.