
Recommandé
Contenu connexe
En vedette
En vedette (18)
Plus de Julie Pal
Plus de Julie Pal (20)
Life Expectancy At Birth By Gender and by Electoral Ward For Barnet
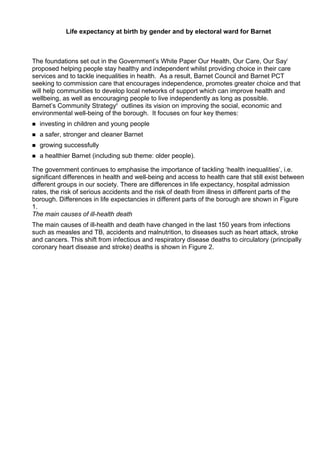
- 1. Life expectancy at birth by gender and by electoral ward for Barnet The foundations set out in the Government’s White Paper Our Health, Our Care, Our Sayi proposed helping people stay healthy and independent whilst providing choice in their care services and to tackle inequalities in health. As a result, Barnet Council and Barnet PCT seeking to commission care that encourages independence, promotes greater choice and that will help communities to develop local networks of support which can improve health and wellbeing, as well as encouraging people to live independently as long as possible. Barnet’s Community Strategyii outlines its vision on improving the social, economic and environmental well-being of the borough. It focuses on four key themes: investing in children and young people a safer, stronger and cleaner Barnet growing successfully a healthier Barnet (including sub theme: older people). The government continues to emphasise the importance of tackling ‘health inequalities’, i.e. significant differences in health and well-being and access to health care that still exist between different groups in our society. There are differences in life expectancy, hospital admission rates, the risk of serious accidents and the risk of death from illness in different parts of the borough. Differences in life expectancies in different parts of the borough are shown in Figure 1. The main causes of ill-health death The main causes of ill-health and death have changed in the last 150 years from infections such as measles and TB, accidents and malnutrition, to diseases such as heart attack, stroke and cancers. This shift from infectious and respiratory disease deaths to circulatory (principally coronary heart disease and stroke) deaths is shown in Figure 2.
- 2. Figure 1: Life expectancy at birth by gender and by electoral ward for Barnet Index of Multiple Deprivation (2007) Very high 83.1 High High Barnet 82.1 Moderate East Low 76.7 Barnet 81.5 77.3 Oakley Very low 79.4 Underhill 82.6 83.3 83.3 Edgware 82.9 Totteridge Brunswick 78.2 Park 79.7 83.1 81.5 Hale Mill Hill 78.9 84.3 79.7 Coppetts 78.8 West Woodhouse 79.0 Finchley Burnt 76.0 81.4 Oak Finchley East 81.0 Church Finchley 75.7 Colindale 83.4 End 82.5 79.3 77.6 Hendon 75.6 Garden West Suburb 82.0 Hendon 83.8 Golders 76.0 82.7 Green 77.7 Childs 85.2 Hill 77.8 81.0 82.7 81.4 78.7 84.7 76.5 81.4 Source: London Health Observatory
- 3. Figure 2: Age-standardised mortality rates for selected broad disease groups, 1911-2003, England & Wales 800 Age-standardised deaths per 100,000 600 circulatory diseases 400 respiratory disease cancers 200 infections 0 1911 1921 1931 1941 1951 1961 1971 1981 1991 2003 iii Source: Office for National Statistics These changes principally come about because of the widespread availability of a clean drinking water supply, the introduction of universal childhood immunisation, better housing and better food. But this has led to diseases related to lifestyle becoming more common. Many years ago, a doctor called Elliot Joslin said, “Genes load the gun, but it’s lifestyle that pulls the trigger”. In other words, many of us may have a genetic predisposition to certain diseases, but how we choose to live our lives will influence whether we develop those diseases or not and, if we do, how severely they will affect us. This is most apparent with smoking, which is the most important preventable risk factor for death from cancer and cardiovascular disease.iv,v (It is also important to remember that, in addition to the unequivocal evidence that smoking damages the smoker’s health, there is also substantial evidence that exposure to second-hand tobacco smoke (e.g. smoke from other people’s cigarettes) harms non-smokers.vi,vii,viii,ix,x ) A further example of the way in which our own lifestyle can affect our health is overweight and obesity. In 2004, a House of Commons select committee noted that ‘On present trends, obesity will soon surpass smoking as the greatest cause of premature loss of life. It will bring levels of sickness that will put enormous strains on the health service, perhaps even making a publicly funded health service unsustainable.’xi Overweight and obesity increases the risk of developing diabetes and high blood pressure (itself a risk factor for stroke). Overweight and obesity increases the risk of developing arthritis, especially of the hip and knee. And obesity, a high fat diet and inactivity have also been shown to increase the risk of breast cancer.xii,xiii shows the ‘relative risk’ (i.e. how much more (or less) something is likely to occur) of developing different diseases in people who are obese. For example, Table 1 shows that an obese woman is nearly 13 times as likely to develop diabetes
- 4. as one who is not obese, and an obese man is three times as likely to develop bowel cancer as one who is not obese. Table 1: Relative risks of health problems associated with obesity in women and men Disease Relative risk (women) Relative risk (men) Non-insulin 12.7 5.2 dependent diabetes High blood pressure 4.2 2.8 Heart attack 3.2 1.5 Cancer of the bowel 2.7 3.0 Angina 1.8 1.8 Gallbladder disease 1.8 1.8 Cancer of the ovary 1.7 N/A Osteoarthritis 1.4 1.9 Stroke 1.4 1.3 xiv Source National Audit Office Another example of lifestyle issues affecting health is the misuse of alcohol. In addition to alcoholic liver disease, alcohol misuse can cause a variety of health and other problems. For example, driving under the influence of alcohol substantially increases the risk of having an accident. Excessive alcohol intake is associated with antisocial behaviour and street violence, as well as domestic violence. Alcohol is implicated in 78% of assaults and 88% of criminal damage.xv Excessive alcohol intake also affects people’s ability to work and, when it becomes a significant problem, this can often lead to job loss.xv
- 5. i Department of Health 2006 – Our Health; Our Care; Our Say ii London Borough of Barnet April 2008 – Barnet- A Sustainable Community Strategy for Barnet 2008 - 2018 iii http://www.statistics.gov.uk/CCI/nugget.asp?ID=1337&Pos=6&ColRank=2&Rank=352 (accessed 14 October 2008) iv Bartecchi CE, MacKenzie TD, Schrier R. The human costs of tobacco use (I).New NEJM 1994;330:907-12 v Doll R, Peto R, Wheatley K, Gray R, Sutherland I. Mortality in relation to smoking: 40 years' observations on male British doctors.Br Med J 1994;309:901-911 vi Eriksen MP, Gottlieb NH. A review of the health impact of smoking control at the workplace. Am J Hlth Prom 1998;13:83-104 vii Hackshaw AK, Law MR, Wald NJ. The accumulated evidence on lung cancer and environmental tobacco smoke. Br Med J 1997;315:980-988 viii Zaridze DG, Peto R, (eds). IARC Scientific Publications No. 74. International Agency for Research on Cancer. Lyon, 1986 ix Morris PD. Lifetime excess risk of death from lung cancer for a U. S. Female never-smoker exposed to environmental tobacco smoke. Environmental Research 1995;68:3-9 x Siegel MS. Involuntary smoking in the restaurant workplace. JAMA 1993;270(4):490-493 xi House of Commons Health Committee. Obesity. Third Report of Session 2003-04. London: The Stationery Office. 2004 xii McPherson K, Steel CM, Dixon JM. Breast cancer – epidemiology, risk factors and genetics. Br Med J 2000; 321: 624-8 xiii Hunter DJ and Willett WC: Diet, body size, and breast cancer. Epidemiol Rev 15:110-132, 1993. xiv National Audit Office. Tackling Obesity in England. National Audit Office, London. 2001 xv London Health Commission. Towards a London alcohol and drugs strategy – proposals for the mayor. London Health Commission. London, 2001