SlideShare une entreprise Scribd logo
1  sur  11
ESTADISTICAS MUNDIALES DEL INTERNET (Usuarios del Internet y Población por Países y Regiones) ESTADISTICAS MUNDIALES DEL INTERNET Y DE LA POBLACION Regiones Población ( 2008 Est.) % Población Mundial Usuarios, dato más reciente % Población (Penetración) Crecimiento ( 2000-2008 ) % Uso Mundial Africa 955,206,348 14.3 % 54,374,130 5.7 % 1,104.5 % 3.6 % Asia 3,776,181,949 56.6 % 601,354,674 15.9 % 4260.1 % 40.0 % Europa 800,401,065 12.0 % 390,499,251 48.8 % 271.6 % 26.0 % Oriente Medio 197,090,443 3.0 % 43,317,200 22.0 % 1,218.7 % 2.9 % Norte America 337,167,248 5.1 % 249,367,592 74.0 % 130.7 % 16.6 % Latinoamerica / Caribe 576,091,673 8.6 % 144,910,351 25.2 % 702.0 % 9.6 % Oceania / Australia 33,981,562 0.5 % 20,204,306 59.5 % 165.1 % 1.3 % TOTAL MUNDIAL 6,676,120,288 100.0 % 1,504,027,504 22.5 % 316.6 % 100.0 %
LOS 10 PAISES LIDERES EN EL INTERNET CON MAYOR NUMERO DE USUARIOS # Pais o Region Usuarios, dato más reciente Population ( 2008 Est. ) % Poblacion (Penetracion ) Fecha dato mas reciente (%) de Usuarios 1 China 253,000,000 1,330,044,605 19.0 % CNNIC June/08 16.8 % 2 Estados Unidos 221,267,592 303,824,646 72.8 % NN//R - Sept./08 14.7 % 3 Japon 94,000,000 127,288,419 73.8 % ITU - Mar./08 6.2 % 4 India 81,000,000 1,147,995,898 7.1 % ITU - Sept./07 5.4 % 5 Alemania 54,029,090 82,369,548 65.6 % N//NR Sept./08 3.6 % 6 Brasil 53,140,000 191,908,598 27.7 % ITU - Nov./08 3.5 % 7 Reino Unido 41,913,401 60,943,912 68.8 % N//NR Sept./08 2.8 % 8 Francia  39,182,645 62,177,676 63.0 % N//NR - Sept./08 2.6 % 9 Corea del Sur 35,590,000 49,232,844 72.3 % ITU Sept./08 2.4 % 10 Italia 35,534,845 58,145,321 61.1 % N//NR Sept./08 2.4 % Los 10 Paises Lideres 908,657,573 3,413,931,467 26.6 % IWS - Sept.30/08 60.4 % Resto del Mundo 595,369,931 3,262,188,821 18.3 % IWS - Sept.30/08 39.6 % Total Mundial Usuarios 1,504,027,504 6,676,120,288 22.5 % IWS - Sept.30/08 100.0 % .
LOS 10 PAISES LIDERES CON LA MAS ALTA TASA DE PENETRACION  DEL INTERNET # PAIS o REGION Penetración (% población) Usuarios, Dato Mas Reciente Población ( 2008 Est.) Fuente del Dato mas Reciente 1 Groenlandia 92.3 % 52,000 56,326 ITU - Mar./08 2 Paises Bajos 90.1 % 15,000,000 16,645,313 ITU - Mar./08 3 Noruega 87.7 % 4,074,100 4,644,457 ITU - Ago./07 4 Antigua and Barbuda 85.9 % 60,000 69,842 ITU - Mar./08 5 Islandia 84.8 % 258,000 304,367 ITU - Sept./06 6 Canada 84.3 % 28,000,000 33,212,696 ITU - Mar./08 7 Nueva Zelandia 80.5 % 3,360,000 4,173,460 ITU - Mar./08 8 Australia 79.4 % 16,355,402 20,600,856 N//NR - Sept./08 9 Suecia 77.4 % 7,000,000 9,045,389 ITU Mar./08 10 Falkland Islands 76.5 % 1,900 2,483 CIA - Dic./02 10 Paises Lideres 83.6 % 74,161,402 88,755,189 IWS - Sept.30/08 Resto del Mundo 21.7 % 1,429,866,102 6,587,365,099 IWS - Sept.30/08 Total Mundial Usuarios 22.5 % 1,504,027,504 6,676,120,288 IWS - Sept.30/08
LOS 20 PAISES LIDERES EN EL MUNDO  CON MAYOR NUMERO DE USUARIOS # País o Región Usuarios, Ultimo Dato Población ( 2007 Est. ) Penetración Internet Fuente de la estadística % Mundial Usuarios 1 Estados Unidos 210,080,067 301,967,681 69.6 % Nielsen//NR Nov/06 19.2 % 2 China 132,000,000 1,317,431,495 10.0 % CNNIC Dec/06 12.1 % 3 Japon 86,300,000 128,646,345 67.1 % eTForecasts Dec/05 7.9 % 4 Alemania 50,616,207 82,509,367 61.3 % Nielsen//NR Aug/06 4.6 % 5 India 40,000,000 1,129,667,528 3.5 % IWS Nov/06 3.7 % 6 Reino Unido 37,600,000 60,363,602 62.3 % ITU Sept/06 3.4 % 7 Corea del Sur 33,900,000 51,300,989 66.1 % eTForecast Dec/05 3.1 % 8 Francia 30,837,592 61,350,009 50.3 % Nielsen//NR Nov/06 2.8 % 9 Italia 30,763,848 59,546,696 51.7 % Nielsen//NR Oct/06 2.8 % 10 Brasil 25,900,000 186,771,161 13.9 % eTForcasts Dec/05 2.4 % 11 Rusia 23,700,000 143,406,042 16.5 % eTForcasts Dec/05 2.2 % 12 Canada 21,900,000 32,440,970 67.5 % eTForcasts Dec/05 2.0 % 13 Mexico 20,200,000 106,457,446 19.0 % AMIPCI Oct/06 1.8 % 14 España 19,204,771 45,003,663 42.7 % Nielsen//NR Oct/06 1.8 % 15 Indonesia 18,000,000 224,481,720 8.0 % eTForcasts Dec/05 1.6 % 16 Turquia 16,000,000 75,863,600 21.1 % ITU Sept/06 1.5 % 17 Australia 14,729,209 20,984,595 70.2 % Nielsen//NR Nov/06 1.3 % 18 Vietnam 14,509,075 85,031,436 17.1 % VNNIC Dec/06 1.3 % 19 Taiwan 13,800,000 23,001,442 60.0 % CIA Mar/05 1.3 % 20 Argentina 13,000,000 38,237,770 34.0 % Indec Sept/06 1.2 % 20 Paises Lideres 853,040,769 4,174,463,557 20.4 % IWS - Jan. 11/07 78.0 % Resto del Mundo 240,488,923 2,400,202,860 10.0 % IWS - Jan. 11/07 22.0 % Total Mundial 1,093,529,692 6,574,666,417 16.6 % IWS - Jan. 11/06 100.0 %
COMPARACIÓN DEL ECUADOR CON EL  MUNDO Nuestro país tiene un nivel muy bajo de penetración tan solo con 180.000 usuarios en el 2005 que da un total de un 52%que es el porcentaje que tienen acceso a internet en nuestro país.
ESTADISTICAS DE USUARIOS  DE INTERNET EN AMERICA Regiones de AMERICA Poblacion (Est. 2007) Usuarios,   Dato más reciente % Poblacion (Penetracion) (%) de Usuarios Crecimiento ( 2000-2007 ) America Central 142,671,074 20,021,900 14.0 % 6.7 % 522.3 % El Caribe 38,856,548 4,298,409 11.1 % 1.4 % 668.4 % Sur America 365,195,887 48,633,288 13.3 % 16.4 % 240.3 % TOT. Latino Am. + Caribe 546,723,509 72,953,597 13.3 % 24.6 % 303.8 % Norte America 328,387,059 224,103,811 68.2 % 75.4 % 107.3 % TOTAL AMERICAS 875,110,568 297,057,408 33.9 % 100.0 % 135.5 %
COMPARACIÓN DE LA ESTADÍSTICAS DE USUARIOS DE INTERNET DE AMÉRICA  CON AMERICA DEL SUR Se pude decir que América del sur tiene un índice del 16.4%  de usuarios en el 2007 y un índice de de penetración de un 13.3% a comparación de América del norte que tiene lo una penetración de 68.2% y de usuarios 75.4% lo cual América del norte tiene mas usuarios que América del sur incluido el ecuador
USUARIOS DE INTERNET  EN AMERICA DEL SUR AMERICA DEL SUR Población ( Est. 2005) Usuarios, año 2000 Usuarios,Dato mas reciente Penetracion ( % Poblacion) % de Usuarios Crecimiento (2000-2005) Argentina 37,584,554 2,500,000 7,500,000 20.0 % 15.4 % 200.0 % Bolivia 9,073,856 120,000 350,000 3.9 % 0.7 % 191.7 % Brasil 181,823,645 5,000,000 22,320,000 12.3 % 45.9 % 346.4 % Chile 15,514,014 1,757,400 5,600,000 36.1 % 11.5 % 218.7 % Colombia 45,926,625 878,000 3,585,688 7.8 % 7.4 % 308.4 % Ecuador 12,090,804 180,000 624,600 5.2 % 1.3 % 247.0 % Guayana Francesa 194,277 2,000 38,000 19.6 % 0.1 % 1,800.0 % Guyana 877,721 3,000 145,000 16.5 % 0.3 % 4,733.3 % Islas Malvinas 2,661 - - - - n/d Paraguay 5,516,399 20,000 150,000 2.7 % 0.3 % 650.0 % Peru 28,032,047 2,500,000 4,570,000 16.3 % 9.4 % 82.8 % Suriname 460,742 11,700 30,000 6.5 % 0.1 % 156.4 % Uruguay 3,251,269 370,000 680,000 20.9 % 1.4 % 83.8 % Venezuela 24,847,273 950,000 3,040,000 12.2 % 6.3 % 220.0 % TOTAL Sur America 365,195,887 14,292,100 48,633,288 13.3 % 100.0 % 240.3 %
COMPARACIÓN DEL ECUADOR CON AMÉRICA DEL SUR El ecuador se encuentra en el penúltimo lugar de los 14 países de América del sur que tiene un porcentaje en penetración de 5.2% y de usuarios 1.3% pero nuestro país cada vez tiene mas usuarios ya que en este año tuvo un crecimiento significativo
ESTADISTICAS DE USUARIOS DE INTERNET  DE LA CAN  numero país o región población (est.2008) penetración (% población) usuarios datos mas reciente fuente del dato mas reciente 1 Bolivia 9.247.816 10,80% 9.073.856 Itu-nov./08 2 Colombia 45.013.674 30,50% 45.926.625 CRL-mar./08 3 Ecuador 13.927.650 8,00% 12.090.804 Supertel mar./08 4 Perú 29.180.899 26,20% 28.032.047 Itu-mar./08 5 Venezuela 26.414.815 24,00% 24.847.273 Conatel-junio/08 Total del can 123.784.854 19,90% 119.970.605
COMPARACIÓN DE CIFRAS DEL CAN CON EL ECUADOR Ecuador tiene un mayor índice de penetración en relación a Perú con un 18.2% de diferencia  Ecuador tiene un menor índice de penetración en relación a Colombia con un 22.5%  Ecuador tiene un menor índice de penetración en relación a Venezuela con un 16.0%  Ecuador con Bolivia tiene una diferencia en penetración de 2.6% y en usuarios el 6.3%

Contenu connexe

En vedette

Social Media Marketing Trends 2024 // The Global Indie Insights
Social Media Marketing Trends 2024 // The Global Indie InsightsSocial Media Marketing Trends 2024 // The Global Indie Insights
Social Media Marketing Trends 2024 // The Global Indie Insights
Kurio // The Social Media Age(ncy)
 
Good Stuff Happens in 1:1 Meetings: Why you need them and how to do them well
Good Stuff Happens in 1:1 Meetings: Why you need them and how to do them wellGood Stuff Happens in 1:1 Meetings: Why you need them and how to do them well
Good Stuff Happens in 1:1 Meetings: Why you need them and how to do them well
Saba Software
 

En vedette (20)

Content Methodology: A Best Practices Report (Webinar)
Content Methodology: A Best Practices Report (Webinar)Content Methodology: A Best Practices Report (Webinar)
Content Methodology: A Best Practices Report (Webinar)
 
How to Prepare For a Successful Job Search for 2024
How to Prepare For a Successful Job Search for 2024How to Prepare For a Successful Job Search for 2024
How to Prepare For a Successful Job Search for 2024
 
Social Media Marketing Trends 2024 // The Global Indie Insights
Social Media Marketing Trends 2024 // The Global Indie InsightsSocial Media Marketing Trends 2024 // The Global Indie Insights
Social Media Marketing Trends 2024 // The Global Indie Insights
 
Trends In Paid Search: Navigating The Digital Landscape In 2024
Trends In Paid Search: Navigating The Digital Landscape In 2024Trends In Paid Search: Navigating The Digital Landscape In 2024
Trends In Paid Search: Navigating The Digital Landscape In 2024
 
5 Public speaking tips from TED - Visualized summary
5 Public speaking tips from TED - Visualized summary5 Public speaking tips from TED - Visualized summary
5 Public speaking tips from TED - Visualized summary
 
ChatGPT and the Future of Work - Clark Boyd
ChatGPT and the Future of Work - Clark Boyd ChatGPT and the Future of Work - Clark Boyd
ChatGPT and the Future of Work - Clark Boyd
 
Getting into the tech field. what next
Getting into the tech field. what next Getting into the tech field. what next
Getting into the tech field. what next
 
Google's Just Not That Into You: Understanding Core Updates & Search Intent
Google's Just Not That Into You: Understanding Core Updates & Search IntentGoogle's Just Not That Into You: Understanding Core Updates & Search Intent
Google's Just Not That Into You: Understanding Core Updates & Search Intent
 
How to have difficult conversations
How to have difficult conversations How to have difficult conversations
How to have difficult conversations
 
Introduction to Data Science
Introduction to Data ScienceIntroduction to Data Science
Introduction to Data Science
 
Time Management & Productivity - Best Practices
Time Management & Productivity -  Best PracticesTime Management & Productivity -  Best Practices
Time Management & Productivity - Best Practices
 
The six step guide to practical project management
The six step guide to practical project managementThe six step guide to practical project management
The six step guide to practical project management
 
Beginners Guide to TikTok for Search - Rachel Pearson - We are Tilt __ Bright...
Beginners Guide to TikTok for Search - Rachel Pearson - We are Tilt __ Bright...Beginners Guide to TikTok for Search - Rachel Pearson - We are Tilt __ Bright...
Beginners Guide to TikTok for Search - Rachel Pearson - We are Tilt __ Bright...
 
Unlocking the Power of ChatGPT and AI in Testing - A Real-World Look, present...
Unlocking the Power of ChatGPT and AI in Testing - A Real-World Look, present...Unlocking the Power of ChatGPT and AI in Testing - A Real-World Look, present...
Unlocking the Power of ChatGPT and AI in Testing - A Real-World Look, present...
 
12 Ways to Increase Your Influence at Work
12 Ways to Increase Your Influence at Work12 Ways to Increase Your Influence at Work
12 Ways to Increase Your Influence at Work
 
ChatGPT webinar slides
ChatGPT webinar slidesChatGPT webinar slides
ChatGPT webinar slides
 
More than Just Lines on a Map: Best Practices for U.S Bike Routes
More than Just Lines on a Map: Best Practices for U.S Bike RoutesMore than Just Lines on a Map: Best Practices for U.S Bike Routes
More than Just Lines on a Map: Best Practices for U.S Bike Routes
 
Ride the Storm: Navigating Through Unstable Periods / Katerina Rudko (Belka G...
Ride the Storm: Navigating Through Unstable Periods / Katerina Rudko (Belka G...Ride the Storm: Navigating Through Unstable Periods / Katerina Rudko (Belka G...
Ride the Storm: Navigating Through Unstable Periods / Katerina Rudko (Belka G...
 
Barbie - Brand Strategy Presentation
Barbie - Brand Strategy PresentationBarbie - Brand Strategy Presentation
Barbie - Brand Strategy Presentation
 
Good Stuff Happens in 1:1 Meetings: Why you need them and how to do them well
Good Stuff Happens in 1:1 Meetings: Why you need them and how to do them wellGood Stuff Happens in 1:1 Meetings: Why you need them and how to do them well
Good Stuff Happens in 1:1 Meetings: Why you need them and how to do them well
 

estadisticas de usuarios de internet

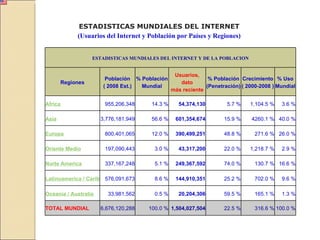
  • 1. ESTADISTICAS MUNDIALES DEL INTERNET (Usuarios del Internet y Población por Países y Regiones) ESTADISTICAS MUNDIALES DEL INTERNET Y DE LA POBLACION Regiones Población ( 2008 Est.) % Población Mundial Usuarios, dato más reciente % Población (Penetración) Crecimiento ( 2000-2008 ) % Uso Mundial Africa 955,206,348 14.3 % 54,374,130 5.7 % 1,104.5 % 3.6 % Asia 3,776,181,949 56.6 % 601,354,674 15.9 % 4260.1 % 40.0 % Europa 800,401,065 12.0 % 390,499,251 48.8 % 271.6 % 26.0 % Oriente Medio 197,090,443 3.0 % 43,317,200 22.0 % 1,218.7 % 2.9 % Norte America 337,167,248 5.1 % 249,367,592 74.0 % 130.7 % 16.6 % Latinoamerica / Caribe 576,091,673 8.6 % 144,910,351 25.2 % 702.0 % 9.6 % Oceania / Australia 33,981,562 0.5 % 20,204,306 59.5 % 165.1 % 1.3 % TOTAL MUNDIAL 6,676,120,288 100.0 % 1,504,027,504 22.5 % 316.6 % 100.0 %
  • 2. LOS 10 PAISES LIDERES EN EL INTERNET CON MAYOR NUMERO DE USUARIOS # Pais o Region Usuarios, dato más reciente Population ( 2008 Est. ) % Poblacion (Penetracion ) Fecha dato mas reciente (%) de Usuarios 1 China 253,000,000 1,330,044,605 19.0 % CNNIC June/08 16.8 % 2 Estados Unidos 221,267,592 303,824,646 72.8 % NN//R - Sept./08 14.7 % 3 Japon 94,000,000 127,288,419 73.8 % ITU - Mar./08 6.2 % 4 India 81,000,000 1,147,995,898 7.1 % ITU - Sept./07 5.4 % 5 Alemania 54,029,090 82,369,548 65.6 % N//NR Sept./08 3.6 % 6 Brasil 53,140,000 191,908,598 27.7 % ITU - Nov./08 3.5 % 7 Reino Unido 41,913,401 60,943,912 68.8 % N//NR Sept./08 2.8 % 8 Francia 39,182,645 62,177,676 63.0 % N//NR - Sept./08 2.6 % 9 Corea del Sur 35,590,000 49,232,844 72.3 % ITU Sept./08 2.4 % 10 Italia 35,534,845 58,145,321 61.1 % N//NR Sept./08 2.4 % Los 10 Paises Lideres 908,657,573 3,413,931,467 26.6 % IWS - Sept.30/08 60.4 % Resto del Mundo 595,369,931 3,262,188,821 18.3 % IWS - Sept.30/08 39.6 % Total Mundial Usuarios 1,504,027,504 6,676,120,288 22.5 % IWS - Sept.30/08 100.0 % .
  • 3. LOS 10 PAISES LIDERES CON LA MAS ALTA TASA DE PENETRACION DEL INTERNET # PAIS o REGION Penetración (% población) Usuarios, Dato Mas Reciente Población ( 2008 Est.) Fuente del Dato mas Reciente 1 Groenlandia 92.3 % 52,000 56,326 ITU - Mar./08 2 Paises Bajos 90.1 % 15,000,000 16,645,313 ITU - Mar./08 3 Noruega 87.7 % 4,074,100 4,644,457 ITU - Ago./07 4 Antigua and Barbuda 85.9 % 60,000 69,842 ITU - Mar./08 5 Islandia 84.8 % 258,000 304,367 ITU - Sept./06 6 Canada 84.3 % 28,000,000 33,212,696 ITU - Mar./08 7 Nueva Zelandia 80.5 % 3,360,000 4,173,460 ITU - Mar./08 8 Australia 79.4 % 16,355,402 20,600,856 N//NR - Sept./08 9 Suecia 77.4 % 7,000,000 9,045,389 ITU Mar./08 10 Falkland Islands 76.5 % 1,900 2,483 CIA - Dic./02 10 Paises Lideres 83.6 % 74,161,402 88,755,189 IWS - Sept.30/08 Resto del Mundo 21.7 % 1,429,866,102 6,587,365,099 IWS - Sept.30/08 Total Mundial Usuarios 22.5 % 1,504,027,504 6,676,120,288 IWS - Sept.30/08
  • 4. LOS 20 PAISES LIDERES EN EL MUNDO CON MAYOR NUMERO DE USUARIOS # País o Región Usuarios, Ultimo Dato Población ( 2007 Est. ) Penetración Internet Fuente de la estadística % Mundial Usuarios 1 Estados Unidos 210,080,067 301,967,681 69.6 % Nielsen//NR Nov/06 19.2 % 2 China 132,000,000 1,317,431,495 10.0 % CNNIC Dec/06 12.1 % 3 Japon 86,300,000 128,646,345 67.1 % eTForecasts Dec/05 7.9 % 4 Alemania 50,616,207 82,509,367 61.3 % Nielsen//NR Aug/06 4.6 % 5 India 40,000,000 1,129,667,528 3.5 % IWS Nov/06 3.7 % 6 Reino Unido 37,600,000 60,363,602 62.3 % ITU Sept/06 3.4 % 7 Corea del Sur 33,900,000 51,300,989 66.1 % eTForecast Dec/05 3.1 % 8 Francia 30,837,592 61,350,009 50.3 % Nielsen//NR Nov/06 2.8 % 9 Italia 30,763,848 59,546,696 51.7 % Nielsen//NR Oct/06 2.8 % 10 Brasil 25,900,000 186,771,161 13.9 % eTForcasts Dec/05 2.4 % 11 Rusia 23,700,000 143,406,042 16.5 % eTForcasts Dec/05 2.2 % 12 Canada 21,900,000 32,440,970 67.5 % eTForcasts Dec/05 2.0 % 13 Mexico 20,200,000 106,457,446 19.0 % AMIPCI Oct/06 1.8 % 14 España 19,204,771 45,003,663 42.7 % Nielsen//NR Oct/06 1.8 % 15 Indonesia 18,000,000 224,481,720 8.0 % eTForcasts Dec/05 1.6 % 16 Turquia 16,000,000 75,863,600 21.1 % ITU Sept/06 1.5 % 17 Australia 14,729,209 20,984,595 70.2 % Nielsen//NR Nov/06 1.3 % 18 Vietnam 14,509,075 85,031,436 17.1 % VNNIC Dec/06 1.3 % 19 Taiwan 13,800,000 23,001,442 60.0 % CIA Mar/05 1.3 % 20 Argentina 13,000,000 38,237,770 34.0 % Indec Sept/06 1.2 % 20 Paises Lideres 853,040,769 4,174,463,557 20.4 % IWS - Jan. 11/07 78.0 % Resto del Mundo 240,488,923 2,400,202,860 10.0 % IWS - Jan. 11/07 22.0 % Total Mundial 1,093,529,692 6,574,666,417 16.6 % IWS - Jan. 11/06 100.0 %
  • 5. COMPARACIÓN DEL ECUADOR CON EL MUNDO Nuestro país tiene un nivel muy bajo de penetración tan solo con 180.000 usuarios en el 2005 que da un total de un 52%que es el porcentaje que tienen acceso a internet en nuestro país.
  • 6. ESTADISTICAS DE USUARIOS DE INTERNET EN AMERICA Regiones de AMERICA Poblacion (Est. 2007) Usuarios, Dato más reciente % Poblacion (Penetracion) (%) de Usuarios Crecimiento ( 2000-2007 ) America Central 142,671,074 20,021,900 14.0 % 6.7 % 522.3 % El Caribe 38,856,548 4,298,409 11.1 % 1.4 % 668.4 % Sur America 365,195,887 48,633,288 13.3 % 16.4 % 240.3 % TOT. Latino Am. + Caribe 546,723,509 72,953,597 13.3 % 24.6 % 303.8 % Norte America 328,387,059 224,103,811 68.2 % 75.4 % 107.3 % TOTAL AMERICAS 875,110,568 297,057,408 33.9 % 100.0 % 135.5 %
  • 7. COMPARACIÓN DE LA ESTADÍSTICAS DE USUARIOS DE INTERNET DE AMÉRICA CON AMERICA DEL SUR Se pude decir que América del sur tiene un índice del 16.4% de usuarios en el 2007 y un índice de de penetración de un 13.3% a comparación de América del norte que tiene lo una penetración de 68.2% y de usuarios 75.4% lo cual América del norte tiene mas usuarios que América del sur incluido el ecuador
  • 8. USUARIOS DE INTERNET EN AMERICA DEL SUR AMERICA DEL SUR Población ( Est. 2005) Usuarios, año 2000 Usuarios,Dato mas reciente Penetracion ( % Poblacion) % de Usuarios Crecimiento (2000-2005) Argentina 37,584,554 2,500,000 7,500,000 20.0 % 15.4 % 200.0 % Bolivia 9,073,856 120,000 350,000 3.9 % 0.7 % 191.7 % Brasil 181,823,645 5,000,000 22,320,000 12.3 % 45.9 % 346.4 % Chile 15,514,014 1,757,400 5,600,000 36.1 % 11.5 % 218.7 % Colombia 45,926,625 878,000 3,585,688 7.8 % 7.4 % 308.4 % Ecuador 12,090,804 180,000 624,600 5.2 % 1.3 % 247.0 % Guayana Francesa 194,277 2,000 38,000 19.6 % 0.1 % 1,800.0 % Guyana 877,721 3,000 145,000 16.5 % 0.3 % 4,733.3 % Islas Malvinas 2,661 - - - - n/d Paraguay 5,516,399 20,000 150,000 2.7 % 0.3 % 650.0 % Peru 28,032,047 2,500,000 4,570,000 16.3 % 9.4 % 82.8 % Suriname 460,742 11,700 30,000 6.5 % 0.1 % 156.4 % Uruguay 3,251,269 370,000 680,000 20.9 % 1.4 % 83.8 % Venezuela 24,847,273 950,000 3,040,000 12.2 % 6.3 % 220.0 % TOTAL Sur America 365,195,887 14,292,100 48,633,288 13.3 % 100.0 % 240.3 %
  • 9. COMPARACIÓN DEL ECUADOR CON AMÉRICA DEL SUR El ecuador se encuentra en el penúltimo lugar de los 14 países de América del sur que tiene un porcentaje en penetración de 5.2% y de usuarios 1.3% pero nuestro país cada vez tiene mas usuarios ya que en este año tuvo un crecimiento significativo
  • 10. ESTADISTICAS DE USUARIOS DE INTERNET DE LA CAN numero país o región población (est.2008) penetración (% población) usuarios datos mas reciente fuente del dato mas reciente 1 Bolivia 9.247.816 10,80% 9.073.856 Itu-nov./08 2 Colombia 45.013.674 30,50% 45.926.625 CRL-mar./08 3 Ecuador 13.927.650 8,00% 12.090.804 Supertel mar./08 4 Perú 29.180.899 26,20% 28.032.047 Itu-mar./08 5 Venezuela 26.414.815 24,00% 24.847.273 Conatel-junio/08 Total del can 123.784.854 19,90% 119.970.605
  • 11. COMPARACIÓN DE CIFRAS DEL CAN CON EL ECUADOR Ecuador tiene un mayor índice de penetración en relación a Perú con un 18.2% de diferencia Ecuador tiene un menor índice de penetración en relación a Colombia con un 22.5% Ecuador tiene un menor índice de penetración en relación a Venezuela con un 16.0% Ecuador con Bolivia tiene una diferencia en penetración de 2.6% y en usuarios el 6.3%