3 line graph worksheet
•
1 j'aime•1,004 vues

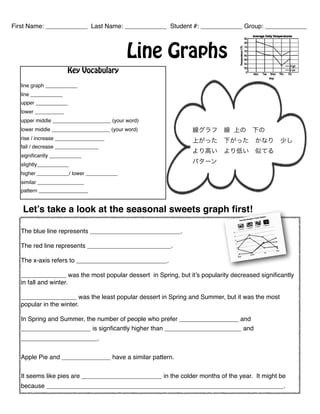
- The graph shows seasonal trends for different desserts' popularity. - Apple pie and pumpkin pie had similar patterns of being more popular in colder months. - Ice cream was the most popular dessert in spring but its popularity decreased significantly in fall and winter, while cheesecake was the least popular in spring and summer but the most popular in winter.

Recommandé
Contenu connexe
Plus de Meagan Kaiser
Plus de Meagan Kaiser (20)
Dernier
Dernier (20)
3 line graph worksheet
- 1. 線グラフ 線 上の 下の 上がった 下がった かなり 少し より高い より低い 似てる パターン Line Graphs The blue line represents __________________________. The red line represents ________________________. The x-axis refers to __________________________. _____________ was the most popular dessert in Spring, but it’s popularity decreased significantly in fall and winter. ________________ was the least popular dessert in Spring and Summer, but it was the most popular in the winter. In Spring and Summer, the number of people who prefer _________________ and ____________________ is signficantly higher than ______________________ and ______________________. Apple Pie and ______________ have a similar pattern. It seems like pies are _______________________ in the colder months of the year. It might be because ____________________________________________________________________. First Name: ____________ Last Name: ____________ Student #: ____________ Group: ____________ Key Vocabulary line graph ___________ line ___________ upper ___________ lower __________ upper middle ____________________ (your word) lower middle ____________________ (your word) rise / increase _________________ fall / decrease _______________ significantly ___________ slightly___________ higher ___________/ lower ___________ similar ________________ pattern _________________ Let’s take a look at the seasonal sweets graph first!
- 2. Ok, now let’s take a look at the population of SNS users graph! The upper line refers to __________________________. The middle line refers to ________________________. The bottom line refers to __________________________________. _______________ people used Twitter in September 2010. The number of Twitter users increased ________________ in March 2011. Actually, the number of users of all 3 SNS ________________ _________________ in March 2011. It (might be) (is probably) because __________________________ ________________________________________________________. It might also be because _____________________________________________________. Facebook was the ____________ popular in January 2010. The number of users started to __________________ in February 2011. It (might be) (is probably) because _________________________________________________________.
- 4. My Graph_____________________________________________________ My Graph Description_____________________________________________________