DepEd Region 7 QAAD’s Report on Regional Monitoring, Evaluation and Plan Adjustment…
•
5 j'aime•10,429 vues

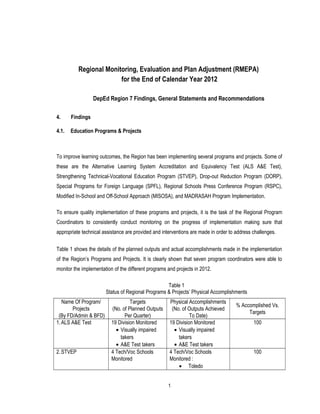
DepEd QAAD's Report on Regional Monitoring, Evaluation and Plan Adjustment (RMEPA) for the End of Calendar Year 2012

Recommandé
Recommandé
Contenu connexe
Tendances
Tendances (20)
En vedette
En vedette (20)
Similaire à DepEd Region 7 QAAD’s Report on Regional Monitoring, Evaluation and Plan Adjustment…
Similaire à DepEd Region 7 QAAD’s Report on Regional Monitoring, Evaluation and Plan Adjustment… (20)
Plus de Dr. Joy Kenneth Sala Biasong
Plus de Dr. Joy Kenneth Sala Biasong (20)
Dernier
Dernier (20)
DepEd Region 7 QAAD’s Report on Regional Monitoring, Evaluation and Plan Adjustment…
- 1. Regional Monitoring, Evaluation and Plan Adjustment (RMEPA) for the End of Calendar Year 2012 DepEd Region 7 Findings, General Statements and Recommendations 4. Findings 4.1. Education Programs & Projects To improve learning outcomes, the Region has been implementing several programs and projects. Some of these are the Alternative Learning System Accreditation and Equivalency Test (ALS A&E Test), Strengthening Technical-Vocational Education Program (STVEP), Drop-out Reduction Program (DORP), Special Programs for Foreign Language (SPFL), Regional Schools Press Conference Program (RSPC), Modified In-School and Off-School Approach (MISOSA), and MADRASAH Program Implementation. To ensure quality implementation of these programs and projects, it is the task of the Regional Program Coordinators to consistently conduct monitoring on the progress of implementation making sure that appropriate technical assistance are provided and interventions are made in order to address challenges. Table 1 shows the details of the planned outputs and actual accomplishments made in the implementation of the Region’s Programs and Projects. It is clearly shown that seven program coordinators were able to monitor the implementation of the different programs and projects in 2012. Table 1 Status of Regional Programs & Projects’ Physical Accomplishments Name Of Program/ Projects (By FD/Admin & BFD) Targets (No. of Planned Outputs Per Quarter) Physical Accomplishments (No. of Outputs Achieved To Date) % Accomplished Vs. Targets 1.ALS A&E Test 19 Division Monitored • Visually impaired takers • A&E Test takers 19 Division Monitored • Visually impaired takers • A&E Test takers 100 2.STVEP 4 Tech/Voc Schools Monitored 4 Tech/Voc Schools Monitored : • Toledo 100 1
- 2. • Abellana • Subangdaku • Talisay 3.DORP 19 Divisions Monitored 19 Divisions Monitored 100 4.MISOSA 19 Divisions Monitored 19 Divisions Monitored 100 5.SPFL Monitored and facilitated the Immersion to French Language 4 teachers Monitored and facilitating the Immersion to French Language 4 teachers 100 6.RSPC Monitored the conduct of RSPC 1 1 100 7. Madrasah Monitor & Evaluate the implementation of MADRASAH in the identified schools in the DOs 4 Schools 4 Schools 100 Table 2 shows the details of the monitoring done by the Regional Coordinators and the technical assistance they provided to the beneficiaries or recipients of the programs and projects in the field. Monitoring activities done has enabled the Region to determine the number of beneficiaries of ALS BPOSA and ALS A&E. Note also that technical assistance provided include fast tracking of distribution of Science Instructional Materials to selected school recipients through DepED-VECO project and conduct of planning conferences so that there would be (1) smooth implementation of STVEP in a few schools and (2) efficient utilization of SBM grants. Table 2 Number of Learners Served in ALS BPOSA, ALS A&E, and DEPED-VECO SSMS, and Technical Assistance Given to the Recipients of STVEP and SBM NAME OF PROGRAM/ PROJECTS (By FD/Admin & BFD) TARGETS (No of Planned Outputs per quarter) PHYSICAL ACCOMPLISHMENTS (No of outputs achieved to date) % ACCOMPLISHED VS. TARGETS 1. ALS BPOSA ALS A&E Number of Learner served • 1254 Number of A&E registrants • 538 Number of Learner served • 1254 Number of A&E registrants • 538 100 2
- 3. 2. DepED-VECO SSMs Distributed 100 Copies of Supplementary Materials per Grade Level for the VECO franchised divisions • Cebu • Cebu City • Lapulapu City • Naga City • Mandaue City • Toledo City Distributed 100 Copies of Supplementary Materials per Grade Level for the VECO franchised divisions • Cebu • Cebu City • Lapulapu City • Naga City • Mandaue City • Toledo City 100 3. MTB-MLE 4-Day Regional TOT on Oral Language Development and the Pedagogical Aspect of Using MTB-MLE • 94 teachers 4-Day Regional TOT on Oral Language Development and the Pedagogical Aspect of Using MTB-MLE • 91 teachers 97 4. STVEP 4 Tech/Voc Schools given assistance 4 Tech/Voc Schools given assistance • Toledo • Abellana • Subangdaku • Talisay 100 5. SBM Hold Planning conference with SBM Coordinators and Task Force in preparation for the Regional SBM Conference 57 Participants (Phase I) 57 Participants (Phase I) 100 Conduct the 1st RO VII SBM Conference with RD, ARD, SDS, ASDS, SBM Coordinators , SBM Task Force & EPS 1 223 participants (Phase I) 180 Participants (Phase I) .81 266 Participants (Phase II) 266 Participants (Phase II) 100 Other important details like specific issues and concerns and corresponding technical assistance provided are presumed to be submitted directly to the Central Office for these were not mentioned during the conduct of quarterly RMEAs and in the first End-of-Year RMEA in 2012. 3
- 4. 4.2 On Education Resources To update the Region on the status of Education Resources in 2012, the Policy Planning and Research Division (PPRD) presented data on the physical and human resource needs of the schools by level whereas the Budget and Finance Division (BFD) presented a detailed annual report on the status of utilization of the financial resources received from the Central Office. Table 3 shows the needs of the schools in the Region for teachers, classrooms, and seats. These needs are determined using enrolment data and planning standards for each education resource at specific levels of basic education. It is clearly shown in Table 3 that the Region had provided only 11% of the number of teachers needed in schools so that at the end of 2012, the Region still needed almost ten thousand teachers—around half of that number was needed by the secondary schools and the other half subdivided almost equally by the kindergarten and elementary schools. Table 3 Status of Education Resource Needs of Schools in the Region Education Resources Education Resource Needs of Schools Kindergarten Elementary Secondary Total August2012 Intervention EndOf2012 August2012 Intervention EndOf2012 August2012 Intervention EndOf2013 August2012 Intervention EndOf2013 Teacher 2,652 310 2,342 2,682 378 2,304 5,335 518 4,817 10,669 1,206 9,463 Classroom 2,235 – – 2,177 – – 2,133 – – 6,545 1,720 4,825 Seat (Desk & Armchair) – – 66,28 1 2,177 – – – – 2,133 – – 70,591 Classrooms built to address classroom needs were not clearly categorized in Table 3 as to which level they were given. It can be noted from Table 3 that the largest need for seats was at the Kindergarten level. It implies that parents and/or other stakeholders provided for the seats to more than sixty thousand kindergarten pupils in the Region. PPRD’s report also on seat needs did not clearly show the number of seats procured in 2012. Note that Table 3 generally shows the performance of the Region in terms of governance. 4
- 5. Regional Educational Financial Resources The Region received 43 funds from the Central Office in 2012 in the total amount of almost 155 million pesos. The Region has utilized around 95% of the total financial resource received for the year. The Region completely utilized 22 funds (99% to 100% utilization) received from the Central Office. One likely reason that these funds were utilized is that 18 of these funds were received in the first half of the year giving the concerned Functional Divisions (FDs) sufficient time to implement the programs and projects the said funds were intended for. Table 4 shows that out of 43 funds received, nine funds were not utilized. Of these unutilized funds only one was received at the first half of the year and five were received at the fourth quarter of the year. The date Sub-ARO of each fund was received likely contributed to the failure in utilizing the said funds. Table 4 Financial Resource of the Region in 2012 Particulars Date Received FDs Responsible UTILIZATION Amount Received & Released Amount Utilized % of Utilizatio n (Balance) 1 To cover deficiency in clothing/ uniform allowance CY 2012 11/27/12 BFD 104,000.00 104,000.00 100.00 - 2 Funding Requirements for 4th Tranche Compensation Adjustment (SSL 3) - PS 8/23/12 BFD 1,956,000.00 1,956,000.00 100.00 - 3 Funding Requirements for 3rd Tranche Compensation Adjustment (SSL 3) - PS 5/17/12 BFD 2,831,000.00 2,831,000.00 100.00 - 4 Funding Requirements for 3rd Tranche Compensation Adjustment (SSL 3) - RLIP 5/17/12 BFD 313,000.00 313,000.00 100.00 - 5 Funding Requirements for 4th Tranche Compensation Adjustment (SSL 3) - RLIP 8/23/12 BFD 203,000.00 203,000.00 100.00 - 6 Financial Assistance for regional participation to 3/16/12 RMSPPD 5,286,670.00 5,286,670.00 100.00 - 5
- 6. the 2012 Palarong Pambansa 7 Financial assistance for the participation of the differently-abled to the 2012 Palarong Pambansa 5/20/12 RMSPPD 136,432.00 136,432.00 100.00 - 8 To cover expenses for the conduct of Capacity Building for Grade 1 Teachers 5/20/12 CLMD 16,004,000.00 16,004,000.00 100.00 - 9 Snacks and lunch of participants on the conduct of NAMCYA Regional Competition Workshop 9/28/12 RMSPPD 15,000.00 15,000.00 100.00 - 10 Financial assistance on the conduct of Regional Level S & T Fair 10/18/12 CLMD 60,000.00 60,000.00 100.00 - 11 Abm Not Needing Clearance Portion - CO 1/3/12 680,000.00 680,000.00 100.00 - 12 To cover the procurement of school furniture under the CY 2012 BEFF (15% regional office allocation) 8/8/12 RMSPPD 9,550,995.56 9,550,995.56 100.00 - 13 To cover expenses for the construction of Preschool building with toilet and furniture 05/20/12 RMSPPD 2,397,447.00 2,397,447.00 100.00 - 14 To cover expenses for the construction of Preschool building with toilet and furniture 05/20/12 RMSPPD 41,755,039.50 41,755,039.50 100.00 - 15 Expenses for board & lodging of participants and training staff on the conduct of Training/Workshop on the Application of BMS 08/08/12 BFD 412,800.00 412,800.00 100.00 - 16 To cover monitoring fund of Regional ALIVE Coordinators 09/15/12 FED 84,000.00 84,000.00 100.00 - 17 To cover terminal leave benefits of Mr. Danilo Villadolid 2/8/12 BFD 821,944.00 821,943.25 100.00 0.75 18 To cover the terminal leave benefits of Diomedes Balingcasag 8/22/12 BFD 17,755.00 17,754.12 100.00 0.88 19 Abm Not Needing Clearance Portion - PS 1/3/12 BFD 31,174,000.00 31,170,000.00 99.99 4,000.00 20 Abm Not Needing Clearance Portion - Repair & Maintenance 1/3/12 BFD 1,843,500.00 1,842,000.00 99.92 1,500.00 6
- 7. 21 Financial Assistance On The Conduct Of Pre- Regional And Regional Meets 3/16/12 RMSPPD 1,200,000.00 1,198,454.34 99.87 1,545.66 22 Abm Not Needing Clearance Portion - RLIP 1/3/12 BFD 2,869,000.00 2,860,000.00 99.69 9,000.00 23 Abm Not Needing Clearance Portion - MOOE 1/3/12 BFD 25,852,000.00 23,595,305.71 91.27 2,256,694.29 24 To cover expenses for the conduct of Capacity Building for Grade 1 Teachers 5/20/12 CLMD 7,386,795.00 6,656,676.61 90.12 730,118.39 25 To cover the provision of Program Support Fund to the regional office in connection with the allocation of SBM Grants to various elementary and secondary schools 12/22/11 FED 2,880,911.00 2,461,720.33 85.45 419,190.67 26 Financial assistance for the operation of Open HS Program - Dropout Reduction Program (OHSP-DORP) 09/11/12 CLMD 400,000.00 325,000.00 81.25 75,000.00 27 Subsidy to cover the operation of the Open High School Program- Dropout Reduction Program (OHSP-DORP) 2/8/2012 CLMD 400,000.00 309,721.00 77.43 90,279.00 28 Conduct of Regional Orientation on the Basic Education Information System (BEIS) Data Gathering System SY 2012-2013 05/20/12 PPRD 61,200.00 37,254.00 60.87 23,946.00 29 To cover expenses for the development of learner's materials (LMs) and teacher's guide (TGs) 11/30/12 CLMD 1,034,320.00 548,961.00 53.07 485,359.00 30 Board & lodging, materials & internet service expenses on the Orientation on the Pb. & Priv. Profiles, SUCs Lab Schools & Data Collection and Updating of Public Schools LIS SY 2012-2013 09/15/12 PPRD/ CLMD 210,300.00 103,217.75 49.08 107,082.25 31 Board/Lodging & purchase of supplies for the conduct of Division Orientation/ Briefing of School Recipient for 09/11/12 CLMD 474,000.00 180,533.00 38.09 293,467.00 7
- 8. Batch 7 VisMin cluster DepED Computerization Program e-classroom pack for elem 32 Expenses on the conduct of Annual DepED-DPWH National Consultative Conference 04/23/12 RMSPPD 176,400.00 49,812.00 28.24 126,588.00 33 Conduct of various SEMIT activities from Sept-Dec 2012 11/30/12 PPRD 3,060,823.50 671,457.47 21.94 2,389,366.0 3 34 Monitoring and Evaluation Subsidy Fund for Regional and Division Tech/Voc/TLE Officials/Supervisors 6/13/12 CLMD 189,000.00 31,440.00 16.63 157,560.00 35 Financial asst. re Regional Search for the 2012 National Literacy Awards of Regional Selection Committee and other LCC related activities 04/23/12 CLMD 25,000.00 - - 25,000.00 36 Monitoring of School Based Feeding Program 10/30/12 RMSPPD 30,000.00 - - 30,000.00 37 Financial assistance to Selected Divisions for the Expansion of the ALS Mobile Library Project 9/15/12 CLMD 60,000.00 - - 60,000.00 38 Financial assistance for the augmentation of travelling allowance of regional Health Personnel 11/30/12 RMSPPD 159,200.00 - - 159,200.00 39 Implementation of Every Child A Reader Program 10/30/12 CLMD 160,000.00 - - 160,000.00 40 Financial assistance for the conduct of Regional Training of School Paper Adviser/ Campus Journalists and Regional Schools Press Conference 9/28/12 PPRD 465,500.00 - - 465,500.00 41 To cover the administrative and engineering overhead cost on the procurement of school furniture & fixtures 8/8/12 RMSPPD 4,592.83 - - 4,592.83 42 To cover the administrative and engineering overhead cost on the procurement of school furniture & fixtures 8/8/12 RMSPPD 33,517.50 - - 33,517.50 8
- 9. 43 Conduct of LRMDS Orientation and Advocacy Program to Elem and Sec Schools and CLCs 11/30/12 CLMD 269,475.00 - - 269,475.00 - 163,048,617.89 154,670,634.64 94.86 8,377,983.25 4.3 Organizational Effectiveness Physical Accomplishments Table 5 highlights the end-of-year actual physical accomplishments of outputs targeted or planned at the start of 2012. Upon accounting the physical accomplishments of the Region, it can be seen from Table 5 that the Region accomplished almost 99% of the 546 planned outputs for 2012. The Region attained this accomplishment amidst issues like inadequacies in personnel and office equipment and unprecedented tasks that had to be prioritized as these were mandated by the Central Office such as outputs in relation to K to 12 Curriculum Implementation. Table 5 Status of Annual Physical Accomplishments of Functional/Support Divisions FD/SD Targets Accomplished % of Accomplishment T&DD 47 46.93 PPRD 121 120.65 99.71 FED 41 40.84 99.61 BFD 80 79.58 99.48 RMSPPD 65 64.10 98.62 QAAD 58 57.00 98.28 CLMD 89 86.42 97.10 Adm 45 43.59 96.87 Regional Performance 546 539.11 98.69 9
- 10. The reason behind the number of accomplished outputs that are in two decimal places is that it is agreed in the Region that even if an output like a provision of technical assistance like capability building is successfully delivered, an accomplishment of that output is not 100% if the number of required participants is not met. Hence, only a fraction of the output is considered in order that Functional Divisions ensure quality of participation in every undertaking that they pursue. All Functional and Support Divisions (FDs/SDs) except Quality Assurance and Accountability Division (QAAD) and Curriculum and Learning Management Division (CLMD) had accomplished all planned outputs. QAAD was not able to deliver a capability building program Training of Trainers for School Monitoring Evaluation and Assessment because a joint preparation of the Program Design and Resource Package of the said program was not yet finalized. CLMD, on the other hand, had to prioritize on preparing learning guides and teaching guides for the K to 12 Curriculum so that they were not able to finalize their Regional Curriculum Learning Matrix in 2012. The FDs and SDs of the Region underwent continuous improvement in conducting RMEA especially in (1) describing planned outputs, (2) differentiating planned outputs from performance/success indicators, (3) setting content and process standards, and (4) counting accomplishments. The reason that the number of planned outputs of PPRD is more than a hundred is because each monthly or quarterly report was individually counted. One positive effect of efficiency in setting content and process standards is that Functional Divisions and Support Divisions do not mention overlapping/conflicting activities anymore as one of their implementation issues because instead of expecting individual participants to come to capability building programs, they only require representatives of teams or Functional Divisions. Another important insight of the Region in the regular conduct of RMEA is that aside from the original targets set at the start of the year, FDs and SDs make some adjustments every after Progress M&E, Quarterly RMEA, by (1) dropping some planned outputs because of reliable and valid reasons and (2) crafting new outputs in the form of technical assistance that are deemed indispensable to address issues and challenges that they meet as they do monitoring activities in the field. 10
- 11. From the physical accomplishments of the Region, here is a list of major contributions to Regional Effectiveness by Functional Division: • Policy Planning and Research Division Ensuring efficiency of Division Data Management , Planning and Budgeting by capacitating the Division Offices on the following: Updating e-BEIS Preparation of BARs and BEDs Use of the e-BEIS in Budget Preparation Budget Preparation Use of Guidelines of DepED Order 12 & 37 s. 2012 Ensuring equitable distribution of teacher items through the following: Issuance of a regional memorandum requiring Division appointing authorities to comply DepED Order 50 s. 2003 Enter into an agreement with Civil Service not to attest or affirm appointments without certification of deployment from regional office Validation on the request authority to fill up newly created/vacant positions based on RQA, ranking & supporting documents by issuing authority to fill up and certification of deployment Conduct validation workshops on the validation of the filling-up of items with SDSs, POs, AOs, RFTAT member (Regional EPS), SHs from OUs/IUs Ensuring approval of Regional Budget Proposal by providing Report Cards to Congressman, Governors and Mayors regarding the status of existing crucial resources and needs. • Curriculum and Learning Management Division Crafted and produced the following: Curriculum and Learning Management Division Strategic Plan Regional Program Framework for Curriculum Localization/Contextualization and Implementation Plan 11
- 12. Regional Curriculum Learning Matrix (RCLM) MISOSA and DORP training resource package Spearheaded the K to 12 Mass Training of Teachers on Curriculum Implementation for Grade One and Grade Seven Monitored the K to 12 Curriculum Implementation Facilitated the production of the following Instructional Materials: 34 MTB-MLE Big Books for Grade One Pupils Teacher-Developed Science Instructional Materials MTB_MLE materials for Grade 3 Pilot School Implementers Grade Two Lesson Guides for Pilot MTB-MLE Implementers Identified ALS crucial needs and undertook actions steps Facilitated in the Assessment and Review of the Senior High Schools pilot implementation Reviewed, Evaluated, Edited/Quality Assured, Uploaded, and Published Instructional Materials at LRMDS Portal • Training and Development Division Capacitated all Division T & D Teams, Regional Key Personnel, and SDSs and ASDSs on T and D systems Facilitated the Training of Grade 1 and Grade 7 Teachers and Elementary and Secondary School Heads on the K to 12 program • Resource Mobilization Special Programs and Projects Researched Unpublished Folk Songs (4) and Folk Dances (6) Conducted Refresher course in all Sports events to MAPEH Supervisors / Coaches and Officiating Officials Conducted Training of Trainors on HIV and AIDS Education and Prevention in the Workplace Conducted Regional Workshop on How to Open School for the Arts (4 schools divisions) • Quality Assurance and Accountability Division Rolled out QMS CBs 1, 2, & 3 to institutionalize Quality Management System in the Region Spearheaded the conduct of regular and on-time Regional Monitoring and Evaluation Adjustment (RMEA) Established a system in processing applications of public and private schools 12
- 13. Helped improve regional planning practices through M&E Implementation Issues Table 6 shows that almost 50% of the 69 issues raised in 2012 from the first to fourth quarter were resolved. Some issues that recur every quarter, twice or thrice within the year were deemed to have possible solution whereas one proposed resolution to a recurring issue was perceived as less likely to get implemented. Many of the issues that recur refer to repair, maintenance or replacement of defective or malfunctioning office equipment that are addressed each quarter but still recur because of regular breakdown of these equipment like printer, photocopying machine and the like. Table 6 Total Number of Implementation Issues Raised in 2012 REGIONAL UNIT number of issues presented to the management number of issues resolved issues that are recurring with possible solution recurring issue/s that may have no solution QAAD 14 6 5 0 CLMD 11 4 2 0 RMSPPD 15 6 9 0 FED 5 3 1 0 TDD 10 5 2 0 PPRD 6 5 1 0 ADMIN 2 1 1 0 BFD 6 1 1 1 TOTAL 69 31 22 1 Table 7 shows the details of issues that recur in the Fourth Quarter of 2012 and issues raised in the fourth quarter. One of the most common issues is lack of technical personnel especially in T&DD, RMSPPD, and CLMD. Table 7 Implementation Issues Raised in 2012 FD/SD CATEGORY ISSUES THAT RECUR RAISED IN PROPOSED RESOLUTIONS CAN IT BE RESOLVED? Q 1 Q 2 Q 3 Q 4 DONE YES MAYBE 13
- 14. BFD Inst'l Delayed submission of Form 7 and monthly & quarterly reports from the field 1 1 1 1 Web-based form 7 reporting/ submission 1 BFD Inst'l Monthly lapsing of NCA 1 1 1 1 Make representations/ recommendations for quarterly lapsing of NCAs instead of monthly 1 QAAD Envi/ Infra Needs LCD to facilitate refining QMS CB session guides and PowerPoint presentations 1 1 1 1 Request from the Regional Management 1 QAAD Inst'l Delayed submission by FDs/ SDs of M&E Data (Physical Output Matrices and Qualitative Data) during RMEA 1 1 1 1 Constant follow up and request from FD/SD chiefs for prompt submission of M&E Data 1 RMSPPD Tech'l Lack of professional & technical Staff for PFU 1 1 1 1 Provision of additional manpower or deployment of personnel from other units to RMSPPD 1 RMSPPD Tech'l Unfilled vacant positions of HNU – Medical Officer/ Nurse, Education Supervisor II-TLE/ HELE, Reclassification of ND I to II 1 1 1 1 Filling-up of vacant items and Reclassification 1 TDD Tech'l Greater demands for T&D services at present vis-à-vis very limited number of personnel 1 1 1 1 Request the RD to detail T&D personnel from the Schools Divisions to the RO 1 CLMD Tech'l Insufficiency of Personnel with specialization on TLE, ALS, and APEH 1 1 1 Time management and Request for additional personnel 1 CLMD Envi/ Infra Out-of-order photocopying machine 1 1 1 Replacement/repair of photocopying machine 1 CLMD Envi/ Infra No LCD to use during trainings and other related activities 1 1 1 Request for placement and/or procurement of LCD and copying machine 1 FED No Comfort Room for FED 1 1 1 Follow up Regional Management 1 RMSPPD Envi/ Infra Photocopier always malfunctions and repair (oftentimes delayed) is not long-lasting/efficient 1 1 1 Request for heavy duty copier as replacement. 1 QAAD Envi/ Infra Photocopier always malfunctions and repair (oftentimes delayed) is not long-lasting 1 1 Request for a replacement of a heavy- duty copier 1 QAAD Envi/ Infra Purchase Request submitted specifying the replacement of 3 chargers of QAAD laptops (2 HP and 1 Lenovo) not yet acted (Only 1 is provided) 1 1 Request from the Regional Management 1 14
- 15. QAAD Envi/ Infra Defective printer (staff use) returned for repair/replacement not returned/ replaced yet (Chief already has a printer so only printer for staff use is lacking) 1 1 Request for prioritization of this request 1 QAAD Envi/ Infra Telephone always out-of-order and requests for repair not immediately acted 1 1 Request from the Regional Management 1 QAAD Envi/ Infra Telephone no access for long distance calls 1 1 Request for access that is limited only to the numbers of the 19 schools divisions and Central Office (arrange with Tel Co.) 1 QAAD Inst'l Information on current RO activities is not readily available to every RO personnel (esp. those who are on travel) because of non-posting of memoranda pertaining them on the website 1 1 Request for the posting of memoranda about activities that only involve Regional Personnel 1 RMSPPD Inst'l Delayed processing of Billing 1 1 Assistance from SDS to monitor processing of billing 1 RMSPPD Financial Delayed release of SARO 1 1 Prompt release of SARO by concerned agency (hopefully in 2013) 1 RMSPPD Envi/ Infra Inaccessibility and Unavailability of School sites 1 1 Thorough assessment of sites before inclusion to priority list to avoid realignment & delay 1 RMSPPD Envi/ Infra Inadequate electronic and mechanical equipment for staff ( laptops, net books) 1 1 Provision of needed electronic & mechanical equipments. 1 RMSPPD Tech'l Logistic support for technical personnel`s mobility 1 1 Provision of Logistic support for technical personnel`s mobility (c/o SDSs) 1 RMSPPD Tech'l The need for training of the Staff on Resource Mobilization & Management and TOT of core persons of 19 field Divisions on RM & M 1 1 Conduct of training (CB) of RMSPPD Staff & TOT of Field Division`s core persons by consultants 1 RMSPPD Envi/ Infra Unrepairable computer desktop 1 1 Provision of computer desktop 1 CLMD Tech'l Instructional materials for uploading and publishing need review due to non-compliance to K to 12 competencies and standards. 1 1 Review and redevelop materials for alignment to K to 12 1 15
- 16. CLMD Envi/ Infra Exhausted computer memory causing slow performance 1 1 Request for an external hard drive 1 BFD Tech'l Delayed action of program coordinators on SARO’s received 1 1 Coordinators to immediately submit plans/programs (for which the SARO is intended for) when memo is sent/when reminded/when followed up 1 PPRD Tech'l No reports of the Quarterly Accomplishments and Status of the PAPs Implementation from the Schools Divisions and FD In- charge of the PAPs 1 1 Request for copies of reports to be furnished to PPRD 1 BFD Inst’l Late submission of vouchers for payments and budgetary requests. 1 Strictly implement the deadlines for submission of claims for payment and budgetary requests. 1 QAAD Inst'l Delay in submission of DTR because of delayed return of approved leave charged to COCs earned 1 Request for an improved processing of applications for leave 1 QAAD Inst'l QAAD keeps furnishing copies of memoranda and RMEA tools because FDs misplace/overlook them. 1 Request for the posting of memoranda about activities on the website that only involve Regional Personnel 1 RMSPPD Envi/ Infra Telephone no access for long distance calls 1 Request for access that is limited only to telephone nos. of Schools Divisions and Central Office (arrange with the Tel. Co.) 1 RMSPPD Financial No financial support for the Cultural Show during CVIRAA 1 Request from the Regional Management 1 TDD Inst'l Non-attendance of some target participants 1 Strictly implement the participants confirmation slip 1 Lessons Learned In carrying out outputs, the lessons learned by the Functional and Support Divisions from the factors that facilitate and hinder output accomplishments are the following: • Quality Assurance and Accountability Division and other FDs/SDs Timely planning contributes to successful implementation of set priorities. 16
- 17. Consultation, coordination, engagement, and collaboration with other chiefs and members of other functional divisions create an individual and collective productivity. • Curriculum and Learning Management Division Teamwork leads to successful accomplishment of goals. Careful planning leads to the attainment of excellent outputs. Time management is essential in the accomplishment of the desired output. Setting quality time and establishing agreement are vital so that planned activities are carefully pursued. Consistent monitoring and follow-up contribute to the attainment of the desired outputs. Life is nothing without prioritization. • Resource Mobilization Special Programs and Projects Division Performance shall be enhanced and quality outcome shall be successfully achieved with timely planning and implementation. Sharing and giving extra mile of sacrifices always lead us to a successful program implementation. • Training and Development Division Working on track with the plan leads to peak performance. Strong and sustained partnership lead to collaboration. • Policy Planning and Research Division Timely coordination with Division Planning Officers results to the following: prompt submission of desired required reports efficiency, effectiveness, and efficacy • Budget and Finance Division 17
- 18. Creating awareness of individual and organizational responsibility and accountability ensures on-time submission of required financial reports. • Field Effectiveness Division Functional Division Members should be fully aware of Functional Division Work Plan of every quarter. Being and keeping informed of funds for programs and projects and their timelines ensure timely attainment of outputs. 4.4 Education Resource Support Figure 1 shows that the Region, as of November 2012, had utilized around 91% of its almost 26 million pesos Maintenance and Other Operating Expenses (MOOE). The data in the figure implies that it is most likely that the Region shall have exhausted its total MOOE for 2012 considering that the report available during the conduct of End-of Year RMEA was only until November 2012. Figure 1 Status of Utilization of 2012 Regional MOOE As of November 2012 Total MOOE for 2012: P25, 852,000.00 18
- 19. Notice in Figure 1 that the Region spent almost 5.5 million for Printing and Binding. This amount was used to pay the reproduction and distribution of the last administration of Regional Achievement Test in March 2012. This amount can already be used for other expenses in 2013 because implementation of Regional Achievement Test is already discouraged. Among the MOOE expenditures, it is utilization of MOOE on Travel and Training that there is data by Functional Division (FD) and Support Division (SD). See Figure 2. Of the almost two million pesos utilized for travel and training in 2012, it is the CLMD, BFD, and Administrative Division that incurred the highest expense. On the other hand, the Office of the Assistant Regional Director, T&DD, and FED had the lowest expense on travel and training. The underlying reason that FED had low expense on Travel could be the decreased number of Technical Assistance (TA) visits that the Regional Field Technical Assistance Teams (RFTATs) held during the year. TA visits were minimized because most Functional Divisions (FDs) gave more focus on rolling out their respective systems like Quality Management System (QMS) for the QAAD, T&D System for T&DD, SBM Monitoring for FED, Planning and Budgeting Systems for PPRD and BFD, and Management of K to 12 Curriculum Implementation for the CLMD considering that SEMIT ends in June 2013. Figure 2 Utilization of 2012 Regional MOOE for Travel & Training As of November 2012 Total MOOE Spent for Travel and Training: P1, 988,537.37 19
- 20. 4.5 Education Outcomes Regional Performance Indicators • Access Access Indicators shown in Table 8 shows that Gross Enrolment Rate and Transition Rate of Secondary Level decreased in the School Year 2011-2012. Likewise, Transition Rate of Elementary also decreased. Although other Access Indicators have been increasing in School Year 2010-’11 and 2011-’12, they still fall below the planning standards except the Gross Enrolment Rate of Elementary Level. Table 8 Education Outcome under Access Performance Indicators Level of Education 2009- 2010 2010- 2011 2011- 2012 Remarks Difference between 2010-'11 & 2011-'12 Gross Enrolment Rate Kindergarten 67.14 79.58 93.69 Increasing 14.11 Elementary 94.07 104.2 108.2 Increasing 4.03 Secondary 65.85 66.68 66.59 Fluctuating -0.09 Net Enrolment Rate Kindergarten 57.01 76.98 81.44 Increasing 4.46 Elementary 76.09 84.77 89.16 Increasing 4.39 Secondary 42.68 43.97 44.71 Increasing 0.74 Apparent Intake Rate Elementary 121.9 131.02 143.4 Increasing 12.42 Net Intake Rate Elementary 51.61 61.01 72.68 Increasing 11.67 Transition Rate Elementary 98.26 103.95 97.61 Fluctuating -6.34 Secondary 99.35 105.06 93.32 Fluctuating -11.74 20
- 21. • Efficiency Cohort Survival Rate, Retention Rate, and Completion Rate, as shown in Table 9, had not improved in 2012. Table 9 Education Outcome under Efficiency INDICATORS ELEMENTARY SECONDARY SY 2010- 2011 SY 2011- 2012 Remarks SY 2010- 2011 SY 2011- 2012 Remarks Cohort Survival Rate 93.34 77.65 Decreased by 16.81% 81.62 64.47 Decreased by 21.01% Repetition Rate 5.21 4.85 Decreased by 6.91% 6 4.63 Decreased by 22.83% Drop Out Rate 1.59 1.29 Decreased by 18.87% 6.13 5.32 Decreased by 13.21% Retention Rate 99.33 87.75 Decreased by 11.66% 98.32 89.05 Decreased by 9.43% Completion Rate 93.34 77.65 Decreased by 16.81% 81.62 64.47 Decreased by 21.01% Graduation Rate 96.16 96.69 Increased by 0.55% 93.12 93.95 Increased by 0.89% • Quality Table 10 shows that Elementary level decreased in performance in Filipino, Mathematics, and HeKaSi so that the overall performance of the Region in the National Achievement Test decreased also. Although Regional Performance in English and Science decreased, overall performance of the Region in the Secondary Level still increased. However, the achievement rate of the Region in all subjects, whether elementary or secondary, still fall below the 75% proficiency level. Table 10 Comparative Academic Performance of the Region Mean Percentage Score in the National Achievement Test INDICATORS ELEMENTARY SECONDARY SY 2010- 2011 SY 2011- 2012 Remarks SY 2010- 2011 SY 2011- 2012 Remarks Regional 66.13 65.99 Decreased by 0.14 49.26 51.98 Increased by 2.72 English 63.45 65.88 Increased by 2.43 49.26 42.01 Decreased by 7.25 Filipino 75.45 67.75 Decreased by 7.7 48.80 53.09 Increased by 4.29 Science 56.35 65.64 Increased by 9.29 57.17 42.78 Decreased by 14.39 Math 67.24 66.50 Decreased by 0.74 40.87 68.74 Increased by 27.87 Hekasi/Aral Pan 68.15 64.19 Decreased by 3.96 43.05 55.54 Increased by 6.28 21
- 22. Another quality indicator is the Alternative Learning System Accreditation and Equivalency (ALS A&E) Results. Table 11 shows that more than 50% of the ALS A&E Takers in the School Year 2011-2012 passed the test. Table 11 ALS 2011-2012 A & E Results Level Takers Passers % Elementary 2,071 1,361 65.72 Secondary 14,732 8,136 55.23 TOTAL 16,803 9,497 56.52 5. 0 General Statements Education Programs and Projects The efficiency and effectiveness of the Regional Education Programs and Projects can best be determined by looking at the comprehensive details of implementation of work plans, regular M&E and TA Reports of the Program Coordinators of Regional Programs and Projects. Education Resources Success in governance such as in the provision of basic education resources to the field—teachers, classrooms, and seats--contributes to the improvement of access to, efficiency in and quality of education. Prompt release of funds, transparency on the availability of funds, and dedication ensure success in the implementation of assigned programs and projects. Organizational Effectiveness Quarterly RMEA, End-of-Year RMEA, regular REXECOM meetings and RFTAT conferences are avenues that provide objective information on the status of performance of each Functional or Support Division in particular and the whole Region in general. 22
- 23. Provision of technical assistance in the conduct of RMEA propels Functional and Support Divisions to write quality plans that enable them to carry out quality outputs. Quality M&E ensures that quality is maintained by the Functional and Support Divisions in discharging their accountabilities. Education Resource Support Effective management of MOOE minimizes if not eradicates repair and maintenance issues on office equipment like printer, computer, photocopying machine, telephone, and fax machine. Education Outcomes There must be underlying reasons why Access, Efficiency, and Quality Indicators of Regional Performance are decreasing or falling below planning standards. 6.0 Recommendations Education Programs and Projects 1. Program Coordinators of Regional Programs and Projects should report the details of implementation of prepared annual work plans and keep and submit M&E and TA Reports, including qualitative data that can be used to determine the efficiency and effectiveness of programs and projects in improving learning outcomes. 2. Program Coordinators should manage efficiently and maximize the use of support funds to ensure quality implementation of these programs and projects, and maximize expected results. Education Resources 1. The schools, schools divisions and the Region should keep consistent and comprehensive data on education resources —teachers, classrooms, seats, textbooks, learning guides and teaching guides. 2. Program Coordinators of Regional Programs and Projects should prepare annual work plans at the start of the year so that outputs to be carried out are already determined even if support funds for these programs and projects are not received yet. 3. Regional Program Coordinators should collaborate with Division counterparts in preparing work plans that support the release of SARO. 4. The Central Office should release funds to the Regions promptly. Organizational Effectiveness Member of the REXECOM take Quarterly RMEA, End-of-Year RMEA, regular REXECOM meetings and RFTAT conferences as priorities in order to ensure sustainability of strategies taught by STRIVE project and improvement of practices in planning, in M&E, resolving issues, celebrating promising practices, and in providing technical assistance to the field. FED is encouraged to spearhead the conduct of pre- and post-RFTAT conferences before and after conducting TA or M&E visits to Division Offices. The REXECOM can come up with standards and guidelines to follow in conducting RFTAT visits to the field. 23
- 24. Chiefs of Functional and Support Divisions ensure that with the help of the Internal M&E Team, there is prompt submission of adjusted work plans, physical output matrices, and means of verification of accomplished outputs. Functional and Support Divisions carry over unaccomplished outputs in 2013 such as follows: (1) validation and advocacy of CLMD’s RCLM taking into consideration the Intellectual Property Rights, and (2) Training of Trainers for SMEA. Functional and Support Divisions keep track of the outputs and their timelines to ensure prompt delivery of these outputs and submission of required reports to the Central Office. Functional and Support Divisions maximize the benefits of competency-based delegation of responsibilities and division of assignments. Functional and Support Divisions report at the End-of-Year RMEA the sustainability measures they’ve implemented in carrying out outputs and delivery of services. Functional and Support Divisions include all outputs inherent in that division to be able to keep track of the implementation of these accountabilities like the information on (1) the clientele’s use of the LRMDS portal; (2) the number of Region VII DepEd personnel’s request for stoppage of payroll deduction; and (3) the details of the distribution of instructional materials—textbooks, work books, learning and teaching guides— to school divisions. Representatives of Functional and Support Divisions to other Functional Divisions’ activities discuss comprehensively the concepts and skills learned to fellow team members through echo conference, mentoring or coaching. Regional personnel adopt transparency and honesty as strategies that guarantee quality outputs and services. Regional personnel observe protocol to ensure harmonious relationship with management and colleagues. Regional personnel adhere to DepED policies, guidelines, rules and regulations to ensure quality services. Regional personnel maintain cleanliness and orderliness of the Regional Office through 5S. Regional personnel serve clients with a smile. 24
- 25. Education Resource Support The Region adopts a long-term solution to repair, maintenance, and inadequacy issues of office equipment like printer, computer parts, photocopying machine, and telephone. Education Outcomes The RFTATs perform their TA accountabilities by doing the following: (1) gather and analyze data from schools divisions on why performance indicators on access, efficiency, and quality fall below standards; (2) write a TA plan to address low performance indicators; (3)provide technical assistance, and (4) conduct M&E. The Region through REXECOM can formulate policy on RFTAT to be approved by the Regional Management. 25
- 26. 26