SlideShare une entreprise Scribd logo
1  sur  9
Télécharger pour lire hors ligne
Kevin Tame
Mike Hill                                                                                                         Finance Group Project
Trevor Merritt                                                                                                               2/25/2010
Kassie Walkenhurst
David Clark
                                                                 Citizen Air
Question #1
        Citizen Air’s incredible rate of expansion has moved them from a small start up to a full fledge
major competitor to four major airlines. From 1982 to 1985 company sales increased by 668% while their
fleet increased to over 76. Over these years, they purchased a few smaller airlines and in 1985 purchased
Frontier. The competitive business strategy of Citizen was to provide reduced prices, excellent customer
service, and convenient flight schedules. Growth was center to their strategic plan and reaching a “critical
mass” was perceived as essential to their survival. With their rapid increase in sales, corporate officers
thought that in order to reach this “critical mass” purchasing more planes, hiring more employees, and
offering more fights was essential. This increase of sales lead to an increase in asset purchases which
required financing. The following is the analysis of Citizen Air’s financial statements.

Source and Use:
                                                  Source and Use of Funds Approximated

PERIOD                      1982-1983          1983-1984    1984-1985                                 1982-1983      1983-1984    1984-1985
SOURCES OF FUNDS                                                          USES OF FUNDS

Decrease In Assets                                                        Increase In Assets

Cash & Equivs.                                      48.58                 Cash & Equivs.                     73.74                     16.97
Notes/Accts.Rec.                                                          Notes/Accts.Rec.                    8.77        12.85        24.33
Inventories                                                               Inventories                         1.27         6.95         1.38
Other Current                                                     1.46    Other Current                       2.47        13.02

Tot. Prop./Equip                        0.00         0.00         0.00    Tot. Prop./Equip                  221.25       271.79        73.40
Intangibles                                                               Intangibles
Other Assets                                                              Other Assets                        9.03         0.41       119.49

Increase In Liabilities and Net Worth                                     Decrease In Liabilities and Net Worth

Accounts Payable                    34.28           24.36         7.30    Accounts Payable
Short Term Debt                      2.56           13.25                 Short Term Debt                                               8.01
Oth. Curr. Liab.                    11.85           17.08                 Oth. Curr. Liab.                                              2.61

Total Long Term Debt              186.76            78.91       175.92    Total Long Term Debt
Deferred Tax                                                              Deferred Tax
Other                                                            14.57    Other
Minority Interest                                                         Minority Interest

Preferred Stock                                      0.04                 Preferred Stock                                               0.04
Common Equity                       62.84           99.23         35.85   Common Equity
Income From Operations               6.45            1.65        -20.14   Dividend Payments                   0.00         5.31         9.55
Depreciation Expense                11.79           27.25         40.81

 Total Sources                    316.53           310.34       255.77     Total Uses of Funds              316.53       310.34       255.77
According to the Source and Use statement most of Citizen’s financing was accomplished by
longterm debt and the issuing of common stock. One major problem that Citizen Air faces is that by
financing expansion with long term debt they are increasing their interest expense significantly while not
increasing their operating income. As a result the have a negative interest burden and are paying double
the amount of their operating income to pay their interest expense. On top of all their interest expense
issues the company’s debt is becoming current and they have to decided to stretch out their suppliers by
delaying payment to their accounts payable in order to fund their short term cash needs.

         Citizen Air was not always in their current financial predicament. In 1983, they had their highest
percentage of cash and a high percentage of property and equipment which made them asset rich. If they
had put available funds into growing the company at a moderate pace they would not be in the financial
crisis they are in.


Dupont Analysis:
                                                      Dupont Analysis

Dupont Analysis
                             Margin     X Turnover    = ROI       / Leverage       = ROE          Price of Stock
                             NI/Sales     Sales/TA      NI/TA       (1 - TD/TA)      NI/Equity

                      1982      0.39%          1.09       0.42%          61.50%          1.10%      21.12499798
                      1983      2.25%          0.69       1.55%          75.48%          6.33%      20.87499677
                      1984      0.28%          0.92       0.26%          70.09%          0.86%       10.1249995
                      1985     -2.17%          1.10      -2.38%          75.05%         -9.55%            9.125

                             Tax          Interest
                             Burden       Burden        Margin     Turnover          Leverage     ROE
                             NI/EBT       EBT/EBIT      EBIT/Sales Sales/TA          TA/Equity

                      1982     53.99%         8.17%       8.83%             1.09           2.60            1.10%
                      1983     58.92%        49.04%       7.79%             0.69           4.08            6.33%
                      1984    -13.14%       -45.90%       4.66%             0.92           3.34            0.86%
                      1985     99.60%       -49.34%       4.42%             1.10           4.01           -9.55%


        The Dupont Analysis shows that the margin has decreased to -2.17% even though sales have
increased by 668%. This is a bad sign and much of the companies problems in this area can be attributed
to the interest burden that they are facing. Turnover on the other hand has fluctuating slightly but for the
most part has stayed fairly consistent. This is due to the fact that sales are increasing at a fairly even rate
compared to the company’s assets. The ROI is taking a hit because Net Income is suffering drastically
because the operating income cannot cover the interest expense the firm is incurring. The company is
highly leveraged and as a result interest expense is high. In the end the ROE has decreased from a high of
6.33% to -9.55%. The firm is loosing money and has no return on equity and the stock price is starting to
show signs of weakness. The decrease in stock price from 1983-1984 is a result of the stock being split but
the overall trend in price is still down.
Altman Test:
                                                   Altman Test
Ratios                                   1982                      1983               1984                  1985


Liquidity                              -0.0093                 0.1055               -0.0637               0.0151


Cummulative Profitability               -0.2183                -0.1005               -0.0880               -0.0926


Earning Power of Assets                0.3177                  0.1773               0.1413                0.1600


Leverage                               1.3021                  0.7965               0.2888                0.2105


Activity                               1.0888                  0.6887               0.9184                1.0963


Z Value (weighted sum)                 2.4810                  1.6675               1.1968                1.3893


        The major benefit to the Altman test is its ability to show the likelihood of a firm to go bankrupt.
If a firm has a “Z” score to 3.0, or greater, it is almost certain to be in the non-bankrupt category. If the
score is below 2.0 then it has a very high probability of becoming bankrupt. Between 2.0 and 3.0 firms
may go either way. The “Z” score for Citizen Air decreases over the years and falls way below what is
acceptable. This analysis shows that Citizen is most likely going to go bankrupt.

Internal and External Growth:
                                                    Growth Rates
                                                                                               4 Year
                                                                                               Weighted
                                1982              1983             1984     1985               Average
Internal Growth Rate           0.40%             1.60%         -0.60%      -3.40%                         -0.10%
Sustainable Growth             1.10%             6.80%         -1.90%     -12.30%                         -0.50%


        The internal growth rate and sustainable growth rate of the firm has drastically decreased from
1982-1985. The problem with sustainable growth is a direct result of a decrease in ROE and an increase
in dividend payout. Since the plowback ratio is increasing and ROE is dropping below zero the sustainable
growth of the firm is -12.3% in 1985. This is the same case with the internal growth. ROI is decreasing
below zero and the plowback is increasing. Paying a dividend with a negative ROI and ROE is going to
yield a non sustainable company.


Question #2
        The initial growth the Citizen Air saw was a result of carefully selecting routes that were not main
stream. It was not until Citizen grew so rapidly that they were forced to compete with the large companies
on routes that had been flown by them for over 20 years. Airlines, such as Northwest with deep pockets,
cut cost and increased the number of available flights in order to protect their stake in their bread and
butter routes. This made it hard for Citizen to compete in the highly successful areas. Citizen still hung
strong to the belief that they needed to expand but was not in any position to continue their growth at that
time. On top of pressure from other competitors, American Airlines eventually announced it’s Ultimate
Super Saver plan and put even greater strain on Citizen Air. At that point management felt they only had
two options to battle their decreasing loss of market share. One possibility was to develop new hubs,
thereby finally achieving a competitive nationally comprehensive route system, or by buying another
airline. The second option was to break off the battle, sell aircraft to raise cash, and invest in the further
development of the Newark hub, build a computerized reservation system and create a yield management
system.

         Since growth is center to their philosophical business strategy, Citizen Air did not like the idea of
downsizing and choose the option to purchase Frontier Airlines. They felt that they could successfully
integrate the service of Frontier into their own. However, the purchase of Frontier only added to their
problems. First of all, Citizen Air was structured as a single ticket option at a low cost where Frontier was
a traditional airline with business class and varied ticket price. This established system that Frontier had is
in contradiction with Citizen Air’s business structure. For one thing Frontier is highly unionized while
Citizen Air is not. Problems also arose with culture integration and general operations, and Frontier
eventually became a drain on Citizen Air’s funds.

       With growth comes many benefits and so comes its costs. For Citizen Air, their employees were
overworked and were starting to have family problems, become ill, and feel burned out. On top that
Customers were starting to become frustrated with Citizen Air’s facilities, and the problem of
overbooking. Citizen was trying to fit 1,000,000 people a month into a facility that could only handle
100,000. As a result, flights were cancelled, delayed and customers had to wait for hours in uncomfortable
conditions.

        The fact is that Citizen Air could not expand and needed to focus on the problems it already had
such as facilities, customer dissatisfaction, and high amounts of debt. However, they choose to purchase
Frontier. This combination of a highly volatile financial situation, customer decline, and a threat of
competitors ultimately will be the destruction of Citizen Air. At this point, they need significant financing
in order to continue growth. It is difficult to imagine where this financing will come from. If they take out
any more loans their interest expense will skyrocket even more then it already is. They cannot turn to
stretching their suppliers anymore because they are most likely already upset. The use of accounts payable
to fiance growth is a short term and dangerous approach. The truth is market share has already been lost
and is going to continue to be lost. Citizen’s sustainability is now the real question at hand. They should
not be concerned about losing their market share but should be concerned about survival.

Question #3 (see also Decision tree on next page)
        The first step in improving the situation would be to stop any dividends payments. Next, selling of
Frontier, if at all possible, will alleviate the financial and cultural strain that is causes. This was a poor
purchase to begin with and if it can be sold quickly then their might be a chance of potential turn around.
Next, making overall operations more efficient would help lower cost. The problem of over booking and
unsatisfied customers will eventually lead to failure. Finally, the last step is downsizing. Slow down the
growth and let the company get back on its feet. Ultimately, these solutions are not guaranteed and Citizen
Air’s situation might be beyond the point of no return.
Ratios Based On Year End Data
Period                                      1982         1983       1984      1985     4 Year


DuPont Ratios
Return On Investment                       0.40%        1.60%     0.30%     -2.40%    -0.50%
Return On Equity                           1.10%        6.30%     0.90%     -9.50%    -2.20%
Profit Margin                               0.40%        2.30%     0.30%     -2.20%    -0.30%
Total Asset Turnover                         1.09         0.69      0.92      1.10   96.20%
Leverage Ratio (TD/TA)                    61.50%       75.50%    70.10%    75.10%    72.30%


Income Ratios
Tax Burden                                54.00%       58.90%    -13.10%   99.60%    53.10%
Interest Burden                            8.20%       49.00%    -45.90%   -49.30%   -22.90%
Degree of Fin Leverage                      12.24         2.04     -2.18     -2.03   16.80%
Operating Margin                           8.80%        7.80%     4.70%     4.40%     5.60%
Cash Flow To Common Eq.                      0.16         0.18      0.12      0.07   11.80%
Interest Coverage                            1.09         1.96      0.69      0.67   97.50%
Total Dividend Payout                      0.00%        0.00%    322.40%   -47.40%   77.70%
Common Dividend Payout                     0.00%        0.00%     0.00%    -19.40%    -7.80%
Effective Tax Rate                        46.00%       41.10%     -2.00%    0.40%    12.40%


Asset Ratios


Fixed Asset Turnover                         1.28         0.95      1.09      1.58      1.28
Degree of Op Leverage                                     1.70      0.05      1.78      1.07
Acc. Depr As % Gross Plant                 7.89%        6.54%     7.91%    12.40%     9.43%
Acc Depr/Depr Exp (Asset Age)                1.26         1.79      1.70      2.03      1.81
Current Asset Turnover                       7.92         2.76      6.67      7.18      6.22
Current Ratio                                0.95         1.54      0.72      1.09      1.06
Ouick Ratio                                  0.91         1.52      0.65      1.00      0.99
Accounts Recievable Turnover                48.08        24.58     23.95     19.00     24.51
Accounts Recievable Collection               7.59        14.85     15.24     19.21     15.99
Inventory Turnover (Sales)                 229.52       153.01     66.50     90.91    109.87
Inventory Turnover (COGS)                  159.13       105.86     48.67     65.49     77.88
Cash Turnover                               31.65       109.25     23.14     21.31     40.48
Working Cap Turnover                       309.25       286.84    113.58    131.23    174.86


Leverage Ratios
Assets to Equity                             2.60         4.08      3.34      4.01      3.68
Current Debt To Total Debt                23.64%       21.42%    27.25%    18.69%    22.30%
A/P Turnover (COGS)                         25.34        75.40     55.52     39.66     50.13
A/P Turnover (Purchases)                                 74.92     54.63     39.57     47.20
LTD to Assets                             47.00%       59.30%    51.00%    61.00%    56.27%
Net Debt Repay Ability (Yrs)                 8.33        12.50     14.20     28.08     18.83
Funded Debt to Capital                    55.00%       70.80%    63.00%    71.00%    66.95%
Preferred to Capital                       0.00%        0.00%     0.00%     0.00%     0.00%
Common Eq. To Capital                     45.00%       29.20%    37.00%    29.00%    33.05%
LTD To Equity                                1.22         2.42      1.71      2.45      2.10


Altman Ratios
Working Capital/T. Assets                 -0.78%        8.79%     -5.31%    1.26%     0.59%
RE/TA                                    -15.60%       -7.18%     -6.28%    -6.61%    -7.53%
EBIT/TA                                    9.63%        5.37%     4.28%     4.85%     5.26%
Mkt Value Eq/Book Value TD               217.02%      132.75%    48.13%    35.09%    76.73%
Sales/TA                                 108.99%       68.94%    91.93%    109.74%   96.16%
Common Size Income and Balance Sheet (as a percent of Sales)

INCOME STATEMENT
                                                                                                     4 Year
PERIOD                                              1982         1983         1984        1985       Weighted
Fiscal Year Ends                                                                                     Average

Sales                                            100.00%      100.00%      100.00%     100.00%             100.00%
Cost of Goods Sold                                69.30%       69.20%       73.20%      72.00%              71.50%
 Gross Margin                                     30.70%       30.80%       26.80%      28.00%              28.50%

Sell./Gen./Admin.                                 17.80%       19.90%       18.70%      20.00%              19.40%
Depreciation and Amort                             5.30%        4.10%        4.60%       4.40%               4.50%
 Total Expenses                                   23.10%       24.00%       23.40%      24.40%              23.90%

Operating Income                                   7.53%        6.85%        3.44%        3.60%              4.60%
Other Income                                       1.30%        0.90%        1.20%        0.80%              1.00%
Interest Expense                                   8.10%        4.00%        6.80%        6.60%              6.30%
EBIT                                               0.70%        3.80%       -2.10%       -2.20%             -0.70%
Minortity Interest                                 0.00%        0.00%        0.00%        0.00%              0.00%
Income Taxes                                       0.30%        1.60%        0.00%        0.00%              0.40%
Special Inc or Exp                                 0.00%        0.00%        2.50%        0.00%              0.70%

Net Income                                         0.40%        2.30%       0.30%        -2.20%             -1.80%
Extra Ordinary Income                              0.30%        1.40%       0.00%         0.00%              0.30%

Total Income                                       0.70%        3.60%        0.30%       -2.20%             -1.50%
Cash Dividends (% Income)                          0.00%        0.00%      322.40%      -47.40%             77.70%

BALANCE SHEET (as percent of Sales)                                                                  4 Year
                                                                                                     Weighted
PERIOD                                              1982         1983         1984        1985       Average

ASSETS:
Cash & Equivs.                                     8.70%       29.90%        6.30%       5.80%              11.10%
Accts.Rec.                                         2.10%        4.10%        4.20%       5.30%               4.40%
Inventories                                        0.40%        0.70%        1.50%       1.10%               1.10%
Other Current Assets                               1.40%        1.60%        3.00%       1.70%               2.00%
Total Current Assets                              12.60%       36.20%       15.00%      13.90%              18.60%

Tot. Prop./Equip                                  85.10%      112.70%       99.90%      72.10%              89.90%
Depreciation                                       6.70%        7.40%        7.90%       8.90%               8.10%
  Net Prop./Equip                                 78.40%      105.40%       92.00%      63.20%              81.80%
Intangibles                                        0.00%        0.00%        0.00%       0.00%               0.00%
Other Assets                                       0.70%        3.50%        1.80%      14.00%               6.90%
Total Assets                                      91.80%      145.10%      108.80%      91.10%             107.30%

LIABILITIES:
Accounts Payable                                   4.80%       14.30%       11.10%       7.80%               9.80%
Short Term Debt                                    5.10%        3.40%        3.90%       1.60%               3.00%
Other Current Liab                                 3.40%        5.80%        5.70%       3.30%               4.60%
Total Current Liabs                               13.30%       23.50%       20.80%      12.80%              17.40%

Total Long Term Debt                              43.10%       86.00%       55.50%      54.00%              59.80%
Deferred Tax                                       0.00%        0.00%        0.00%       0.00%               0.00%
Other                                              0.00%        0.00%        0.00%       1.60%               0.60%
Minority Interest                                  0.00%        0.00%        0.00%       0.00%               0.00%
Total Long Term                                   43.10%       86.00%       55.50%      55.60%              60.40%

Total Liabilities                                 56.40%      109.50%       76.20%      68.40%              77.80%

Preferred Stock                                    0.00%        0.00%        0.00%       0.00%               0.00%
Common Stock                                      49.60%       46.00%       39.40%      28.80%              37.50%
Retained Erngs.                                  -14.30%      -10.40%       -6.80%      -6.00%              -8.00%
Treasury Stock                                     0.00%        0.00%        0.00%       0.00%               0.00%
Total Equity                                      35.30%       35.60%       32.50%      22.70%              29.50%

Total Liab. And Equity                            91.80%      145.10%      108.80%      91.10%             107.30%
Common Size Balance Sheet (as percent of Assets)

BALANCE SHEET (as percent of Assets)                                                                      4 Year
                                                                                                          Weighted
PERIOD                                            1982         1983         1984        1985              Average

ASSETS:
Cash & Equivs.                                   9.50%       20.60%        5.80%       6.40%                      9.40%
Accts.Rec.                                       2.30%        2.80%        3.80%       5.80%                      4.20%
Inventories                                      0.50%        0.50%        1.40%       1.20%                      1.00%
Other Current Assets                             1.60%        1.10%        2.70%       1.90%                      2.00%
Total Current Assets                            13.80%       25.00%       13.80%      15.30%                     16.60%

Tot. Prop./Equip                                92.80%       77.70%       91.80%      79.20%                     84.00%
Depreciation                                     7.30%        5.10%        7.30%       9.80%                      7.90%
  Net Prop./Equip                               85.50%       72.60%       84.60%      69.30%                     76.20%
Intangibles                                      0.00%        0.00%        0.00%       0.00%                      0.00%
Other Assets                                     0.80%        2.40%        1.60%      15.40%                      7.20%
Total Assets                                   100.00%      100.00%      100.00%     100.00%                    100.00%

LIABILITIES:
Accounts Payable                                 5.25%        9.85%       10.23%       8.59%                      9.00%
Short Term Debt                                  5.56%        2.32%        3.59%       1.76%                      2.80%
Other Current Liab                               3.73%        3.99%        5.28%       3.68%                      4.20%
Total Current Liabs                             14.54%       16.17%       19.10%      14.03%                     16.00%

Total Long Term Debt                            46.96%       59.31%       50.99%      59.30%                     55.60%
Deferred Tax                                     0.00%        0.00%        0.00%       0.00%                      0.00%
Other                                            0.00%        0.00%        0.00%       1.72%                      0.70%
Minority Interest                                0.00%        0.00%        0.00%       0.00%                      0.00%
Total Long Term                                 46.96%       59.31%       50.99%      61.03%                     56.30%

Total Liabilities                               61.50%       75.48%       70.09%      75.05%                     72.30%

Preferred Stock                                  0.00%        0.00%        0.01%       0.00%                      0.00%
Common Stock                                    54.09%       31.69%       36.19%      31.56%                     35.20%
Retained Erngs.                                -15.60%       -7.18%       -6.28%      -6.61%                     -7.50%
Treasury Stock                                   0.00%        0.00%        0.00%       0.00%                      0.00%
Total Equity                                    38.50%       24.52%       29.91%      24.95%                     27.70%

Total Liab. And Equity                         100.00%      100.00%      100.00%     100.00%                    100.00%


List of Key take aways:

Interest Coverage Ratio is on avg 97% and declining over last 2 years. This may be a factor in taking out
new loans.


Acquiring companies with contradictory cultures. (purchasing a highly unionized company when they are
not unionized)


   •        Initial growth because CA was careful in rout selection and stayed away from routs occupied by
            the larger airlines

                ◦        In attempts to reach "critical mass" they would try to start competing head to head with the
                         giants but would be unable to offer the heavy discounts their airline was based around
•   Their strategic model was lost as they moved into direct competition with the majors.

      ◦    debt from excessive growth caused them to abandon their key philosophies

Contenu connexe

Tendances

Key performance indicators 04 01 2013
Key performance indicators   04 01 2013Key performance indicators   04 01 2013
Key performance indicators 04 01 2013ridabsha
 
1998Narrativepgs02-22 auto nation
1998Narrativepgs02-22 auto nation1998Narrativepgs02-22 auto nation
1998Narrativepgs02-22 auto nationfinance14
 
regions library.corporat
regions  library.corporatregions  library.corporat
regions library.corporatfinance25
 
Stephen Heath
Stephen Heath Stephen Heath
Stephen Heath spaaweb
 
auto owners 2005_annual_report
auto owners  2005_annual_reportauto owners  2005_annual_report
auto owners 2005_annual_reportfinance40
 
Valuation Scenarios
Valuation ScenariosValuation Scenarios
Valuation Scenariosukabuka
 
smithfield food 2001 AR
smithfield food  2001 ARsmithfield food  2001 AR
smithfield food 2001 ARfinance23
 
dollar general annual reports 2002
dollar general annual reports 2002dollar general annual reports 2002
dollar general annual reports 2002finance41
 
Progressive 2Q 05 QSR
Progressive 2Q 05 QSRProgressive 2Q 05 QSR
Progressive 2Q 05 QSRfinance18
 
Archies ppt (1)(1)
Archies ppt (1)(1)Archies ppt (1)(1)
Archies ppt (1)(1)vrutant
 
erie insurance group 2007-second-quarter-report
erie insurance group 2007-second-quarter-reporterie insurance group 2007-second-quarter-report
erie insurance group 2007-second-quarter-reportfinance49
 
allstate Quarter Information 2008 1st Earnings Press Release
allstate Quarter Information  2008 1st Earnings Press Releaseallstate Quarter Information  2008 1st Earnings Press Release
allstate Quarter Information 2008 1st Earnings Press Releasefinance7
 
Finance reporting analysis
Finance reporting analysisFinance reporting analysis
Finance reporting analysisKuldeep Yadav
 

Tendances (15)

Key performance indicators 04 01 2013
Key performance indicators   04 01 2013Key performance indicators   04 01 2013
Key performance indicators 04 01 2013
 
1998Narrativepgs02-22 auto nation
1998Narrativepgs02-22 auto nation1998Narrativepgs02-22 auto nation
1998Narrativepgs02-22 auto nation
 
regions library.corporat
regions  library.corporatregions  library.corporat
regions library.corporat
 
Stephen Heath
Stephen Heath Stephen Heath
Stephen Heath
 
auto owners 2005_annual_report
auto owners  2005_annual_reportauto owners  2005_annual_report
auto owners 2005_annual_report
 
STATE BANK OF INDIA-ANALYSIS by www.capitalheight.com
STATE BANK OF INDIA-ANALYSIS by www.capitalheight.comSTATE BANK OF INDIA-ANALYSIS by www.capitalheight.com
STATE BANK OF INDIA-ANALYSIS by www.capitalheight.com
 
Valuation Scenarios
Valuation ScenariosValuation Scenarios
Valuation Scenarios
 
smithfield food 2001 AR
smithfield food  2001 ARsmithfield food  2001 AR
smithfield food 2001 AR
 
dollar general annual reports 2002
dollar general annual reports 2002dollar general annual reports 2002
dollar general annual reports 2002
 
Progressive 2Q 05 QSR
Progressive 2Q 05 QSRProgressive 2Q 05 QSR
Progressive 2Q 05 QSR
 
Archies ppt (1)(1)
Archies ppt (1)(1)Archies ppt (1)(1)
Archies ppt (1)(1)
 
erie insurance group 2007-second-quarter-report
erie insurance group 2007-second-quarter-reporterie insurance group 2007-second-quarter-report
erie insurance group 2007-second-quarter-report
 
credit-suisse Annual Report Part 3
credit-suisse Annual Report Part 3credit-suisse Annual Report Part 3
credit-suisse Annual Report Part 3
 
allstate Quarter Information 2008 1st Earnings Press Release
allstate Quarter Information  2008 1st Earnings Press Releaseallstate Quarter Information  2008 1st Earnings Press Release
allstate Quarter Information 2008 1st Earnings Press Release
 
Finance reporting analysis
Finance reporting analysisFinance reporting analysis
Finance reporting analysis
 

Similaire à Citizen Air/People Express Final

Haseeb project fm new
Haseeb project fm newHaseeb project fm new
Haseeb project fm newMoezza A
 
Cipla is a leading pharmaceutical company in india with a strong and profitab...
Cipla is a leading pharmaceutical company in india with a strong and profitab...Cipla is a leading pharmaceutical company in india with a strong and profitab...
Cipla is a leading pharmaceutical company in india with a strong and profitab...Mayank Gupt
 
ual Annual Report2001
ual Annual Report2001ual Annual Report2001
ual Annual Report2001finance13
 
Silver river manufacturing company
Silver river manufacturing companySilver river manufacturing company
Silver river manufacturing companyPawan Kawan
 
Accounts
AccountsAccounts
Accountsloma22
 
Measurement of performance of bharti airtel by using different ratios
Measurement of performance of bharti airtel by using different ratiosMeasurement of performance of bharti airtel by using different ratios
Measurement of performance of bharti airtel by using different ratiosPartha Pratim Mahanta
 
Ch 14 financial management notes
Ch 14 financial management notesCh 14 financial management notes
Ch 14 financial management notesBabasab Patil
 
Financial analysis coal india
Financial analysis coal indiaFinancial analysis coal india
Financial analysis coal indiaShoaib Shaikh
 
northan trust corp.2005SummaryAnnual
northan trust corp.2005SummaryAnnualnorthan trust corp.2005SummaryAnnual
northan trust corp.2005SummaryAnnualfinance38
 
Maruti analysis
Maruti analysisMaruti analysis
Maruti analysisprasadbaba
 
Banco ABC - 3rd Quarter 2009 Earnings Presentation
Banco ABC - 3rd Quarter 2009 Earnings PresentationBanco ABC - 3rd Quarter 2009 Earnings Presentation
Banco ABC - 3rd Quarter 2009 Earnings PresentationBanco ABC Brasil
 
1Q10 Presentation
1Q10 Presentation  1Q10 Presentation
1Q10 Presentation Gafisa RI !
 
1Q10 Earnings Results Presentation
1Q10 Earnings Results Presentation1Q10 Earnings Results Presentation
1Q10 Earnings Results PresentationGafisa RI !
 
Consulado noruega
Consulado noruegaConsulado noruega
Consulado noruegaPetrobras
 
15 09-2008 Almir Guilherme Barbassa - Supply Chain for the Pre-salt Developme...
15 09-2008 Almir Guilherme Barbassa - Supply Chain for the Pre-salt Developme...15 09-2008 Almir Guilherme Barbassa - Supply Chain for the Pre-salt Developme...
15 09-2008 Almir Guilherme Barbassa - Supply Chain for the Pre-salt Developme...Petrobras
 
northan trust corp._Financial_web_2006
northan trust corp._Financial_web_2006northan trust corp._Financial_web_2006
northan trust corp._Financial_web_2006finance38
 
Maruti balance sheet analysis
Maruti balance sheet analysisMaruti balance sheet analysis
Maruti balance sheet analysisPranab Sarkar
 

Similaire à Citizen Air/People Express Final (20)

Haseeb project fm new
Haseeb project fm newHaseeb project fm new
Haseeb project fm new
 
Stock Analysis - Tata Motors Special Report By www.capitalheight.com
Stock Analysis -  Tata Motors Special Report By www.capitalheight.comStock Analysis -  Tata Motors Special Report By www.capitalheight.com
Stock Analysis - Tata Motors Special Report By www.capitalheight.com
 
Cipla is a leading pharmaceutical company in india with a strong and profitab...
Cipla is a leading pharmaceutical company in india with a strong and profitab...Cipla is a leading pharmaceutical company in india with a strong and profitab...
Cipla is a leading pharmaceutical company in india with a strong and profitab...
 
ual Annual Report2001
ual Annual Report2001ual Annual Report2001
ual Annual Report2001
 
Silver river manufacturing company
Silver river manufacturing companySilver river manufacturing company
Silver river manufacturing company
 
Accounts
AccountsAccounts
Accounts
 
Kansai Nerolac Paints
Kansai Nerolac PaintsKansai Nerolac Paints
Kansai Nerolac Paints
 
Measurement of performance of bharti airtel by using different ratios
Measurement of performance of bharti airtel by using different ratiosMeasurement of performance of bharti airtel by using different ratios
Measurement of performance of bharti airtel by using different ratios
 
Ch 14 financial management notes
Ch 14 financial management notesCh 14 financial management notes
Ch 14 financial management notes
 
Financial analysis coal india
Financial analysis coal indiaFinancial analysis coal india
Financial analysis coal india
 
northan trust corp.2005SummaryAnnual
northan trust corp.2005SummaryAnnualnorthan trust corp.2005SummaryAnnual
northan trust corp.2005SummaryAnnual
 
itw_q205
itw_q205itw_q205
itw_q205
 
Maruti analysis
Maruti analysisMaruti analysis
Maruti analysis
 
Banco ABC - 3rd Quarter 2009 Earnings Presentation
Banco ABC - 3rd Quarter 2009 Earnings PresentationBanco ABC - 3rd Quarter 2009 Earnings Presentation
Banco ABC - 3rd Quarter 2009 Earnings Presentation
 
1Q10 Presentation
1Q10 Presentation  1Q10 Presentation
1Q10 Presentation
 
1Q10 Earnings Results Presentation
1Q10 Earnings Results Presentation1Q10 Earnings Results Presentation
1Q10 Earnings Results Presentation
 
Consulado noruega
Consulado noruegaConsulado noruega
Consulado noruega
 
15 09-2008 Almir Guilherme Barbassa - Supply Chain for the Pre-salt Developme...
15 09-2008 Almir Guilherme Barbassa - Supply Chain for the Pre-salt Developme...15 09-2008 Almir Guilherme Barbassa - Supply Chain for the Pre-salt Developme...
15 09-2008 Almir Guilherme Barbassa - Supply Chain for the Pre-salt Developme...
 
northan trust corp._Financial_web_2006
northan trust corp._Financial_web_2006northan trust corp._Financial_web_2006
northan trust corp._Financial_web_2006
 
Maruti balance sheet analysis
Maruti balance sheet analysisMaruti balance sheet analysis
Maruti balance sheet analysis
 

Dernier

Horngren’s Financial & Managerial Accounting, 7th edition by Miller-Nobles so...
Horngren’s Financial & Managerial Accounting, 7th edition by Miller-Nobles so...Horngren’s Financial & Managerial Accounting, 7th edition by Miller-Nobles so...
Horngren’s Financial & Managerial Accounting, 7th edition by Miller-Nobles so...ssuserf63bd7
 
Data Analytics Strategy Toolkit and Templates
Data Analytics Strategy Toolkit and TemplatesData Analytics Strategy Toolkit and Templates
Data Analytics Strategy Toolkit and TemplatesAurelien Domont, MBA
 
Driving Business Impact for PMs with Jon Harmer
Driving Business Impact for PMs with Jon HarmerDriving Business Impact for PMs with Jon Harmer
Driving Business Impact for PMs with Jon HarmerAggregage
 
EUDR Info Meeting Ethiopian coffee exporters
EUDR Info Meeting Ethiopian coffee exportersEUDR Info Meeting Ethiopian coffee exporters
EUDR Info Meeting Ethiopian coffee exportersPeter Horsten
 
Types of Cyberattacks - ASG I.T. Consulting.pdf
Types of Cyberattacks - ASG I.T. Consulting.pdfTypes of Cyberattacks - ASG I.T. Consulting.pdf
Types of Cyberattacks - ASG I.T. Consulting.pdfASGITConsulting
 
How To Simplify Your Scheduling with AI Calendarfly The Hassle-Free Online Bo...
How To Simplify Your Scheduling with AI Calendarfly The Hassle-Free Online Bo...How To Simplify Your Scheduling with AI Calendarfly The Hassle-Free Online Bo...
How To Simplify Your Scheduling with AI Calendarfly The Hassle-Free Online Bo...SOFTTECHHUB
 
Healthcare Feb. & Mar. Healthcare Newsletter
Healthcare Feb. & Mar. Healthcare NewsletterHealthcare Feb. & Mar. Healthcare Newsletter
Healthcare Feb. & Mar. Healthcare NewsletterJamesConcepcion7
 
14680-51-4.pdf Good quality CAS Good quality CAS
14680-51-4.pdf  Good  quality CAS Good  quality CAS14680-51-4.pdf  Good  quality CAS Good  quality CAS
14680-51-4.pdf Good quality CAS Good quality CAScathy664059
 
Environmental Impact Of Rotary Screw Compressors
Environmental Impact Of Rotary Screw CompressorsEnvironmental Impact Of Rotary Screw Compressors
Environmental Impact Of Rotary Screw Compressorselgieurope
 
Onemonitar Android Spy App Features: Explore Advanced Monitoring Capabilities
Onemonitar Android Spy App Features: Explore Advanced Monitoring CapabilitiesOnemonitar Android Spy App Features: Explore Advanced Monitoring Capabilities
Onemonitar Android Spy App Features: Explore Advanced Monitoring CapabilitiesOne Monitar
 
Fordham -How effective decision-making is within the IT department - Analysis...
Fordham -How effective decision-making is within the IT department - Analysis...Fordham -How effective decision-making is within the IT department - Analysis...
Fordham -How effective decision-making is within the IT department - Analysis...Peter Ward
 
Interoperability and ecosystems: Assembling the industrial metaverse
Interoperability and ecosystems:  Assembling the industrial metaverseInteroperability and ecosystems:  Assembling the industrial metaverse
Interoperability and ecosystems: Assembling the industrial metaverseSiemens
 
Jewish Resources in the Family Resource Centre
Jewish Resources in the Family Resource CentreJewish Resources in the Family Resource Centre
Jewish Resources in the Family Resource CentreNZSG
 
NAB Show Exhibitor List 2024 - Exhibitors Data
NAB Show Exhibitor List 2024 - Exhibitors DataNAB Show Exhibitor List 2024 - Exhibitors Data
NAB Show Exhibitor List 2024 - Exhibitors DataExhibitors Data
 
Guide Complete Set of Residential Architectural Drawings PDF
Guide Complete Set of Residential Architectural Drawings PDFGuide Complete Set of Residential Architectural Drawings PDF
Guide Complete Set of Residential Architectural Drawings PDFChandresh Chudasama
 
Effective Strategies for Maximizing Your Profit When Selling Gold Jewelry
Effective Strategies for Maximizing Your Profit When Selling Gold JewelryEffective Strategies for Maximizing Your Profit When Selling Gold Jewelry
Effective Strategies for Maximizing Your Profit When Selling Gold JewelryWhittensFineJewelry1
 
Technical Leaders - Working with the Management Team
Technical Leaders - Working with the Management TeamTechnical Leaders - Working with the Management Team
Technical Leaders - Working with the Management TeamArik Fletcher
 
The-Ethical-issues-ghhhhhhhhjof-Byjus.pptx
The-Ethical-issues-ghhhhhhhhjof-Byjus.pptxThe-Ethical-issues-ghhhhhhhhjof-Byjus.pptx
The-Ethical-issues-ghhhhhhhhjof-Byjus.pptxmbikashkanyari
 
The McKinsey 7S Framework: A Holistic Approach to Harmonizing All Parts of th...
The McKinsey 7S Framework: A Holistic Approach to Harmonizing All Parts of th...The McKinsey 7S Framework: A Holistic Approach to Harmonizing All Parts of th...
The McKinsey 7S Framework: A Holistic Approach to Harmonizing All Parts of th...Operational Excellence Consulting
 
Intermediate Accounting, Volume 2, 13th Canadian Edition by Donald E. Kieso t...
Intermediate Accounting, Volume 2, 13th Canadian Edition by Donald E. Kieso t...Intermediate Accounting, Volume 2, 13th Canadian Edition by Donald E. Kieso t...
Intermediate Accounting, Volume 2, 13th Canadian Edition by Donald E. Kieso t...ssuserf63bd7
 

Dernier (20)

Horngren’s Financial & Managerial Accounting, 7th edition by Miller-Nobles so...
Horngren’s Financial & Managerial Accounting, 7th edition by Miller-Nobles so...Horngren’s Financial & Managerial Accounting, 7th edition by Miller-Nobles so...
Horngren’s Financial & Managerial Accounting, 7th edition by Miller-Nobles so...
 
Data Analytics Strategy Toolkit and Templates
Data Analytics Strategy Toolkit and TemplatesData Analytics Strategy Toolkit and Templates
Data Analytics Strategy Toolkit and Templates
 
Driving Business Impact for PMs with Jon Harmer
Driving Business Impact for PMs with Jon HarmerDriving Business Impact for PMs with Jon Harmer
Driving Business Impact for PMs with Jon Harmer
 
EUDR Info Meeting Ethiopian coffee exporters
EUDR Info Meeting Ethiopian coffee exportersEUDR Info Meeting Ethiopian coffee exporters
EUDR Info Meeting Ethiopian coffee exporters
 
Types of Cyberattacks - ASG I.T. Consulting.pdf
Types of Cyberattacks - ASG I.T. Consulting.pdfTypes of Cyberattacks - ASG I.T. Consulting.pdf
Types of Cyberattacks - ASG I.T. Consulting.pdf
 
How To Simplify Your Scheduling with AI Calendarfly The Hassle-Free Online Bo...
How To Simplify Your Scheduling with AI Calendarfly The Hassle-Free Online Bo...How To Simplify Your Scheduling with AI Calendarfly The Hassle-Free Online Bo...
How To Simplify Your Scheduling with AI Calendarfly The Hassle-Free Online Bo...
 
Healthcare Feb. & Mar. Healthcare Newsletter
Healthcare Feb. & Mar. Healthcare NewsletterHealthcare Feb. & Mar. Healthcare Newsletter
Healthcare Feb. & Mar. Healthcare Newsletter
 
14680-51-4.pdf Good quality CAS Good quality CAS
14680-51-4.pdf  Good  quality CAS Good  quality CAS14680-51-4.pdf  Good  quality CAS Good  quality CAS
14680-51-4.pdf Good quality CAS Good quality CAS
 
Environmental Impact Of Rotary Screw Compressors
Environmental Impact Of Rotary Screw CompressorsEnvironmental Impact Of Rotary Screw Compressors
Environmental Impact Of Rotary Screw Compressors
 
Onemonitar Android Spy App Features: Explore Advanced Monitoring Capabilities
Onemonitar Android Spy App Features: Explore Advanced Monitoring CapabilitiesOnemonitar Android Spy App Features: Explore Advanced Monitoring Capabilities
Onemonitar Android Spy App Features: Explore Advanced Monitoring Capabilities
 
Fordham -How effective decision-making is within the IT department - Analysis...
Fordham -How effective decision-making is within the IT department - Analysis...Fordham -How effective decision-making is within the IT department - Analysis...
Fordham -How effective decision-making is within the IT department - Analysis...
 
Interoperability and ecosystems: Assembling the industrial metaverse
Interoperability and ecosystems:  Assembling the industrial metaverseInteroperability and ecosystems:  Assembling the industrial metaverse
Interoperability and ecosystems: Assembling the industrial metaverse
 
Jewish Resources in the Family Resource Centre
Jewish Resources in the Family Resource CentreJewish Resources in the Family Resource Centre
Jewish Resources in the Family Resource Centre
 
NAB Show Exhibitor List 2024 - Exhibitors Data
NAB Show Exhibitor List 2024 - Exhibitors DataNAB Show Exhibitor List 2024 - Exhibitors Data
NAB Show Exhibitor List 2024 - Exhibitors Data
 
Guide Complete Set of Residential Architectural Drawings PDF
Guide Complete Set of Residential Architectural Drawings PDFGuide Complete Set of Residential Architectural Drawings PDF
Guide Complete Set of Residential Architectural Drawings PDF
 
Effective Strategies for Maximizing Your Profit When Selling Gold Jewelry
Effective Strategies for Maximizing Your Profit When Selling Gold JewelryEffective Strategies for Maximizing Your Profit When Selling Gold Jewelry
Effective Strategies for Maximizing Your Profit When Selling Gold Jewelry
 
Technical Leaders - Working with the Management Team
Technical Leaders - Working with the Management TeamTechnical Leaders - Working with the Management Team
Technical Leaders - Working with the Management Team
 
The-Ethical-issues-ghhhhhhhhjof-Byjus.pptx
The-Ethical-issues-ghhhhhhhhjof-Byjus.pptxThe-Ethical-issues-ghhhhhhhhjof-Byjus.pptx
The-Ethical-issues-ghhhhhhhhjof-Byjus.pptx
 
The McKinsey 7S Framework: A Holistic Approach to Harmonizing All Parts of th...
The McKinsey 7S Framework: A Holistic Approach to Harmonizing All Parts of th...The McKinsey 7S Framework: A Holistic Approach to Harmonizing All Parts of th...
The McKinsey 7S Framework: A Holistic Approach to Harmonizing All Parts of th...
 
Intermediate Accounting, Volume 2, 13th Canadian Edition by Donald E. Kieso t...
Intermediate Accounting, Volume 2, 13th Canadian Edition by Donald E. Kieso t...Intermediate Accounting, Volume 2, 13th Canadian Edition by Donald E. Kieso t...
Intermediate Accounting, Volume 2, 13th Canadian Edition by Donald E. Kieso t...
 

Citizen Air/People Express Final

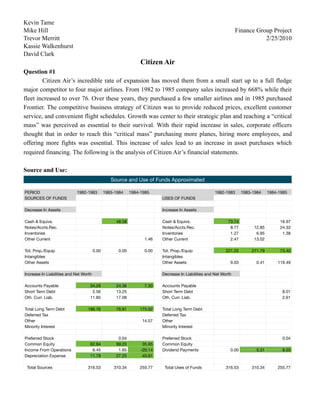
  • 1. Kevin Tame Mike Hill Finance Group Project Trevor Merritt 2/25/2010 Kassie Walkenhurst David Clark Citizen Air Question #1 Citizen Air’s incredible rate of expansion has moved them from a small start up to a full fledge major competitor to four major airlines. From 1982 to 1985 company sales increased by 668% while their fleet increased to over 76. Over these years, they purchased a few smaller airlines and in 1985 purchased Frontier. The competitive business strategy of Citizen was to provide reduced prices, excellent customer service, and convenient flight schedules. Growth was center to their strategic plan and reaching a “critical mass” was perceived as essential to their survival. With their rapid increase in sales, corporate officers thought that in order to reach this “critical mass” purchasing more planes, hiring more employees, and offering more fights was essential. This increase of sales lead to an increase in asset purchases which required financing. The following is the analysis of Citizen Air’s financial statements. Source and Use: Source and Use of Funds Approximated PERIOD 1982-1983 1983-1984 1984-1985 1982-1983 1983-1984 1984-1985 SOURCES OF FUNDS USES OF FUNDS Decrease In Assets Increase In Assets Cash & Equivs. 48.58 Cash & Equivs. 73.74 16.97 Notes/Accts.Rec. Notes/Accts.Rec. 8.77 12.85 24.33 Inventories Inventories 1.27 6.95 1.38 Other Current 1.46 Other Current 2.47 13.02 Tot. Prop./Equip 0.00 0.00 0.00 Tot. Prop./Equip 221.25 271.79 73.40 Intangibles Intangibles Other Assets Other Assets 9.03 0.41 119.49 Increase In Liabilities and Net Worth Decrease In Liabilities and Net Worth Accounts Payable 34.28 24.36 7.30 Accounts Payable Short Term Debt 2.56 13.25 Short Term Debt 8.01 Oth. Curr. Liab. 11.85 17.08 Oth. Curr. Liab. 2.61 Total Long Term Debt 186.76 78.91 175.92 Total Long Term Debt Deferred Tax Deferred Tax Other 14.57 Other Minority Interest Minority Interest Preferred Stock 0.04 Preferred Stock 0.04 Common Equity 62.84 99.23 35.85 Common Equity Income From Operations 6.45 1.65 -20.14 Dividend Payments 0.00 5.31 9.55 Depreciation Expense 11.79 27.25 40.81 Total Sources 316.53 310.34 255.77 Total Uses of Funds 316.53 310.34 255.77
  • 2. According to the Source and Use statement most of Citizen’s financing was accomplished by longterm debt and the issuing of common stock. One major problem that Citizen Air faces is that by financing expansion with long term debt they are increasing their interest expense significantly while not increasing their operating income. As a result the have a negative interest burden and are paying double the amount of their operating income to pay their interest expense. On top of all their interest expense issues the company’s debt is becoming current and they have to decided to stretch out their suppliers by delaying payment to their accounts payable in order to fund their short term cash needs. Citizen Air was not always in their current financial predicament. In 1983, they had their highest percentage of cash and a high percentage of property and equipment which made them asset rich. If they had put available funds into growing the company at a moderate pace they would not be in the financial crisis they are in. Dupont Analysis: Dupont Analysis Dupont Analysis Margin X Turnover = ROI / Leverage = ROE Price of Stock NI/Sales Sales/TA NI/TA (1 - TD/TA) NI/Equity 1982 0.39% 1.09 0.42% 61.50% 1.10% 21.12499798 1983 2.25% 0.69 1.55% 75.48% 6.33% 20.87499677 1984 0.28% 0.92 0.26% 70.09% 0.86% 10.1249995 1985 -2.17% 1.10 -2.38% 75.05% -9.55% 9.125 Tax Interest Burden Burden Margin Turnover Leverage ROE NI/EBT EBT/EBIT EBIT/Sales Sales/TA TA/Equity 1982 53.99% 8.17% 8.83% 1.09 2.60 1.10% 1983 58.92% 49.04% 7.79% 0.69 4.08 6.33% 1984 -13.14% -45.90% 4.66% 0.92 3.34 0.86% 1985 99.60% -49.34% 4.42% 1.10 4.01 -9.55% The Dupont Analysis shows that the margin has decreased to -2.17% even though sales have increased by 668%. This is a bad sign and much of the companies problems in this area can be attributed to the interest burden that they are facing. Turnover on the other hand has fluctuating slightly but for the most part has stayed fairly consistent. This is due to the fact that sales are increasing at a fairly even rate compared to the company’s assets. The ROI is taking a hit because Net Income is suffering drastically because the operating income cannot cover the interest expense the firm is incurring. The company is highly leveraged and as a result interest expense is high. In the end the ROE has decreased from a high of 6.33% to -9.55%. The firm is loosing money and has no return on equity and the stock price is starting to show signs of weakness. The decrease in stock price from 1983-1984 is a result of the stock being split but the overall trend in price is still down.
  • 3. Altman Test: Altman Test Ratios 1982 1983 1984 1985 Liquidity -0.0093 0.1055 -0.0637 0.0151 Cummulative Profitability -0.2183 -0.1005 -0.0880 -0.0926 Earning Power of Assets 0.3177 0.1773 0.1413 0.1600 Leverage 1.3021 0.7965 0.2888 0.2105 Activity 1.0888 0.6887 0.9184 1.0963 Z Value (weighted sum) 2.4810 1.6675 1.1968 1.3893 The major benefit to the Altman test is its ability to show the likelihood of a firm to go bankrupt. If a firm has a “Z” score to 3.0, or greater, it is almost certain to be in the non-bankrupt category. If the score is below 2.0 then it has a very high probability of becoming bankrupt. Between 2.0 and 3.0 firms may go either way. The “Z” score for Citizen Air decreases over the years and falls way below what is acceptable. This analysis shows that Citizen is most likely going to go bankrupt. Internal and External Growth: Growth Rates 4 Year Weighted 1982 1983 1984 1985 Average Internal Growth Rate 0.40% 1.60% -0.60% -3.40% -0.10% Sustainable Growth 1.10% 6.80% -1.90% -12.30% -0.50% The internal growth rate and sustainable growth rate of the firm has drastically decreased from 1982-1985. The problem with sustainable growth is a direct result of a decrease in ROE and an increase in dividend payout. Since the plowback ratio is increasing and ROE is dropping below zero the sustainable growth of the firm is -12.3% in 1985. This is the same case with the internal growth. ROI is decreasing below zero and the plowback is increasing. Paying a dividend with a negative ROI and ROE is going to yield a non sustainable company. Question #2 The initial growth the Citizen Air saw was a result of carefully selecting routes that were not main stream. It was not until Citizen grew so rapidly that they were forced to compete with the large companies on routes that had been flown by them for over 20 years. Airlines, such as Northwest with deep pockets, cut cost and increased the number of available flights in order to protect their stake in their bread and butter routes. This made it hard for Citizen to compete in the highly successful areas. Citizen still hung strong to the belief that they needed to expand but was not in any position to continue their growth at that time. On top of pressure from other competitors, American Airlines eventually announced it’s Ultimate
  • 4. Super Saver plan and put even greater strain on Citizen Air. At that point management felt they only had two options to battle their decreasing loss of market share. One possibility was to develop new hubs, thereby finally achieving a competitive nationally comprehensive route system, or by buying another airline. The second option was to break off the battle, sell aircraft to raise cash, and invest in the further development of the Newark hub, build a computerized reservation system and create a yield management system. Since growth is center to their philosophical business strategy, Citizen Air did not like the idea of downsizing and choose the option to purchase Frontier Airlines. They felt that they could successfully integrate the service of Frontier into their own. However, the purchase of Frontier only added to their problems. First of all, Citizen Air was structured as a single ticket option at a low cost where Frontier was a traditional airline with business class and varied ticket price. This established system that Frontier had is in contradiction with Citizen Air’s business structure. For one thing Frontier is highly unionized while Citizen Air is not. Problems also arose with culture integration and general operations, and Frontier eventually became a drain on Citizen Air’s funds. With growth comes many benefits and so comes its costs. For Citizen Air, their employees were overworked and were starting to have family problems, become ill, and feel burned out. On top that Customers were starting to become frustrated with Citizen Air’s facilities, and the problem of overbooking. Citizen was trying to fit 1,000,000 people a month into a facility that could only handle 100,000. As a result, flights were cancelled, delayed and customers had to wait for hours in uncomfortable conditions. The fact is that Citizen Air could not expand and needed to focus on the problems it already had such as facilities, customer dissatisfaction, and high amounts of debt. However, they choose to purchase Frontier. This combination of a highly volatile financial situation, customer decline, and a threat of competitors ultimately will be the destruction of Citizen Air. At this point, they need significant financing in order to continue growth. It is difficult to imagine where this financing will come from. If they take out any more loans their interest expense will skyrocket even more then it already is. They cannot turn to stretching their suppliers anymore because they are most likely already upset. The use of accounts payable to fiance growth is a short term and dangerous approach. The truth is market share has already been lost and is going to continue to be lost. Citizen’s sustainability is now the real question at hand. They should not be concerned about losing their market share but should be concerned about survival. Question #3 (see also Decision tree on next page) The first step in improving the situation would be to stop any dividends payments. Next, selling of Frontier, if at all possible, will alleviate the financial and cultural strain that is causes. This was a poor purchase to begin with and if it can be sold quickly then their might be a chance of potential turn around. Next, making overall operations more efficient would help lower cost. The problem of over booking and unsatisfied customers will eventually lead to failure. Finally, the last step is downsizing. Slow down the growth and let the company get back on its feet. Ultimately, these solutions are not guaranteed and Citizen Air’s situation might be beyond the point of no return.
  • 5.
  • 6. Ratios Based On Year End Data Period 1982 1983 1984 1985 4 Year DuPont Ratios Return On Investment 0.40% 1.60% 0.30% -2.40% -0.50% Return On Equity 1.10% 6.30% 0.90% -9.50% -2.20% Profit Margin 0.40% 2.30% 0.30% -2.20% -0.30% Total Asset Turnover 1.09 0.69 0.92 1.10 96.20% Leverage Ratio (TD/TA) 61.50% 75.50% 70.10% 75.10% 72.30% Income Ratios Tax Burden 54.00% 58.90% -13.10% 99.60% 53.10% Interest Burden 8.20% 49.00% -45.90% -49.30% -22.90% Degree of Fin Leverage 12.24 2.04 -2.18 -2.03 16.80% Operating Margin 8.80% 7.80% 4.70% 4.40% 5.60% Cash Flow To Common Eq. 0.16 0.18 0.12 0.07 11.80% Interest Coverage 1.09 1.96 0.69 0.67 97.50% Total Dividend Payout 0.00% 0.00% 322.40% -47.40% 77.70% Common Dividend Payout 0.00% 0.00% 0.00% -19.40% -7.80% Effective Tax Rate 46.00% 41.10% -2.00% 0.40% 12.40% Asset Ratios Fixed Asset Turnover 1.28 0.95 1.09 1.58 1.28 Degree of Op Leverage 1.70 0.05 1.78 1.07 Acc. Depr As % Gross Plant 7.89% 6.54% 7.91% 12.40% 9.43% Acc Depr/Depr Exp (Asset Age) 1.26 1.79 1.70 2.03 1.81 Current Asset Turnover 7.92 2.76 6.67 7.18 6.22 Current Ratio 0.95 1.54 0.72 1.09 1.06 Ouick Ratio 0.91 1.52 0.65 1.00 0.99 Accounts Recievable Turnover 48.08 24.58 23.95 19.00 24.51 Accounts Recievable Collection 7.59 14.85 15.24 19.21 15.99 Inventory Turnover (Sales) 229.52 153.01 66.50 90.91 109.87 Inventory Turnover (COGS) 159.13 105.86 48.67 65.49 77.88 Cash Turnover 31.65 109.25 23.14 21.31 40.48 Working Cap Turnover 309.25 286.84 113.58 131.23 174.86 Leverage Ratios Assets to Equity 2.60 4.08 3.34 4.01 3.68 Current Debt To Total Debt 23.64% 21.42% 27.25% 18.69% 22.30% A/P Turnover (COGS) 25.34 75.40 55.52 39.66 50.13 A/P Turnover (Purchases) 74.92 54.63 39.57 47.20 LTD to Assets 47.00% 59.30% 51.00% 61.00% 56.27% Net Debt Repay Ability (Yrs) 8.33 12.50 14.20 28.08 18.83 Funded Debt to Capital 55.00% 70.80% 63.00% 71.00% 66.95% Preferred to Capital 0.00% 0.00% 0.00% 0.00% 0.00% Common Eq. To Capital 45.00% 29.20% 37.00% 29.00% 33.05% LTD To Equity 1.22 2.42 1.71 2.45 2.10 Altman Ratios Working Capital/T. Assets -0.78% 8.79% -5.31% 1.26% 0.59% RE/TA -15.60% -7.18% -6.28% -6.61% -7.53% EBIT/TA 9.63% 5.37% 4.28% 4.85% 5.26% Mkt Value Eq/Book Value TD 217.02% 132.75% 48.13% 35.09% 76.73% Sales/TA 108.99% 68.94% 91.93% 109.74% 96.16%
  • 7. Common Size Income and Balance Sheet (as a percent of Sales) INCOME STATEMENT 4 Year PERIOD 1982 1983 1984 1985 Weighted Fiscal Year Ends Average Sales 100.00% 100.00% 100.00% 100.00% 100.00% Cost of Goods Sold 69.30% 69.20% 73.20% 72.00% 71.50% Gross Margin 30.70% 30.80% 26.80% 28.00% 28.50% Sell./Gen./Admin. 17.80% 19.90% 18.70% 20.00% 19.40% Depreciation and Amort 5.30% 4.10% 4.60% 4.40% 4.50% Total Expenses 23.10% 24.00% 23.40% 24.40% 23.90% Operating Income 7.53% 6.85% 3.44% 3.60% 4.60% Other Income 1.30% 0.90% 1.20% 0.80% 1.00% Interest Expense 8.10% 4.00% 6.80% 6.60% 6.30% EBIT 0.70% 3.80% -2.10% -2.20% -0.70% Minortity Interest 0.00% 0.00% 0.00% 0.00% 0.00% Income Taxes 0.30% 1.60% 0.00% 0.00% 0.40% Special Inc or Exp 0.00% 0.00% 2.50% 0.00% 0.70% Net Income 0.40% 2.30% 0.30% -2.20% -1.80% Extra Ordinary Income 0.30% 1.40% 0.00% 0.00% 0.30% Total Income 0.70% 3.60% 0.30% -2.20% -1.50% Cash Dividends (% Income) 0.00% 0.00% 322.40% -47.40% 77.70% BALANCE SHEET (as percent of Sales) 4 Year Weighted PERIOD 1982 1983 1984 1985 Average ASSETS: Cash & Equivs. 8.70% 29.90% 6.30% 5.80% 11.10% Accts.Rec. 2.10% 4.10% 4.20% 5.30% 4.40% Inventories 0.40% 0.70% 1.50% 1.10% 1.10% Other Current Assets 1.40% 1.60% 3.00% 1.70% 2.00% Total Current Assets 12.60% 36.20% 15.00% 13.90% 18.60% Tot. Prop./Equip 85.10% 112.70% 99.90% 72.10% 89.90% Depreciation 6.70% 7.40% 7.90% 8.90% 8.10% Net Prop./Equip 78.40% 105.40% 92.00% 63.20% 81.80% Intangibles 0.00% 0.00% 0.00% 0.00% 0.00% Other Assets 0.70% 3.50% 1.80% 14.00% 6.90% Total Assets 91.80% 145.10% 108.80% 91.10% 107.30% LIABILITIES: Accounts Payable 4.80% 14.30% 11.10% 7.80% 9.80% Short Term Debt 5.10% 3.40% 3.90% 1.60% 3.00% Other Current Liab 3.40% 5.80% 5.70% 3.30% 4.60% Total Current Liabs 13.30% 23.50% 20.80% 12.80% 17.40% Total Long Term Debt 43.10% 86.00% 55.50% 54.00% 59.80% Deferred Tax 0.00% 0.00% 0.00% 0.00% 0.00% Other 0.00% 0.00% 0.00% 1.60% 0.60% Minority Interest 0.00% 0.00% 0.00% 0.00% 0.00% Total Long Term 43.10% 86.00% 55.50% 55.60% 60.40% Total Liabilities 56.40% 109.50% 76.20% 68.40% 77.80% Preferred Stock 0.00% 0.00% 0.00% 0.00% 0.00% Common Stock 49.60% 46.00% 39.40% 28.80% 37.50% Retained Erngs. -14.30% -10.40% -6.80% -6.00% -8.00% Treasury Stock 0.00% 0.00% 0.00% 0.00% 0.00% Total Equity 35.30% 35.60% 32.50% 22.70% 29.50% Total Liab. And Equity 91.80% 145.10% 108.80% 91.10% 107.30%
  • 8. Common Size Balance Sheet (as percent of Assets) BALANCE SHEET (as percent of Assets) 4 Year Weighted PERIOD 1982 1983 1984 1985 Average ASSETS: Cash & Equivs. 9.50% 20.60% 5.80% 6.40% 9.40% Accts.Rec. 2.30% 2.80% 3.80% 5.80% 4.20% Inventories 0.50% 0.50% 1.40% 1.20% 1.00% Other Current Assets 1.60% 1.10% 2.70% 1.90% 2.00% Total Current Assets 13.80% 25.00% 13.80% 15.30% 16.60% Tot. Prop./Equip 92.80% 77.70% 91.80% 79.20% 84.00% Depreciation 7.30% 5.10% 7.30% 9.80% 7.90% Net Prop./Equip 85.50% 72.60% 84.60% 69.30% 76.20% Intangibles 0.00% 0.00% 0.00% 0.00% 0.00% Other Assets 0.80% 2.40% 1.60% 15.40% 7.20% Total Assets 100.00% 100.00% 100.00% 100.00% 100.00% LIABILITIES: Accounts Payable 5.25% 9.85% 10.23% 8.59% 9.00% Short Term Debt 5.56% 2.32% 3.59% 1.76% 2.80% Other Current Liab 3.73% 3.99% 5.28% 3.68% 4.20% Total Current Liabs 14.54% 16.17% 19.10% 14.03% 16.00% Total Long Term Debt 46.96% 59.31% 50.99% 59.30% 55.60% Deferred Tax 0.00% 0.00% 0.00% 0.00% 0.00% Other 0.00% 0.00% 0.00% 1.72% 0.70% Minority Interest 0.00% 0.00% 0.00% 0.00% 0.00% Total Long Term 46.96% 59.31% 50.99% 61.03% 56.30% Total Liabilities 61.50% 75.48% 70.09% 75.05% 72.30% Preferred Stock 0.00% 0.00% 0.01% 0.00% 0.00% Common Stock 54.09% 31.69% 36.19% 31.56% 35.20% Retained Erngs. -15.60% -7.18% -6.28% -6.61% -7.50% Treasury Stock 0.00% 0.00% 0.00% 0.00% 0.00% Total Equity 38.50% 24.52% 29.91% 24.95% 27.70% Total Liab. And Equity 100.00% 100.00% 100.00% 100.00% 100.00% List of Key take aways: Interest Coverage Ratio is on avg 97% and declining over last 2 years. This may be a factor in taking out new loans. Acquiring companies with contradictory cultures. (purchasing a highly unionized company when they are not unionized) • Initial growth because CA was careful in rout selection and stayed away from routs occupied by the larger airlines ◦ In attempts to reach "critical mass" they would try to start competing head to head with the giants but would be unable to offer the heavy discounts their airline was based around
  • 9. Their strategic model was lost as they moved into direct competition with the majors. ◦ debt from excessive growth caused them to abandon their key philosophies