"Subclassing and Composition – A Pythonic Tour of Trade-Offs", Hynek Schlawack
Shillers Housing Indices Northeast Nyc Overall 01272009
1. Shiller Index Value
Ja
n-
0.00
50.00
100.00
150.00
200.00
250.00
M 00
ay
-
Se 00
p-
0
Ja 0
n-
M 01
ay
-
Se 01
p-
0
Ja 1
n-
M 02
ay
-
Se 02
p-
0
Ja 2
n-
M 03
ay
-
Se 03
p-
0
Ja 3
n-
M 04
ay
-
Se 04
p-
0
Date
Ja 4
n-
M 05
ay
-
Se 05
p-
0
Ja 5
n-
M 06
ay
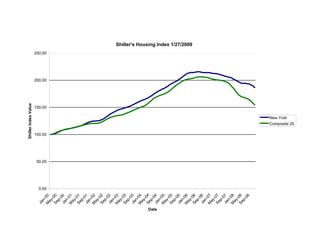
Shiller's Housing Index 1/27/2009
-
Se 06
p-
0
Ja 6
n-
M 07
ay
-
Se 07
p-
0
Ja 7
n-
M 08
ay
-
Se 08
p-
08
New York
Composite 20
2. Shiller's Housing Indices - Northeast NYC Overall 01272009
DC-Washington MA-Boston NY-New York Composite-20
Date WDXR BOXR NYXR SPCS20R
100.00 100.00 100.00 100.00
January 2000
100.53 100.36 100.54 100.76
February 2000
101.70 101.31 101.27 101.95
March 2000
103.34 103.27 102.41 103.50
April 2000
104.91 105.85 104.35 105.20
May 2000
106.29 108.48 106.00 106.76
June 2000
107.72 110.00 107.52 107.77
July 2000
109.10 111.38 108.90 108.64
August 2000
110.18 112.67 109.76 109.35
September 2000
110.50 114.11 110.51 110.04
October 2000
110.99 115.36 110.89 110.81
November 2000
111.96 116.56 111.87 111.58
December 2000
112.73 117.67 112.66 112.39
January 2001
113.99 118.51 113.51 113.07
February 2001
115.40 119.94 114.48 114.14
March 2001
117.90 121.54 115.60 115.29
April 2001
119.30 123.11 116.38 116.24
May 2001
120.93 125.12 117.90 117.29
June 2001
122.31 126.76 119.66 118.20
July 2001
123.61 128.26 121.41 119.09
August 2001
124.50 129.62 122.91 119.84
September 2001
124.87 130.51 123.86 120.31
October 2001
124.93 130.94 124.74 120.53
November 2001
125.65 130.06 124.72 120.43
December 2001
125.99 129.93 125.19 120.64
January 2002
127.19 129.63 125.40 121.06
February 2002
128.47 131.21 126.50 122.30
March 2002
130.78 133.34 127.93 123.92
April 2002
133.40 136.76 129.89 125.86
May 2002
135.67 139.56 132.20 127.82
June 2002
138.48 141.77 135.18 129.66
July 2002
140.68 143.66 137.74 131.22
August 2002
142.39 145.85 139.69 132.43
September 2002
143.30 147.43 141.58 133.55
October 2002
143.77 148.33 143.29 134.41
November 2002
144.96 147.28 145.20 135.15
December 2002
145.19 146.79 146.55 135.64
January 2003
146.01 147.18 147.30 136.19
February 2003
146.75 148.99 148.38 137.20
March 2003
148.92 150.42 149.53 138.56
April 2003
151.53 152.15 150.88 140.06
May 2003
154.00 153.30 151.86 141.39
June 2003
156.47 154.21 153.50 142.99
July 2003
158.70 154.97 155.14 144.56
August 2003
161.01 156.38 157.10 146.28
September 2003
162.65 157.63 158.73 147.82
October 2003
164.14 158.63 160.59 149.22
November 2003
165.79 158.58 162.31 150.49
December 2003
167.79 158.54 163.63 151.69
January 2004
169.51 159.19 164.92 153.10
February 2004
3. Shiller's Housing Indices - Northeast NYC Overall 01272009
172.30 161.10 166.61 155.49
March 2004
176.62 164.29 168.30 158.47
April 2004
182.19 166.59 170.52 161.60
May 2004
188.02 168.57 172.90 164.82
June 2004
192.08 169.69 175.74 167.43
July 2004
195.39 170.90 177.93 169.31
August 2004
198.24 172.18 179.79 170.96
September 2004
200.79 173.97 181.90 172.41
October 2004
203.31 174.04 183.69 173.65
November 2004
206.06 173.42 185.16 174.83
December 2004
208.63 173.43 187.19 176.44
January 2005
212.24 174.76 189.29 178.50
February 2005
217.86 176.92 192.17 181.30
March 2005
224.09 179.04 194.10 184.24
April 2005
229.87 181.17 195.96 187.21
May 2005
235.38 181.33 197.77 190.10
June 2005
239.50 181.90 199.86 192.67
July 2005
242.06 181.67 202.33 194.98
August 2005
244.11 182.45 204.83 197.36
September 2005
245.44 182.07 207.64 199.40
October 2005
246.70 181.69 210.30 200.97
November 2005
247.37 179.44 212.68 201.97
December 2005
247.70 178.17 213.50 202.44
January 2006
248.39 176.28 214.47 203.19
February 2006
248.86 177.12 214.33 203.65
March 2006
250.17 177.62 214.97 204.82
April 2006
251.07 178.61 215.57 205.86
May 2006
250.99 177.90 215.83 206.38
June 2006
249.92 177.79 215.25 206.52
July 2006
247.94 177.28 214.34 206.18
August 2006
244.78 176.34 214.08 205.80
September 2006
243.73 175.72 214.28 205.41
October 2006
242.28 172.59 214.24 204.65
November 2006
240.45 170.31 213.79 203.33
December 2006
238.85 168.29 212.78 202.31
January 2007
237.98 168.04 212.51 201.57
February 2007
237.14 168.52 212.39 201.01
March 2007
236.17 169.61 211.61 200.53
April 2007
235.41 170.96 210.51 200.12
May 2007
234.02 171.29 209.49 199.44
June 2007
232.17 171.77 208.36 198.71
July 2007
230.21 170.84 207.17 197.37
August 2007
229.25 170.73 206.37 195.69
September 2007
227.56 169.33 205.52 192.97
October 2007
223.85 167.39 204.36 188.94
November 2007
218.35 164.58 202.08 184.96
December 2007
213.20 162.59 200.44 180.69
January 2008
207.95 160.31 198.29 175.96
February 2008
203.39 158.52 196.51 172.20
March 2008
201.32 158.68 194.73 169.98
April 2008
199.27 160.34 194.22 168.60
May 2008
197.61 162.31 194.74 167.78
June 2008
4. Shiller's Housing Indices - Northeast NYC Overall 01272009
195.44 162.58 193.71 166.36
July 2008
194.15 162.75 193.49 164.65
August 2008
189.99 160.98 191.65 161.64
September 2008
184.92 159.17 189.79 158.12
October 2008
180.50 155.03 186.81 154.59
November 2008
December 2008