Tampa BSides - Chef's Tour of Microsoft Security Adoption Framework (SAF)
Evaluating ISE (2012)
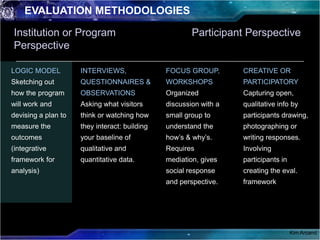
1. EVALUATION METHODOLOGIES
Institution or Program
TRAILER
Participant Perspective
Perspective
LOGIC MODEL INTERVIEWS, FOCUS GROUP, CREATIVE OR
Sketching out QUESTIONNAIRES & WORKSHOPS PARTICIPATORY
how the program OBSERVATIONS Organized Capturing open,
will work and Asking what visitors discussion with a qualitative info by
devising a plan to think or watching how small group to participants drawing,
measure the they interact: building understand the photographing or
outcomes your baseline of how’s & why’s. writing responses.
(integrative qualitative and Requires Involving
framework for quantitative data. mediation, gives participants in
analysis) social response creating the eval.
and perspective. framework
Kim Arcand
2. BASIC LOGIC MODEL
TRAILER
INPUTS OUTPUTS AUDIENCES OUTCOMES
What is What is done Who Short-term Long-term
invested •Exhibits •Internal Change in: Change in:
•Time •Workshops •External •Knowledge •Environment
•Money •Publications •Skills •Social conditions
•Partners •Etc. •Attitude •Economic cond.
•Equipment •Awareness •Political cond.
•Facilities •Motivation •Etc.
Evaluation Study: Measurement of process indicators – Measurement of outcome indicators
(Formative, summative and anything in between)
Adapted from University of Idaho: http://www.uiweb.uidaho.edu/extension/LogicModel.pdf
Kim Arcand
3. SPECIFIC LOGIC MODEL
TRAILER
• Plan programs
• Examine feasibility of implementation & potential success
• Create tools to communicate within & outside
• Facilitate evaluation questions
Kim Arcand
4. FINDING THE RIGHT QUESTIONS…AFTERWARDS?
TRAILER to the Universe (FETTU) evaluation strategy
From Earth
- Based on NSF ISE evaluation rec., "Framework for Evaluating Impacts of Informal
Science Education Projects" (2008)
- Used observation, survey and interview protocols for viewing audiences, as well as staff
of host-partner institutions and local community partners
- Found out good stuff…but had more questions than answers
http://www.fromearthtotheuniverse.org/
Kim Arcand
5. SECOND TIME AROUND
TRAILER to the Solar System (FETTSS), new exhibit in 2011-2013
From Earth
- Testing findings from FETTU
- ~80 locations worldwide (From cafes in New Zealand to malls in Canada)
- Audience targeted is the non-science expert. Offer multiple access points. Family-
friendly language/set up; free, public, everyday settings; Spanish translations;
Braille/tactile materials.
http://fettss.arc.nasa.gov/
Kim Arcand
6. 2ND CHANCES: FETTSS EVALUATION STRATEGY
TRAILER
Observation sheet:
Observer: Date: FETTSS Venue: Time of Day:
Composition of Visitor Group:________________ Total Visit Time:
Key: M = adult male F = adult female
G = teen girl B = teen boy g = girl b = boy
Notes: Behaviors Observed
List any site specific notes (eg., the most visited images were
by the restroom or the entry way, etc.) or general observations Read Label
here:
Read Aloud
Point at Image feature
Talk (about exhibit)
Show/Explain to others
Ask Questions
Other (describe)
Visitor Comments Overheard:
Kim Arcand
8. EVALUATING ON A BUDGET: POSTCARDS
TRAILER
What to watch out for
Errors: sample size (n=10+), random selection, etc
Over-generalizing, Subjectivity
Evaluation does not = Research
Kim Arcand
9. FOCUS GROUPS
TRAILER & Astronomy is a research project that
Aesthetics
studies the perception of multi-wavelength astronomical
imagery and the effects of the scientific and artistic choices
in processing astronomical data.
Runs series of 2-3 focus groups for the qualitative data to
accompany an online survey and in-person interviews for
quantitative data.
Research questions include:
• How much do variations in presentation of color, explanation, and
scale affect comprehension of astronomical images?
• What are the differences between various populations (experts,
novices, students) in terms of what they learn from the images?
• What misconceptions do the non-experts have about astronomy
and the images they are exposed to?
• Does presentation have an effect on the participant?
http://astroart.cfa.harvard.edu
Kim Arcand
10.
11. G292.0+1.8
G292.0+1.8
20,000 light-years
20,000 light-years
The oxygen we a young our
Where do the calcium in the iron
G292.0+1.8 is breathe,
in our and the oxygen in our
bones blood, and the calcium in
supernova remnant located in
our bones comes in part from
lungs come This deep Chandra
our galaxy. from? From
exploded stars such as the
supernovae, the exploding stars
image shows a spectacularly
Cassiopeia beautiful “supernova
that create A supernova remnant
detailed, rapidly expanding shell
seen here. Most of this elements
remnants” such as theyears This
of gas that is 36 light one.
throughout contains large other
X-ray imagethe the supernova
across and of Universe,
than hydrogen and helium, a
remnant G292.0+1.8 showswere
amounts of oxygen, neon,
forged expanding shell of gas
rapidly in the silicon of stars.
magnesium, cores and sulfur.
These elements werethat as
containing elements such this
Astronomers believe then
dispersed into magnesium only
oxygen, neon, space one ofthe
supernova remnant, when
stars exploded, later to be used
siliconin the Milky Way known to
three and calcium that were
as the building blocks formed
createdin oxygen, waswhen new
be rich both during the lifetime
stars star and in the explosion
of theand planets formed. Ourof
by the collapse and explosion
Sun and Solar System—including
itself. Explosions like this
a massive star. Supernovas are
Earth—contain the that were
dispersed elementsmaterials for
of great interest because they
life thanks to such previous
necessary to form our Sun and
are a primary source of the
generations of believed to be
Solar System. stars.
heavy elements
necessary to form planets and
life.
12. EVALUATING: CLASS ARCHIVES PROJECT
TRAILER
What questions do you want to ask?
What are the outputs?
Who are your audiences?
What outcomes do you want to measure (short term, long term)?
What outcomes are useful to your funding organization(s)?
INPUTS OUTPUTS AUDIENCES OUTCOMES
Kim Arcand
Editor's Notes
Look at a spectrum of methodologies that move from Institution approach to Participant PerspectiveNot perhaps the most organic grouping but the logic model has gained importance/popularity and is something useful to consider for framing evaluations, particularly for writing grant proposals. Logic models are a sort of holistic approach to programming, making assumptions explicit, considering the big picture. It’s an integrative framework for analysis and can incorporate any of the specific types of evaluation methodologies. But I’ve included it here because of the approach – institution or program specificInterviews, Questionnaires and Observations are sort of the bread and butter of affordable evaluation plans. They give you a baseline of both qualitative and quantitative data to work from. Any of these on its own won’t present a very strong dataset to generalize from, but in cooperation with other types, can give you a very good picture. Again, this is directed by the organization/project specifically.Focus Groups and workshops are probably my favorite. With a small group of 6 or 8 volunteers, you can sit down and have an insightful conversation about the how’s and why’s. Focus groups are useful to obtain several perspectives about a project, activity or a topic. Unlike one-to-one interviews people can build upon one another’s responses and come up with ideas they may not have thought of one their own. They are particularly beneficial for bringing together a range of people or stakeholders.I’ve gotten more interesting, usable information from one hour long focus group than I have from studies that have 1,000 responses. Creative methods, incorporating drawing, writing and photography, can be used to evaluate activities and projects. These techniques are very open-ended, can be useful for capturing and visually displaying different people’s opinions and experiences of a project. Some people really enjoy being creative, which makes these methods a valuable evaluation tool – but must keep in mind the groups that are not as open to this type of experience. Creative methods can be used to understand perceptions of certain issues, words, or topics (e.g. science, health or well being) or usage (i.e. where people do things, which places they visit). For instance, people could be asked to draw mental maps to show how they perceived a space. Can be useful for groups with certain types of disabilities. In any participatory evaluation, you are involving the perspective of the participants much more closely and if you are doing a truly participatory project than it might make sense to follow that with a participatory evaluation.
Simplified Logic Model showing how the evaluation study is framed in.Developing a program logic model helps to ensure alignment between program activities and intended outcomes. Helps examine the feasibility of implementation and potential program success. It provides collaborators with a common language to communicate within and outside the program and organization (such as program staff), and aids in helping others to understand program design. By making assumptions explicit, logic modeling also facilitates the development of evaluation questions.Inputsor Resources: represents all the possible sources of information, material, staff, or knowledge that may relate to a program or event. Outputs: The quantitative measure of the number of things produced, activities performed or points of contact made with audiences. Outputs can include an exhibition that is mounted for public display, a publication, or a press release. It can also include number of people attending a training, total attendance at an exhibition or a program plan. Outputs represent things but can not establish whether any change has occurred as a result of the activity, only that the activity was either completed or not.Audiences: Once an audience or audiences are clearly identified, a logic model will outline anticipated changes that may be experienced by a member of the target audience. And it’s important to consider both internal and external audiences. Sometimes, changes in internal audiences – museum staff, institution management or other partner organization audiences can have the most direct impact – greater encouragement of projects with risk; better facilitation; possibilities for more stable funding, etc. Outcomes: Short term: Social science literature has demonstrated that behavior change is a consequence of changed attitudes, knowledge and motivations. Long term: Generally the logic model outlines a desired long term goal, or desired social state, such as the development of a recruitment pool for future scientists that is consistent with the gender and ethnic diversity of the nation. This is hard to track unless you’re doing intensive follow-on interviews, questionnaires, etc.Formative evaluations done while a program is developing can help inform your inputs, outputs and audiences. Summative evaluation done once the project is materialized and after participants have left the host environment can help show what outcomes you have.
Logic Model for ChandraMission is 12 years old. After the first few years of science production, we thought we had a sense of our audience from general and anecdotal feedback. Once we did a complete evaluation of our web site visitors for example, we found that we were not reaching the proportion of teachers and students that we were hoping for. We put together a logic model and readjusted our process to include more formative evaluation as well as targetting of the audiences we were hoping to reach. Plan programsExamine the feasibility of implementation and potential program successCreate tools to communicate within and outside the organizationUnderstand program design and facilitate evaluation questions in general
OVERVIEW of FETTUAn exhibition done through distributed curation with an open-source approach, and a grassroots network that brought astronomy images and their content to a wide audience in non-traditional venues such as public parks and gardens, art museums, shopping malls and metro stations. Majority of FETTU events occurred in libraries, hospitals, nature centers, even a prison. We did evaluation on a dozen US locations and found that:Surveys/interviews showed that exposure to scientific content in these settings leads to inspiration and small learning gains.The observations indicate that people were willing to spend a pretty long time for engagement in a non-interactive exhibit.The survey/interviews with partner organizations showed that hosting the exhibit helped to create or strengthen the organizer's place in the community and build their capacity for working with their community. Through visitor comments and those from the site organizers, many viewers apparently felt a very personal connection with the images. But…more questions than answers? For example, a big one, who were we attracting with these types of displays? Were we getting more incidental visitors? Were we attracting the less-science savvy? Did any participants follow up with their local science center or library to find out more? What percentage of tourists did we reach vs actual local community members? See that as a positive though – now I have a strong baseline of data to work with, and interesting questions to pursue for the next project…launched last year
OVERVIEW of FETTSSFrom Earth to the Solar System focuses on planetary science, astrobiology and multiwavelength astrophysics. Project for NASA’s Year of the Solar System, NASA-wide systemic approach to increasing awareness of the research being done in our own cosmic neighborhood, including research right on our very own planet in extreme environments such as Antarctica, Mono Lake, Yellowstone National Park, Svalbard etc.FETTSS Has offered us an opportunity to further test some of the findings that we looked in FETTU. So far, we’ve had about 80 locations worldwide, from cafes in New Zealand to train stations in Missouri to malls in Canada. Our specific evaluation goal is to see if we’re successfully targeting the non-science expert – someone who might not go to a science museum or science talk or science café. We’re offering multiple access points in the exhibits – family friendly language that really uses metaphor and analogy to make the information usable, relatable. The physical exhibits are family friendly in height and textual content (meant to be read aloud). The locations are free in everyday settings. We have Spanish translations and Braille translations.
Tried to correctthe omissions and answer the questions from FETTU with the follow-on From Earth to the Solar System (FETTS).Observation sheet - simplified
Corrected the omissions and tried to answer the questions from FETTU with the newly funded From Earth to the Solar System (FETTS).Survey sheet – Better and More nuanced data So far we’ve found:High percentage of participants go to less than 1 science event per year; small minority attending more than 1 event.Most have categorized themselves as novice to mid range, very few who place themselves in 4 or 5 expert levelIf we take out the D.C. location on the national mall, most of the venues are attracting primarily local populationsMost responders experienced small learning gains and could generalize thoughts well enough to demonstrate good comprehension levelsGood % REPORTED their interest in learning more and going online to found out more on science/astronomy; small % noted they would actually attend more science events in the future – and we’re not yet doing follow up interviews to see if long term behavior is changed, or if this was a one shot deal. So, more work for future projects.
Evaluating– no excuse not to! Particularly when dealing with taxpayer dollars, there is a responsibility and need for accountability. Hard to call a project inclusive, participatory, community-based or social if you don’t try to find out what the possible outcomes and impacts were.What can you do when you’re short of time and/or funds? Which is often the case? Postcard study!Use a 5 or 7 point Likert scale (When responding to a Likert questionnaire item, respondents specify their level of agreement to a statement)Ask some directed questions; then leave room at the end for an open ended question or two (where the good stuff usually comes in).I like to aim for 50 data points per location to have enough data to be statistically significant, but smaller events could aim for n=10. Digitize the data in Excel, do some averages, and see what you get.
Focus group study let us explore in depth just how people go about processing the images that they see and to look carefully at expert/novice differences in this processing. This is paired with extensive analysis of data from online questionnaires. One of our A&A focus groups might look like:Advertise in local papers/listservs/Craig’s List; providefree food and goodiesAbout 1 hour long discussion with 6 or so volunteers and 2 facilitatorsIn our case, we were showing images on screens and asking questions to get at the following: How much do variations in presentation of color, explanatory text, and illustrative scales affect comprehensionof, aesthetic attractiveness, and time spent looking at deep space imagery?How do novices differ from experts in terms of how they look at astronomical images?What misconceptions do they have/form?Does presentation have an effect on the participant – whether aesthetic or in terms of comprehension?
We would show different versions of images and ask people to rate how they felt about them
We would show some people images with text and some others images without and ask people to rate them.We would ask people how they maneovered through the images and information and what they were thinking, what they were looking at. We ended up developing a series of new products based on the results, as well as changing a number of aspects in our web site to help people navigate the information better.
Archives Project:What questions do you want to ask?What are the outputs?Who are your audiences?What outcomes do you want to measure (short term, long term)?What outcomes are useful to your funding organization(s)?If you care about numbers, count participants and impacted visitors.If you want to explore engagement, measure dwell time and ask open end questions about participant experiences. If you need mission-specific information, measure indicators that reflect the core values of your institution or funding organization. But to more effectively and more completely evaluate the impact of a project, you need to look at how it affects participants, the broader audience, community partners, and staff.