SlideShare une entreprise Scribd logo
1  sur  18
Télécharger pour lire hors ligne
Modeling Selection Pressure in XCS for
Proportionate and Tournament Selection


 Albert Orriols-Puig, Kumara Sastry,
 Pier Luca Lanzi, David E. Goldberg,
     and Ester Bernad´-Mansilla
                       o
     IlliGAL Report No. 2007004
            February 2007


  Illinois Genetic Algorithms Laboratory
 University of Illinois at Urbana-Champaign
        117 Transportation Building
 104 S. Mathews Avenue Urbana, IL 61801
            Office: (217) 333-2346
             Fax: (217) 244-5705
Modeling Selection Pressure in XCS for
                      Proportionate and Tournament Selection
                 Albert Orriols-Puig1,2 , Kumara Sastry1 , Pier Luca Lanzi1,3 ,
                     David E. Goldberg1 , and Ester Bernad´-Mansilla2
                                                              o
                         1
                      Illinois Genetic Algorithm Laboratory (IlliGAL)
                Department of Industrial and Enterprise Systems Engineering
                         University of Illinois at Urbana-Champaign
                                      Urbana, IL 61801
                             2
                          Group of Research in Intelligent Systems
                             Computer Engineering Department
                Enginyeria i Arquitectura La Salle — Ramon Llull University
                  Quatre Camins, 2. 08022, Barcelona, Catalonia, Spain.
                  3
                      Artificial Intelligence and Robotics Laboratory (AIRLab)
                                 Dip. di Elettronica e Informazione
                                         Politecnico di Milano
                             P.za L. da Vinci 32, I-20133, Milano, Italy

        aorriols@salle.url.edu, ksastry@uiuc.edu, lanzi@elet.polimi.it,
                       deg@uiuc.edu, esterb@salle.url.edu

                                         February 11, 2007


                                               Abstract
        In this paper, we derive models of the selection pressure in XCS for proportionate (roulette
     wheel) selection and tournament selection. We show that these models can explain the empirical
     results that have been previously presented in the literature. We validate the models on simple
     problems showing that, (i) when the model assumptions hold, the theory perfectly matches the
     empirical evidence; (ii) when the model assumptions do not hold, the theory can still provide
     qualitative explanations of the experimental results.


1    Introduction
Learning Classifier Systems are complex, fascinating machines introduced more than 30 years ago
by John H. Holland, the father of genetic algorithms (Holland, J.H., 1975). They combine different
paradigms (genetic algorithms for search and reinforcement learning for estimation) which are
applied to a general-purpose rule-based representation to solve problems online. Because they
combine different paradigms, they are also daunting to study. In fact, the analysis of how a learning
classifier system works requires knowledge about how the genetic and the reinforcement components


                                                   1
work and, most important, about how such components interact on the underlying representation.
As a consequence, few theoretical models have been developed (e.g., (Horn, Goldberg, & Deb, 1994;
Bull, 2001)) and learning classifier systems are more often studied empirically.
    Recently, facetwise modeling (Goldberg, 2002) has been successfully applied to develop bits
and pieces of a theory of XCS (Wilson, 1995), the most influential learning classifier system of the
last decade. Butz et al. (Butz, Kovacs, Lanzi, & Wilson, 2004) modeled different generalization
pressures in XCS so as to provided the theoretical foundation of Wilson’s generalization hypothe-
sis (Wilson, 1998); they also derived population bounds that ensure effective genetic search in XCS.
Later, Butz et al. (Butz, Goldberg, & Lanzi, 2004) applied the same approach to derive a bound
for the learning time of XCS until maximally accurate classifiers are found. More recently, Butz et
al. (Butz, Goldberg, Lanzi, & Sastry, 2004) presented a Markov chain analysis of niche support in
XCS which resulted in another population size bound to ensure effective problem substainance.
    In this paper, we propose a step futher toward the understanding of XCS (Wilson, 1995) and
present a model of selection pressure under proportionate (roulette wheel) selection (Wilson, 1995)
and tournament selection (Butz, Sastry, & Goldberg, 2005). These selection schemes have been
empirically compared by Butz et al. (Butz, Goldberg, & Tharakunnel, 2003; Butz, Sastry, & Gold-
berg, 2005) and later by Kharbat et al. (Kharbat, Bull, & Odeh, 2005) leading to different claims
regarding the superiority of one selection scheme versus the other. In genetic algorithms, these se-
lection schemes have been exhaustively studied through the analysis of takeover time (see (Goldberg
& Deb, 1990; Goldberg, 2002) and references therein). In this paper, we follow the same approach
as (Goldberg & Deb, 1990; Goldberg, 2002) and develop theoretical models of selection pressure in
XCS for proportionate and tournament selection. Specifically, we perform a takeover time analysis
to estimate the time from an initial proportion of best individuals until the population is converged
or substantially converged to the best. We start from the typical assumption made in takeover
time analysis (Goldberg & Deb, 1990): XCS has converged to an optimal solution, which in XCS
typically consists of a set of non-overlapping niches. We write differential equations that describe
the change in proportion of the best classifier in one niche for roulette wheel and tournament selec-
tion. Initially, we focus on classifier accuracy, later we extend the model taking into account also
classifier generality. We solve the equations and derive a closed form solution of takeover time in
XCS for the two selection schemes (Section 3). In Section 4, we use these equations to determine
the conditions under which proportionate and tournament selection (i) produce the same initial
growth of the best classifiers in the niche, or (ii) result in the same takeover time. In Section 5,
we introduce two artificial test problems which we use in Section 6 to validate the models showing
that, when the assumptions of non-overlapping niches hold, the models perfectly match the empir-
ical evidence while they accurately approximate the empirical results, when such an assumption is
violated. Finally, in Section 7, we extend the models to include classifier generality and show that,
again, the models fit empirical evidence when the model assumptions hold.


2    The XCS Classifier System
We briefly describe XCS giving all the details that are relevant to this work. We refer the reader
to (Wilson, 1995; Butz & Wilson, 2002) for more detailed descriptions.
Knowledge Representation. In XCS, classifiers consist of a condition, an action, and four main
parameters: (i) the prediction p, which estimates the payoff that the system expects when the
classifier is used; (ii) the prediction error , which estimates the error affecting the prediction p;
(iii) the fitness F , which estimates the accuracy of the payoff prediction given by p; and (iv) the
numerosity num, which indicates how many copies of classifiers with the same condition and the


                                                 2
same action are present in the population.
Performance Component. At time t, XCS builds a match set [M] containing the classifiers
in the population [P] whose condition matches the current sensory input st ; if [M] contains less
than θnma actions, covering takes place and creates a new classifier that matches s t and has a
random action. For each possible action a in [M], XCS computes the system prediction P (s t , a)
which estimates the payoff that XCS expects if action a is performed in st . The system prediction
P (st , a) is computed as the fitness weighted average of the predictions of classifiers in [M] which
advocate action a. Then, XCS selects an action to perform; the classifiers in [M] which advocate
the selected action form the current action set [A]. The selected action a t is performed, and a scalar
reward R is returned to XCS.1
Parameter Updates. The incoming reward R is used to update the parameters of the classifiers
in [A]. First, the classifier prediction pk is updated as, pk ← pk + β(R − pk ). Next, the error k is
updated as, k ← k + β(|R − p| − k ). To update the classifier fitness F , the classifier accuracy κ
is first computed as,

                                                1             if ε < ε0
                                      κ=                                                                    (1)
                                                α(ε/ε0 )−ν    otherwise

the accuracy κ is used to compute the relative accuracy κ as, κ = κ/ [A] κi . Finally, the classifier
fitness F is updated towards the classifier’s relative accuracy κ as, F ← F + β(κ − F ).
Genetic Algorithm. On regular basis (dependent on the parameter θga ), the genetic algorithm is
applied to classifiers in [A]. It selects two classifiers, copies them, and with probability χ performs
crossover on the copies; then, with probability µ it mutates each allele. The resulting offspring
classifiers are inserted into the population and two classifiers are deleted to keep the population
size constant.
    Two selection mechanisms have been introduced so far for XCS: proportionate, roulette wheel,
selection (Wilson, 1995) and tournament selection (Butz, Sastry, & Goldberg, 2005). Roulette wheel
selects a classifier with a probability proportional to its fitness. Tournament randomly chooses the
τ percent of the classifiers in the action set and among these it selects the classifier with higher
“microclassifier fitness” fk computed as fk = Fk /nk (Butz, Sastry, & Goldberg, 2005; Butz, 2003).


3    Modeling Takeover Time
The analysis of takeover time in XCS poses two main challenges. First, while in genetic algorithms
the fitness of an individual is usually constant, in XCS classifier fitness changes over time based on
the other classifiers that appear in the same evolutionary niche. Second, while in genetic algorithms
the selection and the replacement of individuals are usually performed over the whole population,
in XCS selection is niche based, while deletion is population based.
    To model takeover time (Goldberg & Deb, 1990), we have to assume that XCS has already
converged to an optimal solution, which in XCS consists of non overlapping niches (Wilson, 1995).
Accordingly, we can focus on one niche without taking into account possible interactions among
overlapping niches. We consider a simplified scenario in which a niche contains two classifiers, cl 1
and cl 2 ; classifier cl k has fitness Fk , prediction error k , numerosity nk , and microclassifier fitness
fk = Fk /nk . In this initial phase, we focus on classifier accuracy and hypothesize that cl 1 be the
   1
     In this paper we focus on XCS viewed as a pure classifier, i.e., applied to single-step problems. A complete
description is given elsewhere (Wilson, 1995; Butz & Wilson, 2002).


                                                       3
“best” classifier in the niche, because is the most accurate, i.e., κ1 ≥κ2 , while we assume that cl 1 and
cl 2 are equally general and thus they have the same reproductive opportunities (this assumption
will be relaxed later in Section 7). Finally, we assume that deletion selects classifiers randomly from
the same niche. Although this assumption may appear rather strong, if the niches are activated
uniformly this assumption will have little effect as the empirical validation of the model will show
(Section 6).

3.1    Roulette Wheel Selection
Under Roulette Wheel Selection (RWS), the selection probability of a classifier depends on the
ratio of its fitness Fi over the fitness of all classifiers in the action set. Without loss of generality,
we assume that classifier fitness is a simple average of classifier’s relative accuracies and compute
the fitness of classifiers cl 1 and cl 2 as,
                                                    κ 1 n1          1
                                    F1 =                       =
                                               κ 1 n1 + κ 2 n2   1 + ρnr
                                                    κ 2 n2         ρnr
                                    F2 =                       =
                                               κ 1 n1 + κ 2 n2   1 + ρnr
where nr = n2 /n1 and ρ is the ratio between the accuracy of cl 2 and the accuracy of cl 1 (ρ = κ1 /κ2 ).
The probability Ps of selecting the best classifier cl 1 in the niche is computed as,
                                                 F1          1
                                        Ps =            =
                                               F1 + F 2   1 + ρnr
Once selected, a new classifier is created and inserted in the population while one classifier is
randomly deleted from the niche with probability Pdel (cl j ) = nj /n with n = n1 + n2 .
    We can now model the evolution of the numerosity of the best classifier cl 1 at time t, n1,t ,
which will (i) increase in the next generation if cl 1 is selected by the genetic algorithm and another
classifier is selected for deletion; (ii) decrease if cl 1 is not selected by the genetic algorithm but cl 1
is selected for deletion; (iii) remain the same, in all the other cases. More formally,
                                                               1         n1
                                          
                                           n1,t + 1         1+ρnr 1 − n
                                          
                                          
                                          
                                          
                                                                     1
                                                              1 − 1+ρnr n1
                                             n1,t − 1
                                n1,t+1 =                                    n
                                          
                                          
                                           n1,t             otherwise
                                          
                                          

where n is the niche size. This model is relaxed by assuming that only one classifier can be deleted
when sampling the niche it belongs. Grouping the equations above, we obtain,
                                                                 n1,t
                                                          1
                                     n1,t+1 = n1,t +           −
                                                       1 + ρnr    n
which can be rewritten in terms of the proportion Pt of classifiers cl 1 in the niche (i.e., Pt = n1,t /n).
Using the equality nr = (1 − Pt )/Pt we derive,
                                                  1   1      1
                                   Pt+1 = Pt +      ·       − Pt
                                                       1−Pt
                                                  n 1+ρ P    n
                                                          t

assuming Pt+1 − Pt ≈ dp/dt we have,
                                              1 Pt (1 − ρ) − Pt2 (1 − ρ)
                             dp
                                ≈ Pt+1 − Pt =                                                          (2)
                             dt               n      Pt (1 − ρ) + ρ


                                                      4
that is,
                                        Pt (1 − ρ) + ρ      1−ρ
                                                       dp =     dt                                    (3)
                                         Pt (1 − Pt )        n
which can be solved by integrating each side of the equation, between P0 , the initial proportion of
cl 1 , and the final proportion P of cl 1 up to which cl 1 has taken over,
                                P
                                    Pt (1 − ρ) + ρ      1−ρ                t(1 − ρ)
                                                   dp =             dt =                              (4)
                                     Pt (1 − Pt )        N                    N
                               P0

The left integral can be solved as follows:
                         P                          P
                             Pt (1 − ρ) + ρ             ρ(1 − Pt ) + Pt      t(1 − ρ)
                                            dp =                        dp =                          (5)
                              Pt (1 − Pt )                Pt (1 − Pt )           n
                        P0                         P0
                                             P            P
                                                 ρ              1          t(1 − ρ)
                                                   dp +               dp =                            (6)
                                            P0 P t       P0 (1 − Pt )          n
                                                    P          1−P         t(1 − ρ)
                                            ρ ln        − ln             =                            (7)
                                                   P0         1 − P0           n
from which we derive the takeover time of cl 1 in roulette wheel selection,
                                         N              P            1 − P0
                                t∗ =        ρ ln             + ln                                     (8)
                                 rws
                                        1−ρ             P0           1−P
The takeover time t∗ under the assumption that the two classifiers are equally general depends
                      rws
(i) on the ratio ρ between the accuracy of cl 2 and the accuracy of cl 1 , as well as, (ii) on the initial
proportion of cl 1 in the population. A higher ρ implies an increase in the takeover time. When
ρ = 1 (i.e., cl 1 and cl 2 are equally accurate), t∗ tends to infinity, that is, both cl 1 and cl 2 will
                                                   rws
remain in the population. When ρ is smaller, the takeover time decreases. For a ρ close to zero,
                                               1−P0
t∗ can be approximated by t∗      ρ→0 ≈ n ln 1−P . The takeover time also depends on the initial
 rws
proportion P0 of cl 1 in the population. A lower P0 increases the term inside the brackets, and so
it increases the takeover time. In contrast, an higher P0 results in a lower takeover time.

3.2    Tournament Selection
To model takeover time for tournament selection in XCS we assume a fixed tournament size of
s, instead of the typical variable tournament size (Butz, 2003). The underline assumption of the
takeover time analysis is that the system already converged to an optimal solution made of non
overlapping niches. Thus, there is basically no difference between a fixed tournament size and a
variable one. Tournament selection randomly chooses s classifiers in the action set and selects the
one with higher fitness. As before, we assume that cl 1 is the best classifier in the niche, which
in terms of tournament selection translates into requiring that f1 > f2 , where fi is the fitness of
the microclassifiers associated to cl i . In this case, the numerosity n1 of cl 1 will (i) increase if cl 1
participates in the tournament and another classifier is selected to be deleted; (ii) decrease if cl 1
does not participate in the tournament but is selected by the deletion operator; (iii) remain the
same, otherwise. More formally,
                                                                 s
                                  
                                                     1 − 1 − n1     1 − n1
                                   n1,t + 1                   n         n
                                  
                                  
                                                             s
                                  
                                                     1 − n1 n1
                                     n1,t − 1
                         n1,t+1 =                         n    n
                                  
                                   n1,t            otherwise
                                  
                                  


                                                        5
By grouping the above equations we derive the expected numerosity of cl 1 ,
                                           n1 s       n1         n1 s n1
                    nt+1 = nt + 1 − 1 −           1−     − 1−
                                           n          n           n       n
which we rewrite in terms of the proportion P of cl 1 in the niche (i.e., Pt = n1,t /n) as,
                                                 1
                                                   (1 − Pt ) 1 − (1 − Pt )s−1
                                Pt+1 = Pt +                                                      (9)
                                                 n
           dp
Assuming        ≈ Pt+1 − Pt , we derive,
           dt

                            dp               1
                                               (1 − Pt )[1 − (1 − Pt )s−1 ] ,
                               ≈ Pt+1 − Pt =                                                   (10)
                            dt               n
that is,
                                                    (1 − Pt )s−2
                                dt      1
                                   =         dp +                  dp
                                                  1 − (1 − Pt )s−1
                                n     1 − Pt
Integrating each side of the equation we obtain,
                                         P                   P
                                                                   (1 − Pt )s−2
                               dt              1
                                  =                 dp +                          dp
                                                                 1 − (1 − Pt )s−1
                               n             1 − Pt
                                       P0                   P0

i.e.,
                                                         1 − (1 − P )s−1
                          t          1 − P0      1
                             = ln            +       ln
                                                         1 − (1 − P0 )s−1
                          n          1−P       s−1
so that the takeover time of cl 1 for tournament selection is,
                                                               1 − (1 − P )s−1
                                         1 − P0          1
                         t∗ S = n ln                +       ln                                 (11)
                          T
                                                               1 − (1 − P0 )s−1
                                         1−P            s−1
Given our assumptions, takeover time for tournament selection depends on the initial proportion
of the best classifier P0 and the tournament size s. Both logarithms on the right hand side take
positive values if P > P0 , indicating that the best classifier will always take over the population
regardless of its initial proportion in the population. When P < P0 , both logarithms result in
negative values, and so does the takeover time.


4       Comparison
We now compare the takeover time for roulette wheel selection and tournament selection and we
study the salient differences between the models. For this purpose, we compute the values of s
and ρ for which, (i) the two selection schemes have the same initial increase of the proportion of
the best classifier, and for which (ii) the two selection schemes have the same takeover time. This
analysis results in two expressions that permit to compare the behavior of roulette wheel selection
and tournament selection in different scenarios.
    First, we analyze the relation between the ratio of classifier accuracies ρ and the selection
pressure s in tournament selection to obtain the same initial increase in the proportion of the best
classifier with both selection schemes. Taking the equations 2 and 10, and replacing P t by P0 we
get that the initial increase of the best classifier in each selection scheme is:
                                                 1 − ρ P0 (1 − P0 )
                                ∆RW S        =
                                                   n (1 − ρ)P0 + ρ
                                                 1
                                                   (1 − P0 )[1 − (1 − P0 )s−1 ]
                                  ∆T S       =
                                                 n

                                                        6
By requiring ∆RW S = ∆T S , we obtain,

                           1 − ρ P0 (1 − P0 )   1 − P0
                                                       [1 − (1 − P0 )s−1 ],
                                              =
                             n (1 − ρ)P0 + ρ      n

that is,
                                   Pt (1 − ρ)
                                               = 1 − (1 − Pt )s−1 ,
                                 (1 − ρ)Pt + ρ
                                            ln ρ − ln [(1 − ρ)P0 + ρ]
                                  s=1+                                                            (12)
                                                   ln(1 − P0 )
This equation indicates that, in tournament selection, the tournament size s which regulates the
selection pressure has to increase as the ratio of accuracies ρ decreases to have the same initial
increase of the best classifier in the population as roulette wheel selection. For example, for ρ = 0.01
and P0 = 0.01, tournament selection requires s = 70 to produce the same initial increase of the best
classifier as roulette wheel selection. On the other hand, low values of s result in the same effect
as roulette wheel selection with high values of ρ. Equation 12 indicates that, even with a small
tournament size, tournament selection produces a stronger pressure towards the best classifier in
scenarios in which slightly inaccurate but initially highly numerous classifiers are competing against
highly accurate classifiers. On the other hand, when the competition involves highly inaccurate
classifiers, a larger tournament size s is required to obtain the same selection pressure provided by
roulette wheel selection.
    We now analyze the conditions under which both selection schemes result in the same takeover
time. For this purpose, we equate t∗ S in Equation 8 with t∗ S in Equation 11,
                                       RW                       T

                                   t∗ S = t ∗ S                                                   (13)
                                    RW      T
                                                                                       P ∗ )s−1
                  P∗
      n                       1 − P0                  1 − P0        1         1 − (1 −
         ρ ln          + ln               = n ln               +       ln                         (14)
                                                                              1 − (1 − P0 )s−1
     1−ρ          P0          1 − P∗                  1 − P∗       s−1

Which can be rewriten as follows:
                                                               1 − (1 − P ∗ )s−1
                                 P ∗ (1 − P0 )
                        ρ                              1
                           ln                     =       ln                       .
                                                               1 − (1 − P0 )s−1
                       1−ρ       P0 (1 − P ∗ )        s−1

By approximating (1 − x)s−1 by its first order Taylor series at the point 0, that is, (1 − x)s−1 =
1 + (s − 1)x, and by futher simplifications, we derive,

                                       1 − (1 − P ∗ )s−1                 P∗
                            1                                   1
                               ln                          =       ln                             (15)
                                       1 − (1 − P0 )s−1
                           s−1                                 s−1       P0

Reorganizing, we obtain the following relation:

                                                 ln(P ∗ ) − ln(P0 )
                                    1−ρ
                           s=1+                                                                   (16)
                                     ρ ln[P ∗ (1 − P0 )] − ln[P0 (1 − P ∗ )]

Given an initial proportion of the best classifier, the equation is guided by the term 1−ρ . As the
                                                                                        ρ
accuracy-ratio ρ decreases, s needs to increase polynomially. On the other hand, higher values of ρ
require a low tournament size s. Thus, Equation 16 reaches the same conclusions of Equation 12:
tournament selection is better than roulette wheel in scenarios where highly accurate classifiers
compete with slightly inaccurate ones.


                                                      7
5    Test Problems
To validate the models of takeover time for roulette wheel and proportionate selection, we designed
two test problems. The single-niche problem fully agrees with the model assumption. It consists
of a niche with a highly accurate classifier cl 1 and a less accurate classifier cl 2 . The covering is off
and the population is initialized with N · P0 copies of cl 1 and N · (1 − P0 ) copies of cl 2 , where N
is the population size. The prediction error 1 of the best classifier cl 1 is always set to zero while
the prediction error 2 of cl 2 is set as,
                                                      ρν
                                             2= 0                                                   (17)
                                                      α
where ρ is the ratio between the accuracy of cl 2 and the accuracy of cl 1 (i.e., ρ = κ2 /κ1 ; Section 3).
    The multiple-niche problem consists of a set of m niches each one containing one maximally
accurate classifier and one classifier that belongs to all niches. The population contains P 0 · N
copies of maximally accurate classifiers (equally distributed in the m niches) and (1 − m · P 0 ) · N
copies of the classifier that appears in all the niches. The parameters of classifiers are updated as
in the case of the single niche in the previous section, permitting to vary the ratio of accuracies
ρ, and so, validating the model under different circumstances. This test problem violates two
model assumptions. First, the size of the different niches differ from the population size since the
problem consists of more than one niche. While in the model we assumed that the deletion would
always select a classifier in the same niche, in this case deletion can select any classifier from the
population. Second, the niches are overlapping since there is a classifier that belongs to all the
niches. This also means that the sum of all niche sizes will be greater than the population size, i.e.,
   m
   1 (ni,1 + ni,2 ) > N , where ni,1 is the numerosity of the maximally accurate classifier in niche i
and ni,1 is the numerosity of the less accurate classifier in the niche i.


6    Experimental Validation
We validated the takeover time models using the single-niche problem and the multiple-niche
problem. Our results show a full agreement between the model and the experiments in the single-
niche problem, when all the model assumptions hold. They also show that the theory correctly
predicts the practical results in problems where the initial assumptions do not hold, if either the
accuracy-ratio is low enough in roulette wheel selection or the tournament size is high enough in
tournament selection.
Single-Niche. At first, we applied XCS on the single-niche problem and analyzed the proportion
of the best classifier cl 1 under roulette wheel selection and tournament selection. Figure 1 compares
the proportion of the best classifier in the niche as predicted by our model (reported as lines) and
the empirical data (reported as dots) for roulette wheel selection and tournament selection with
s = {2, 3, 9} when ρ = 0.01. The empirical data are averages over 50 runs. Figure 1 shows a
perfect match between the theory and the empirical results. It also shows that, as predicted by
the models and discussed in Section 4, roulette wheel produces a faster increase in the proportion
of the best classifier for ρ = 0.01. To obtain a similar increase with tournament selection we need
a higher tournament size: in fact, the second best increase in the proportion of the best classifier
is provided by tournament selection with s = 9. Finally, as indicated by the theory, the time to
achieve a certain proportion of the best classifier in tournament selection increases as the selection
pressure decreases.
    We performed another set of experiments and compared the proportion of the best classifier
in the niche for an accuracy ratio ρ of 0.5 and 0.9. Figure 2 compares the proportion of cl 1 as

                                                    8
Takeover time for ρ = 0.01
                                                                    1


                                                                   0.9


                                                                   0.8


                                                                   0.7


                               Proportion of the Best Classifier
                                                                                                                           Empirical RWS
                                                                   0.6                                                     Model RWS
                                                                                                                           Empirical TS s=2
                                                                                                                           Model TS s=2
                                                                   0.5
                                                                                                                           Empirical TS s=3
                                                                                                                           Model TS s=3
                                                                                                                           Empirical TS s=9
                                                                   0.4
                                                                                                                           Model TS s=9

                                                                   0.3


                                                                   0.2


                                                                   0.1


                                                                    0
                                                                     0   2000   4000   6000         8000       10000   12000     14000        16000
                                                                                        Activation Time of the Niche


Figure 1: Empirical and theoretical takeover time when ρ = 0.01 for roulette wheel selection and
tournament selection with s=2, s=3 and s=9.


predicted by our model (reported as lines) and the empirical data (reported as dots) for (a) ρ = 0.5
and (b) ρ = 0.9; the empirical data are averages over 50 runs. The results show a good match
between the theory and the empirical results. As predicted by the model, tournament selection is
not influenced by the increase of ρ: the increase in the proportion of cl 1 for ρ = 0.5 (Figure 2a)
is basically the same as the increase obtained when ρ = 0.9 (Figure 2b). Thus, coherently to
what empirically shown in (Butz, Sastry, & Goldberg, 2005), tournament selection demonstrates
its robustness in maintaining and increasing the proportion of the best classifier even when there is
a small difference between the fitness of the most accurate classifier (cl 1 ) and the fitness of the less
accurate one (cl 2 ). In contrast, roulette wheel selection is highly influenced by the accuracy ratio ρ:
as the ratio approaches 1, i.e., the accuracy of the two classifiers become very similar, the increase
in the proportion of the best classifier becomes smaller and smaller. In fact, when ρ = 0.90, after
16000 activations of the niche the best classifier cl 1 has taken over only the 5% of the niche.
Multiple-niche. In the next set of experiments, we validated our model of takeover time on the
multiple-niche problem, where the assumptions about non-overlapping niches and about deletion
being performed in the niche are violated. For this purpose, we ran XCS on the multiple-niche
problem with two niches (m = 2); each niche contains one maximum accurate classifier and there
is one, less accurate, overlapping classifier that participates in both niches.
    Figure 3a compares the proportion of the best classifier in the niche for roulette wheel selection
for an accuracy ratio ρ of 0.01 and 0.20. The plots indicate that, for small values of the accuracy
ratio ρ, our model (reported as lines) slightly underestimates the empirical takeover time (reported
as dots). As the accuracy ratio ρ increases, the model tends to overestimate the empirical data
(Figure 3b). This behavior can be easily explained. The lower the accuracy ratio (Figure 3a), the
higher the pressure toward the highly accurate classifiers, and consequently, the faster the takeover
time. When ρ is 0.20 and 0.30, the difference between the model and the empirical results is
visible only at the beginning, while it basically disappears as the number of activations increases.
For higher values of ρ, the overgeneral, less accurate, cl 2 has more reproductive opportunities in
both niches it participates. These results indicate that (i) the model for roulette wheel selection is
accurate in general scenarios if the ratio of accuracies is small (i.e., when there is a large proportion
of accurate classifiers in the niche); (ii) in situations where there is a small proportion of the best
classifier in one niche competing with other slightly inaccurate and overgeneral classifiers (above


                                                                                                 9
Takeover time for ρ = 0.50                                                                                                  Takeover time for ρ = 0.90
                                          1                                                                                                                           1


                                         0.9                                                                                                                         0.9


                                         0.8                                                                                                                         0.8
                                                                                                                                                                                                                           Empirical RWS
                                                                                                                                                                                                                           Model RWS
                                         0.7                                                                                                                         0.7
     Proportion of the Best Classifier


                                                                                                                                 Proportion of the Best Classifier
                                                                                                                                                                                                                           Empirical TS s=2
                                                                                                                                                                                                                           Model TS s=2
                                                                                                 Empirical RWS
                                                                                                                                                                                                                           Empirical TS s=3
                                         0.6                                                                                                                         0.6
                                                                                                 Model RWS
                                                                                                                                                                                                                           Model TS s=3
                                                                                                 Empirical TS s=2
                                                                                                                                                                                                                           Empirical TS s=9
                                                                                                 Model TS s=2
                                         0.5                                                                                                                         0.5                                                   Model TS s=9
                                                                                                 Empirical TS s=3
                                                                                                 Model TS s=3
                                                                                                 Empirical TS s=9
                                         0.4                                                                                                                         0.4
                                                                                                 Model TS s=9

                                         0.3                                                                                                                         0.3


                                         0.2                                                                                                                         0.2


                                         0.1                                                                                                                         0.1


                                          0                                                                                                                           0
                                           0   2000   4000   6000         8000       10000   12000     14000        16000                                              0   2000   4000   6000         8000       10000   12000     14000      16000
                                                              Activation Time of the Niche                                                                                                Activation Time of the Niche


                                                                     (a)                                                                                                                        (b)


Figure 2: Empirical and theoretical takeover time for roulette wheel selection and tournament
selection with s=2, s=3 and s=9 when (a) ρ = 0.50 and (b) ρ = 0.90.


a certain threshold of ρ), the overgeneral classifier may take over the population removing all the
copies of the best classifier. It is interesting to note that, as the number of niches increases from
m = 2 to m = 16, the agreement between the theory and the experiments gently degrades (see
appendix A for more results).
    Figure 4a compares the proportion of the best classifier as predicted by our model and as
empirically determined in tournament selection with s = 9. As in roulette wheel selection for
a small ρ, the results for tournament selection show that the empirical takeover time is slightly
faster than the one predicted by the theory. Again, this behavior is due to the presence of the
overgeneral classifier in both niches, causing a higher pressure toward its deletion. Increasing the
tournament size s produces little variations in either the empirical results or the theoretical values,
and so the conclusions extracted for s = 9 can be extended for a higher s. On the other hand,
decreasing s causes the empirical values to go closer to the theoretical values, since the pressure
toward the deletion of the overgeneral classifier decreases. Figure 4b reports the proportion of one
of the maximum accurate classifiers for s ∈ {2, 3}. The results show that the theory accurately
predicts the empirical values for s = 3, but for s = 2 the difference between the model and the
data is large. In this case, a small tournament size combined with the presence of the overgeneral
classifier in both niches produces a strong selection pressure toward the overgeneral classifier that
delays the takeover time.
    The results in the multi-niche problem confirm what empirically shown in (Butz, Sastry, &
Goldberg, 2005): tournament selection is more robust than roulette wheel selection. Under perfect
conditions both schemes perform similarly, which is coherent to what shown in (Kharbat, Bull, &
Odeh, 2005). However, the takeover time of the best classifier is delayed in roulette wheel selection
for an higher accuracy ratio ρ. The empirical results indicate that, with roulette wheel selection,
the best classifier was eventually removed from the population when ρ ≥ 0.5. On the other hand,
tournament selection demonstrated theoretically and practically to be more robust, since it does
not depend on the individual fitness of each classifier. In all the experiments with tournament
selection, the best classifier could take over the niche, and only for the extreme case (i.e., for s = 2)


                                                                                                                            10
Takeover time in RWS for Overlapping Niches and δ={0.01,0.20}                                                               Takeover time in RWS for Overlapping Niches and ρ={0.30,0.40,0.50}
                                                                                                                                                                    1
                                         1


                                                                                                                                                                   0.9
                                        0.9


                                                                                                                                                                   0.8
                                        0.8
    Proportion of the Best Classifier


                                                                                                                               Proportion of the Best Classifier
                                                                                           Empirical RWS δ=0.01                                                                                                         Empirical RWS ρ=0.30
                                                                                                                                                                   0.7
                                        0.7
                                                                                           Model RWS δ=0.01                                                                                                             Model RWS ρ=0.30
                                                                                           Empirical RWS δ=0.20                                                                                                         Empirical RWS ρ=0.40
                                                                                           Model RWS δ=0.20                                                                                                             Model RWS ρ=0.40
                                                                                                                                                                   0.6
                                        0.6


                                                                                                                                                                   0.5
                                        0.5


                                                                                                                                                                   0.4
                                        0.4


                                                                                                                                                                   0.3
                                        0.3


                                        0.2                                                                                                                        0.2


                                        0.1                                                                                                                        0.1
                                           0   2000     4000      6000       8000      10000    12000    14000    16000                                               0     2000      4000      6000       8000      10000    12000     14000    16000
                                                                 Activation Time of the Niche                                                                                                  Activation Time of the Niche


                                                                         (a)                                                                                                                           (b)


Figure 3: Takeover time for roulette wheel selection when (a) ρ = {0.01, 0.20} and (b) ρ ∈
{0.30, 0.40}.


the experiments considerably disagreed with the theory.


7                    Modeling Generality
Finally, we extend our model of takeover time with classifier generality. As before, we model the
proportion of the best classifier cl 1 in one niche, however, in this case cl 1 is not only the maximally
accurate classifier in the niche, but also the maximally general with respect to niche; thus cl 1 is now
the best classifier in the most typical XCS sense (Wilson, 1998). We focus on one niche and assume
that cl 1 , being the maximally general and maximally accurate classifier for the niche, appears in the
niche with probability 1 so that cl 2 appears in the niche with a relative probability ρm . Similarly
to what we previously did in Section 3, we can model the numerosity of the classifier cl 1 at time
t, n1,t as follows. The numerosity n1,t of cl 1 in the next generation will (i) increase when both
cl 1 and cl 2 appear in the niche and cl 1 is selected by the genetic algorithm while cl 2 is selected
for deletion; (ii) increase when only cl 1 appears in the niche and another classifier is deleted; (iii)
decrease only if both cl 1 and cl 2 are in the niche, cl 1 is not selected by the genetic algorithm but
it is selected for deletion. Otherwise, the numerosity of cl 1 will remain the same. More formally,
                              
                                                 1
                                                       1 − n1 + (1 − ρm ) 1 − n1
                              n1,t + 1 ρm 1+ρn               n                    n
                                                    r
                              
                              
                                                                                                      1                                                              n1
                                                               n1,t+1 =
                                                                                  n1,t − 1 ρm 1 − 1+ρnr                                                             n
                                                                                  
                                                                                    n1,t    otherwise
                                                                                  

As done before, we can group these equations to obtain,

                                                                                                                          n1,t                                                                             n1,t
                                                                                                                   1
                                                                 n1,t+1 = n1,t + ρm                                     −                                                 + (1 − ρm ) 1 −
                                                                                                                1 + ρnr    n                                                                                n


                                                                                                                          11
Takeover time in TS s=9 for Overlapping Niches                                                                                Takeover time in TS s={2,3} for Overlapping Niches
                                         1                                                                                                                              1


                                        0.9                                                                                                                            0.9


                                        0.8                                                                                                                            0.8
    Proportion of the Best Classifier


                                                                                                                                   Proportion of the Best Classifier
                                                                                                   Empirical TS s=9
                                                                                                   Model TS s=9
                                        0.7                                                                                                                            0.7


                                                                                                                                                                                                                                   Empirical TS s=2
                                        0.6                                                                                                                            0.6
                                                                                                                                                                                                                                   Model TS s=2
                                                                                                                                                                                                                                   Empirical TS s=3
                                        0.5                                                                                                                            0.5                                                         Model TS s=3


                                        0.4                                                                                                                            0.4


                                        0.3                                                                                                                            0.3


                                        0.2                                                                                                                            0.2


                                        0.1                                                                                                                            0.1
                                           0    2000   4000      6000       8000      10000    12000     14000        16000                                               0   2000    4000       6000       8000      10000    12000      14000       16000
                                                                Activation Time of the Niche                                                                                                    Activation Time of the Niche


                                                                        (a)                                                                                                                             (b)


                                               Figure 4: Takeover time for tournament selection when (a) s = 9, (b) s ∈ {2, 3}.


we rewrite n1,t in terms of the proportion Pt of cl 1 in the niche (Pt = n1,t /n with nr = (1 − Pt )/Pt )
and obtain,
                                    1      1 − Pt
                       Pt+1 = Pt + ·                    [(1 − ρ)Pt + (1 − ρm ))ρ]
                                    n ρ + (1 − ρ)Pt
Assuming Pt+1 − Pt ≈ dp/dt,

                                                              dp              1     1 − Pt
                                                                 ≈ Pt+1 − Pt = ·                [(1 − ρ)Pt + (1 − ρm ))ρ]
                                                              dt              n rho + (1 − ρ)Pt

which can be simplified as follows:

                                                                                               ρ + (1 − ρ)P               1
                                                                                                                      dP = dt
                                                                                     (1 − P ) [(1 − ρ)P + ρ(1 − ρm )]     n

Integrating the above equation with initial conditions t = 0, Pt = P0 , we get the takeover time as:

                                                                                                           n         1 − P0
                                                                                 t∗
                                                                                  rws =                          ln           +
                                                                                                        1 − ρρm       1−P
                                                                                                                (1 − ρ)P + ρ(1 − ρm )
                                                                                               +        ρρm ln                                                                                                                                                (18)
                                                                                                                (1 − ρ)P0 + ρ(1 − ρm )

which depends on the ratio of accuracies ρ, the initial proportion of the best classifier P 0 and the
generality of the inaccurate classifier, represented by ρm . In the previous model, cl 1 would not
take over the niche when it was as accurate as cl 2 (Section 3). In this case, cl 1 will take over the
population if it is either more accurate or more general than cl 2 . Otherwise, if cl1 and cl2 are
equally accurate and general, both will persist in the population (t∗ S → ∞), coherently with
                                                                        RW
the previous model. Low values of ρm suppose quicker takeover times than high values of ρm . For
ρm = 1, i.e., the classifiers cl1 and cl2 are equally general, Equation 18 is equivalent to Equation 8.


                                                                                                                              12
Similarly, we extend the model of takeover time for tournament selection taking classifier gen-
erality into account. In this case, the numerosity n1,t of cl 1 at time t is,
                                  
                                  n1,t + 1 ρm 1 − 1 − n1 s ·
                                                             n
                                  
                                  
                                             · 1 − n1 + (1 − ρm ) 1 − n1
                                  
                                  
                                                    n                       n
                         n1,t+1 =
                                  n1,t − 1 ρm 1 − n1 s n1
                                                       n     n
                                  
                                  
                                  
                                  n         otherwise.
                                      1,t

Grouping these equations, we obtain:
                              n1 s        n1                  n1                n1 s n1
    nt+1 = nt + ρm 1 − 1 −            1−      + (1 − ρm ) 1 −      − ρm 1 −             ,    (19)
                              n           n                   n                 n     n
As we did before, we can group these equations and we can rewrite n 1,t+1 in terms of Pt as,
                                              1
                                                (1 − Pt ) 1 − ρm (1 − Pt )s−1
                              Pt+1 = Pt +
                                              n
                     dp
which, by assuming        ≈ Pt+1 − Pt :
                     dt


                           dp                 1
                                                 (1 − Pt )[1 − ρm (1 − Pt )s−1 ]
                              ≈ Pt+1 − Pt =                                                     (20)
                           dt                 n
                           dt                 1
                              =                                 dp                              (21)
                                (1 − Pt )[1 − ρm (1 − Pt )s−1 ]
                            n
                                               ρm (1 − Pt )s−2
                           dt      1
                              =        dp +                        dp                           (22)
                                             1 − ρm (1 − Pt )s−1
                            n   1 − Pt
Integrating each side of the expression we obtain:

                                      P                   P
                                                                ρm (1 − Pt )s−2
                            dt              1
                               =                 dp +                             dp            (23)
                                                              1 − ρm (1 − Pt )s−1
                            n             1 − Pt
                                   P0                    P0
                                                               1 − ρm (1 − P )s−1
                             t            1 − P0         1
                               = ln                +        ln                                  (24)
                                                               1 − ρm (1 − P0 )s−1
                             n            1−P           s−1
Thus, the takeover time of the classifier cl1 in tournament selection is:
                                                               1 − ρm (1 − P )s−1
                                          1 − P0         1
                      t∗ S = n ln                  +        ln                                  (25)
                       T
                                                               1 − ρm (1 − P0 )s−1
                                          1−P           s−1
Takeover time for tournament selection now depends on the tournament size s, the initial proportion
of the best classifier P0 , and also on the generality of the inaccurate classifier ρm . For low ρm or
high s, the value of the second logarithm in the right term of the equation diminishes so that
the takeover time mainly depends logarithmically on P0 . High values of ρm imply slower takeover
times; for ρm = 1, this model equates to Equation 11.
    We validated the new models of takeover time for roulette wheel selection and tournament
selection on the single-niche problem for a matching ratio ρm of 0.1 and 0.9. The experimental
design is essentially the same one used in the previous experiments (Section 6), but in this case
the less accurate and less general classifier cl 2 appears in the niche with probability ρm . Figure 5
compares the proportion of the best classifier cl 1 in the niche as predicted by the theory and
empirically determined. Both the plots for roulette wheel selection (Figure 5) and tournament
selection (Figure 6) show a perfect match between the theory (reported as lines) and the empirical
data (reported as dots).

                                                         13
Takeover time for ρ = 0.10                                                                                 Takeover time for ρ = 0.90
                                                                               m                                                                                                           m
                                         1                                                                                                                  1

                                        0.9                                                                                                                0.9

                                        0.8                                                                                                                0.8
    Proportion of the Best Classifier


                                                                                                                       Proportion of the Best Classifier
                                        0.7                                                                                                                0.7

                                                                                    Empirical RWS ρ=0.10
                                        0.6                                                                                                                0.6
                                                                                    Model RWS ρ=0.10
                                                                                    Empirical RWS ρ=0.30
                                        0.5                                                                                                                0.5
                                                                                    Model RWS ρ=0.30
                                                                                                                                                                                                  Empirical RWS ρ=0.10
                                                                                    Empirical RWS ρ=0.50
                                                                                                                                                                                                  Model RWS ρ=0.10
                                        0.4                                                                                                                0.4
                                                                                    Model RWS ρ=0.50
                                                                                                                                                                                                  Empirical RWS ρ=0.30
                                                                                    Empirical RWS ρ=0.70
                                                                                                                                                                                                  Model RWS ρ=0.30
                                                                                    Model RWS ρ=0.70
                                        0.3                                                                                                                0.3
                                                                                                                                                                                                  Empirical RWS ρ=0.50
                                                                                    Empirical RWS ρ=0.90
                                                                                                                                                                                                  Model RWS ρ=0.50
                                                                                    Model RWS ρ=0.90
                                        0.2                                                                                                                0.2
                                                                                                                                                                                                  Empirical RWS ρ=0.70
                                                                                                                                                                                                  Model RWS ρ=0.70
                                                                                                                                                                                                  Empirical RWS ρ=0.90
                                        0.1                                                                                                                0.1
                                                                                                                                                                                                  Model RWS ρ=0.90
                                         0                                                                                                                  0
                                          0   1000   2000    3000       4000       5000    6000     7000   8000                                              0   0.5   1             1.5            2         2.5               3
                                                            Activation Time of the Niche                                                                                Activation Time of the Niche                        4
                                                                                                                                                                                                                         x 10


                                                                    (a)                                                                                                         (b)


                    Figure 5: Takeover time for roulette wheel selection when (a) ρm is 0.1 and (b) ρm is 0.9.


8                                       Conclusions
We have derived theoretical models for the selection pressure in XCS under roulette wheel and tour-
nament selection. We have shown that our models are accurate in very simplified scenarios, when
the models’ assumptions hold, and they can qualitatively explain the behavior of the two selection
mechanisms in more complex scenarios, when the models’ assumptions do not hold. Overall, our
models confirm what empirically shown in (Butz, Sastry, & Goldberg, 2005): tournament selection
is more robust than roulette wheel selection. Under perfect conditions both schemes perform sim-
ilarly, which is coherent to what shown in (Kharbat, Bull, & Odeh, 2005). However, the selection
pressure is weaker in roulette wheel selection when the classifiers in the niche have similar accura-
cies. On the other hand, tournament selection turns out to be more robust both theoretically and
practically, since it does not depend on the individual fitness of each classifier.


Acknowledgements
This work was sponsored by Enginyeria i Arquitectura La Salle, Ramon Llull University, as well
as the support of Ministerio de Ciencia y Tecnolog´ under project TIN2005-08386-C05-04, and
                                                     ıa
Generalitat de Catalunya under Grants 2005FI-00252 and 2005SGR-00302.
    This work was also sponsored by the Air Force Office of Scientific Research, Air Force Materiel
Command, USAF, under grant FA9550-06-1-0096, the National Science Foundation under grant
DMR-03-25939 at the Materials Computation Center. The U.S. Government is authorized to
reproduce and distribute reprints for government purposes notwithstanding any copyright notation
thereon. The views and conclusions contained herein are those of the authors and should not
be interpreted as necessarily representing the official policies or endorsements, either expressed or
implied, of the Air Force Office of Scientific Research, the National Science Foundation, or the U.S.
Government.


                                                                                                                  14
Takeover time for ρ = 0.10                                                                                                       Takeover time for ρ = 0.90
                                                                                    m                                                                                                                                m
                                       1                                                                                                                                1

                                      0.9                                                                                                                              0.9

                                      0.8                                                                                                                              0.8
  Proportion of the Best Classifier


                                                                                                                                   Proportion of the Best Classifier
                                      0.7                                                                                                                              0.7

                                      0.6                                                                                                                              0.6

                                      0.5                                                                                                                              0.5

                                      0.4                                                                                                                              0.4
                                                                                                     Empirical TS s=2                                                                                                                 Empirical TS s=2
                                                                                                     Model TS s=2                                                                                                                     Model TS s=2
                                                                                                     Empirical TS s=3                                                                                                                 Empirical TS s=3
                                      0.3                                                                                                                              0.3
                                                                                                     Model TS s=3                                                                                                                     Model TS s=3
                                                                                                     Empirical TS s=10                                                                                                                Empirical TS s=10
                                      0.2                                                                                                                              0.2
                                                                                                     Model TS s=10                                                                                                                    Model TS s=10
                                                                                                     Empirical TS s=70                                                                                                                Empirical TS s=70
                                                                                                     Model TS s=70                                                                                                                    Model TS s=70
                                      0.1                                                                                                                              0.1

                                       0                                                                                                                                0
                                        0   1000   2000   3000     4000      5000     6000    7000    8000    9000   10000                                               0   1000   2000   3000     4000      5000     6000    7000    8000    9000   10000
                                                                 Activation Time of the Niche                                                                                                     Activation Time of the Niche


                                                                                                                             (b)

                                       Figure 6: Takeover time for tournament selection when (a) ρm is 0.1 and (b) ρm is 0.9.


References
 Bull, L. (2001). Simple markov models of the genetic algorithm in classifier systems: Accuracy-
    based fitness. In Lanzi, P. L., Stolzmann, W., & Wilson, S. W. (Eds.), Advances in Learning
    Classifier Systems: Proceedings of the Third International Workshop, LNAI 1996 (pp. 21–28).
    Berlin Heidelberg: Springer-Verlag.
 Butz, M., Goldberg, D. E., & Tharakunnel, K. K. (2003). Analysis and improvement of fitness
    exploitation in xcs: Bounding models, tournament selection, and bilateral accuracy. Evolu-
    tionary Computation, 11 (3), 239–277.
 Butz, M., Goldberg, D. G., & Lanzi, P. L. (2004, 26-30 June). Bounding learning time in xcs. In
    Genetic and Evolutionary Computation – GECCO-2004, LNCS (pp. 739–750). Seattle, WA,
    USA: Springer-Verlag.
 Butz, M., Goldberg, D. G., Lanzi, P. L., & Sastry, K. (2004, November). Bounding the population
    size to ensure niche support in xcs (Technical Report 2004033). Illinois Genetic Algorithms
    Laboratory – University of Illinois at Urbana-Champaign.
 Butz, M. V. (2003). Documentation of XCS+TS c-code 1.2 (Technical Report 2003023). Illinois
    Genetic Algorithm Laboratory (IlliGAL), University of Illinois at Urbana-Champaign.
 Butz, M. V., Kovacs, T., Lanzi, P. L., & Wilson, S. W. (2004, February). Toward a theory of
    generalization and learning in xcs. IEEE Transaction on Evolutionary Computation, 8 (1),
    28–46.
 Butz, M. V., Sastry, K., & Goldberg, D. E. (2005). Strong, stable, and reliable fitness pressure in
    XCS due to tournament selection. Genetic Programming and Evolvable Machines, 6 , 53–77.
 Butz, M. V., & Wilson, S. W. (2002). An algorithmic description of XCS. Journal of Soft Com-
    puting, 6 (3–4), 144–153.
 Goldberg, D. E. (2002). The design of innovation: Lessons from and for competent genetic
    algorithms. Kluwer Academic Publishers.
 Goldberg, D. E., & Deb, K. (1990). A comparative analysis of selection schemes used in genetic
    algorithms. In Rawlins, G. J. E. (Ed.), FOGA (pp. 69–93). Morgan Kaufmann.

                                                                                                                             15
Holland, J.H. (1975). Adaptation in Natural and Artificial Systems. The University of Michigan
     Press.
  Horn, J., Goldberg, D. E., & Deb, K. (1994). Implicit niching in a learning classifier system:
     Nature’s way. Evolutionary Computation, 2 (1), 37–66.
  Kharbat, F., Bull, L., & Odeh, M. (2005, 2-5 September). Revisiting genetic selection in the xcs
    learning classifier system. In Congress on Evolutionary Computation, Volume 3 (pp. 2061–
    2068). Edinburgh, UK: IEEE.
  Wilson, S. W. (1995). Classifier Fitness Based on Accuracy. Evolutionary Computation, 3 (2),
     149–175. http://prediction-dynamics.com/.
  Wilson, S. W. (1998). Generalization in the XCS classifier system. In Genetic Programming 1998:
     Proceedings of the Third Annual Conference (pp. 665–674). Morgan Kaufmann.


A     Experimental Validation on the 16-Niche Problem
Finally, we aim at analyzing if the agreement between the theory and the empirical observations
degrade if the number of overlapping niches increases. For this purpose, we ran XCS on the
multiple-niche problem fixing the number of niches to m=16. That is, the problem consisted of 16
niches, one maximum accurate classifier per niche, and one less accurate, overlapping classifier that
participates in all the 16 niches. Figure 7(a) and 7(b) compare the proportion of the best classifier
in the niche for roulette wheel selection for ρ={0.01,0.20,0.30,0.40}. The plots show that, for small
values of the accuracy ratio ρ, the empirical takeover time (reported as dots) is slightly slower than
the one predicted by our model (reported as lines). For higher values of ρ, the difference between the
model and the empirical results is more pronounced. So, we find a similar behavior to the multiple-
niche problem with two niches. But now, increasing the number of niches also delays the takeover
time, and the agreement between the model and the empirical results degrades faster as ρ increases.
This difference can be easily explained. As m increases, the ovegeneral classifier participates in a
higher proportion of action sets than any of the m best classifiers. Thus, the overgeneral classifier
will receive an increasing proportion of reproductive events with respect to the best classifiers as
m increases. Lower values of ρ produce a strong pressure toward accurate classifiers, and so, even
increasing the number of niches, the model nicely approximates the empirical results.
    Figure 8(a) and 8(b) compare the proportion of the best classifier in the niche for tournament
selection for s={2,3,9}. For s=9, the theory accurately predics the empirical results. Increasing
the tournament size produces very little variations. For s=3, theory and practical results slightly
differ at the beginning of the run, but this difference disappears as the number of activations
increases. For s=2, the difference is large; that small tournament size combined with the presence
of the overgeneral classifier in all niches produces a strong selection pressure toward the overgeneral
classifier. As happened in roulette wheel selection, augmenting the number of overlapping niches
increases the selection pressure toward the overgeneral classifier, since the proportion of the action
sets that the overgeneral participates in with respect to the best classifier increases with the number
of niches. For higher values of s, i.e., s=9, the strong selection pressure toward accurate classifiers
can counterbalance this effect.


                                                 16
Takeover time in RWS for 16 Niches with Overlapping Classifiers and ρ={0.01,0.20}                                                  Takeover time in RWS for 16 Niches with Overlapping Classifiers and ρ={0.30,0.40,0.50}
                                         1                                                                                                                                       1

                                        0.9                                                                                                                                     0.9

                                        0.8                                                                                                                                     0.8
    Proportion of the Best Classifier


                                                                                                                                            Proportion of the Best Classifier
                                                                                                  Empirical RWS ρ=0.01                                                                                                                   Empirical RWS ρ=0.30
                                        0.7                                                                                                                                     0.7
                                                                                                  Model RWS ρ=0.01                                                                                                                       Model RWS ρ=0.30
                                                                                                  Empirical RWS ρ=0.20                                                                                                                   Empirical RWS ρ=0.40
                                        0.6                                                                                                                                     0.6
                                                                                                  Model RWS ρ=0.20                                                                                                                       Model RWS ρ=0.40
                                        0.5                                                                                                                                     0.5

                                        0.4                                                                                                                                     0.4

                                        0.3                                                                                                                                     0.3

                                        0.2                                                                                                                                     0.2

                                        0.1                                                                                                                                     0.1

                                         0                                                                                                                                       0
                                          0          2000      4000       6000       8000      10000    12000      14000       16000                                              0        0.5        1          1.5          2        2.5         3          3.5            4
                                                                         Activation Time of the Niche                                                                                                           Activation Time of the Niche                              4
                                                                                                                                                                                                                                                                      x 10


                                                                                 (a)                                                                                                                                    (b)


Figure 7: Takeover time for roulette wheel selection when (a) ρ = {0.01, 0.20} and (b) ρ ∈
{0.30, 0.40} in the 16-niche problem.


                                                      Takeover time in TS s=9 for 16 Niches with Overlapping Classifiers                                                                  Takeover time in TS s={2,3} for 16 Niches with Overlapping Classifiers
                                         1                                                                                                                                       1

                                        0.9                                                                                                                                     0.9

                                        0.8                                                                                                                                     0.8
                                                                                                                                                                                                                                                       Empirical TS s=2
    Proportion of the Best Classifier


                                                                                                                                            Proportion of the Best Classifier


                                                                                                                                                                                                                                                       Model TS s=2
                                                                                                            Empirical TS s=9
                                        0.7                                                                                                                                     0.7
                                                                                                                                                                                                                                                       Empirical TS s=3
                                                                                                            Model TS s=9
                                                                                                                                                                                                                                                       Model TS s=3
                                        0.6                                                                                                                                     0.6

                                        0.5                                                                                                                                     0.5

                                        0.4                                                                                                                                     0.4

                                        0.3                                                                                                                                     0.3

                                        0.2                                                                                                                                     0.2

                                        0.1                                                                                                                                     0.1

                                         0                                                                                                                                       0
                                          0          2000      4000       6000       8000      10000    12000      14000       16000                                              0      0.5      1       1.5        2       2.5      3      3.5         4      4.5          5
                                                                         Activation Time of the Niche                                                                                                           Activation Time of the Niche                              4
                                                                                                                                                                                                                                                                      x 10


                                                                                 (a)                                                                                                                                    (b)


                                               Figure 8: Takeover time for tournament selection when (a) s=9 and (b) s={2,3}


                                                                                                                                       17

Contenu connexe

Tendances

Stability of Individuals in a Fingerprint System across Force Levels
Stability of Individuals in a Fingerprint System across Force LevelsStability of Individuals in a Fingerprint System across Force Levels
Stability of Individuals in a Fingerprint System across Force LevelsITIIIndustries
 
Simulation Study of Hurdle Model Performance on Zero Inflated Count Data
Simulation Study of Hurdle Model Performance on Zero Inflated Count DataSimulation Study of Hurdle Model Performance on Zero Inflated Count Data
Simulation Study of Hurdle Model Performance on Zero Inflated Count DataIan Camacho
 
Investigations of certain estimators for modeling panel data under violations...
Investigations of certain estimators for modeling panel data under violations...Investigations of certain estimators for modeling panel data under violations...
Investigations of certain estimators for modeling panel data under violations...Alexander Decker
 
The Influence of Age Assignments on the Performance of Immune Algorithms
The Influence of Age Assignments on the Performance of Immune AlgorithmsThe Influence of Age Assignments on the Performance of Immune Algorithms
The Influence of Age Assignments on the Performance of Immune AlgorithmsMario Pavone
 
Gamma and inverse Gaussian frailty models: A comparative study
Gamma and inverse Gaussian frailty models: A comparative studyGamma and inverse Gaussian frailty models: A comparative study
Gamma and inverse Gaussian frailty models: A comparative studyinventionjournals
 
F043046054
F043046054F043046054
F043046054inventy
 
A Mathematical Model for the Genetic Variation of Prolactin and Prolactin Rec...
A Mathematical Model for the Genetic Variation of Prolactin and Prolactin Rec...A Mathematical Model for the Genetic Variation of Prolactin and Prolactin Rec...
A Mathematical Model for the Genetic Variation of Prolactin and Prolactin Rec...IJERA Editor
 
Arabidopsis thaliana Inspired Genetic Restoration Strategies
Arabidopsis thaliana Inspired Genetic Restoration StrategiesArabidopsis thaliana Inspired Genetic Restoration Strategies
Arabidopsis thaliana Inspired Genetic Restoration StrategiesCSCJournals
 
Information Systems Continuance
Information Systems ContinuanceInformation Systems Continuance
Information Systems ContinuanceMichael Ling
 

Tendances (11)

Stability of Individuals in a Fingerprint System across Force Levels
Stability of Individuals in a Fingerprint System across Force LevelsStability of Individuals in a Fingerprint System across Force Levels
Stability of Individuals in a Fingerprint System across Force Levels
 
Simulation Study of Hurdle Model Performance on Zero Inflated Count Data
Simulation Study of Hurdle Model Performance on Zero Inflated Count DataSimulation Study of Hurdle Model Performance on Zero Inflated Count Data
Simulation Study of Hurdle Model Performance on Zero Inflated Count Data
 
Investigations of certain estimators for modeling panel data under violations...
Investigations of certain estimators for modeling panel data under violations...Investigations of certain estimators for modeling panel data under violations...
Investigations of certain estimators for modeling panel data under violations...
 
The Influence of Age Assignments on the Performance of Immune Algorithms
The Influence of Age Assignments on the Performance of Immune AlgorithmsThe Influence of Age Assignments on the Performance of Immune Algorithms
The Influence of Age Assignments on the Performance of Immune Algorithms
 
C4.5
C4.5C4.5
C4.5
 
Gamma and inverse Gaussian frailty models: A comparative study
Gamma and inverse Gaussian frailty models: A comparative studyGamma and inverse Gaussian frailty models: A comparative study
Gamma and inverse Gaussian frailty models: A comparative study
 
F043046054
F043046054F043046054
F043046054
 
A Mathematical Model for the Genetic Variation of Prolactin and Prolactin Rec...
A Mathematical Model for the Genetic Variation of Prolactin and Prolactin Rec...A Mathematical Model for the Genetic Variation of Prolactin and Prolactin Rec...
A Mathematical Model for the Genetic Variation of Prolactin and Prolactin Rec...
 
Eu33884888
Eu33884888Eu33884888
Eu33884888
 
Arabidopsis thaliana Inspired Genetic Restoration Strategies
Arabidopsis thaliana Inspired Genetic Restoration StrategiesArabidopsis thaliana Inspired Genetic Restoration Strategies
Arabidopsis thaliana Inspired Genetic Restoration Strategies
 
Information Systems Continuance
Information Systems ContinuanceInformation Systems Continuance
Information Systems Continuance
 

En vedette

Envelhecimento, saúde e qualidade de vida blumenau
Envelhecimento, saúde e qualidade de vida blumenauEnvelhecimento, saúde e qualidade de vida blumenau
Envelhecimento, saúde e qualidade de vida blumenauAlícia Souza
 
Pp2010 14 pendidikan kedinasan
Pp2010 14 pendidikan kedinasanPp2010 14 pendidikan kedinasan
Pp2010 14 pendidikan kedinasanNandang Sukmara
 
Gögn, gagnsemi og gegnsæi
Gögn, gagnsemi og gegnsæiGögn, gagnsemi og gegnsæi
Gögn, gagnsemi og gegnsæiHjalmar Gislason
 
Mahmoud Hussein_Experience Letter_AADC
Mahmoud Hussein_Experience Letter_AADCMahmoud Hussein_Experience Letter_AADC
Mahmoud Hussein_Experience Letter_AADCMahmoud Hussein
 
JNAutomotive_2009 AAA Aggressive Driving Research Update
JNAutomotive_2009 AAA Aggressive Driving Research UpdateJNAutomotive_2009 AAA Aggressive Driving Research Update
JNAutomotive_2009 AAA Aggressive Driving Research UpdateJN Automotive
 
The Impact of IoT on Data Centers
The Impact of IoT on Data CentersThe Impact of IoT on Data Centers
The Impact of IoT on Data Centerssflaig
 
институт интеллект.развития школьников
институт интеллект.развития школьниковинститут интеллект.развития школьников
институт интеллект.развития школьниковIrina Zabotina
 
Farmersrecruitingpacketportrait 13292480268889-phpapp02-120214133434-phpapp02
Farmersrecruitingpacketportrait 13292480268889-phpapp02-120214133434-phpapp02Farmersrecruitingpacketportrait 13292480268889-phpapp02-120214133434-phpapp02
Farmersrecruitingpacketportrait 13292480268889-phpapp02-120214133434-phpapp02Haiden Fertig
 
letter recommendation bergonie
letter recommendation bergonieletter recommendation bergonie
letter recommendation bergonieBrian Collins
 

En vedette (18)

152 pela cruz ao céu irei
152   pela cruz ao céu irei152   pela cruz ao céu irei
152 pela cruz ao céu irei
 
Envelhecimento, saúde e qualidade de vida blumenau
Envelhecimento, saúde e qualidade de vida blumenauEnvelhecimento, saúde e qualidade de vida blumenau
Envelhecimento, saúde e qualidade de vida blumenau
 
Earthquakes by leroy z
Earthquakes by leroy zEarthquakes by leroy z
Earthquakes by leroy z
 
Bienvenida Ppff
Bienvenida PpffBienvenida Ppff
Bienvenida Ppff
 
Pp2010 14 pendidikan kedinasan
Pp2010 14 pendidikan kedinasanPp2010 14 pendidikan kedinasan
Pp2010 14 pendidikan kedinasan
 
Perdiu roja
Perdiu rojaPerdiu roja
Perdiu roja
 
gradution
gradutiongradution
gradution
 
Gögn, gagnsemi og gegnsæi
Gögn, gagnsemi og gegnsæiGögn, gagnsemi og gegnsæi
Gögn, gagnsemi og gegnsæi
 
Mahmoud Hussein_Experience Letter_AADC
Mahmoud Hussein_Experience Letter_AADCMahmoud Hussein_Experience Letter_AADC
Mahmoud Hussein_Experience Letter_AADC
 
2014 Rogers EoY
2014 Rogers EoY2014 Rogers EoY
2014 Rogers EoY
 
New Agent Marketing-2
New Agent Marketing-2New Agent Marketing-2
New Agent Marketing-2
 
JNAutomotive_2009 AAA Aggressive Driving Research Update
JNAutomotive_2009 AAA Aggressive Driving Research UpdateJNAutomotive_2009 AAA Aggressive Driving Research Update
JNAutomotive_2009 AAA Aggressive Driving Research Update
 
The Impact of IoT on Data Centers
The Impact of IoT on Data CentersThe Impact of IoT on Data Centers
The Impact of IoT on Data Centers
 
1w09 apprecial
1w09 apprecial1w09 apprecial
1w09 apprecial
 
NOELS GM AWARD
NOELS GM AWARDNOELS GM AWARD
NOELS GM AWARD
 
институт интеллект.развития школьников
институт интеллект.развития школьниковинститут интеллект.развития школьников
институт интеллект.развития школьников
 
Farmersrecruitingpacketportrait 13292480268889-phpapp02-120214133434-phpapp02
Farmersrecruitingpacketportrait 13292480268889-phpapp02-120214133434-phpapp02Farmersrecruitingpacketportrait 13292480268889-phpapp02-120214133434-phpapp02
Farmersrecruitingpacketportrait 13292480268889-phpapp02-120214133434-phpapp02
 
letter recommendation bergonie
letter recommendation bergonieletter recommendation bergonie
letter recommendation bergonie
 

Similaire à Modeling selection pressure in XCS for proportionate and tournament selection

Topic_6
Topic_6Topic_6
Topic_6butest
 
G. Barcaroli, The use of machine learning in official statistics
G. Barcaroli, The use of machine learning in official statisticsG. Barcaroli, The use of machine learning in official statistics
G. Barcaroli, The use of machine learning in official statisticsIstituto nazionale di statistica
 
Cost Optimized Design Technique for Pseudo-Random Numbers in Cellular Automata
Cost Optimized Design Technique for Pseudo-Random Numbers in Cellular AutomataCost Optimized Design Technique for Pseudo-Random Numbers in Cellular Automata
Cost Optimized Design Technique for Pseudo-Random Numbers in Cellular Automataijait
 
published in the journal
published in the journalpublished in the journal
published in the journalrikaseorika
 
USING CUCKOO ALGORITHM FOR ESTIMATING TWO GLSD PARAMETERS AND COMPARING IT WI...
USING CUCKOO ALGORITHM FOR ESTIMATING TWO GLSD PARAMETERS AND COMPARING IT WI...USING CUCKOO ALGORITHM FOR ESTIMATING TWO GLSD PARAMETERS AND COMPARING IT WI...
USING CUCKOO ALGORITHM FOR ESTIMATING TWO GLSD PARAMETERS AND COMPARING IT WI...AIRCC Publishing Corporation
 
Using Cuckoo Algorithm for Estimating Two GLSD Parameters and Comparing it wi...
Using Cuckoo Algorithm for Estimating Two GLSD Parameters and Comparing it wi...Using Cuckoo Algorithm for Estimating Two GLSD Parameters and Comparing it wi...
Using Cuckoo Algorithm for Estimating Two GLSD Parameters and Comparing it wi...AIRCC Publishing Corporation
 
USING CUCKOO ALGORITHM FOR ESTIMATING TWO GLSD PARAMETERS AND COMPARING IT WI...
USING CUCKOO ALGORITHM FOR ESTIMATING TWO GLSD PARAMETERS AND COMPARING IT WI...USING CUCKOO ALGORITHM FOR ESTIMATING TWO GLSD PARAMETERS AND COMPARING IT WI...
USING CUCKOO ALGORITHM FOR ESTIMATING TWO GLSD PARAMETERS AND COMPARING IT WI...ijcsit
 
A Comparative Analysis of Feature Selection Methods for Clustering DNA Sequences
A Comparative Analysis of Feature Selection Methods for Clustering DNA SequencesA Comparative Analysis of Feature Selection Methods for Clustering DNA Sequences
A Comparative Analysis of Feature Selection Methods for Clustering DNA SequencesCSCJournals
 
Analysis On Classification Techniques In Mammographic Mass Data Set
Analysis On Classification Techniques In Mammographic Mass Data SetAnalysis On Classification Techniques In Mammographic Mass Data Set
Analysis On Classification Techniques In Mammographic Mass Data SetIJERA Editor
 
An Automatic Clustering Technique for Optimal Clusters
An Automatic Clustering Technique for Optimal ClustersAn Automatic Clustering Technique for Optimal Clusters
An Automatic Clustering Technique for Optimal ClustersIJCSEA Journal
 
IEEE Fuzzy system Title and Abstract 2016
IEEE Fuzzy system Title and Abstract 2016 IEEE Fuzzy system Title and Abstract 2016
IEEE Fuzzy system Title and Abstract 2016 tsysglobalsolutions
 
An Improved Iterative Method for Solving General System of Equations via Gene...
An Improved Iterative Method for Solving General System of Equations via Gene...An Improved Iterative Method for Solving General System of Equations via Gene...
An Improved Iterative Method for Solving General System of Equations via Gene...Zac Darcy
 
Kinetic bands versus Bollinger Bands
Kinetic bands versus Bollinger  BandsKinetic bands versus Bollinger  Bands
Kinetic bands versus Bollinger BandsAlexandru Daia
 
A Mathematical Programming Approach for Selection of Variables in Cluster Ana...
A Mathematical Programming Approach for Selection of Variables in Cluster Ana...A Mathematical Programming Approach for Selection of Variables in Cluster Ana...
A Mathematical Programming Approach for Selection of Variables in Cluster Ana...IJRES Journal
 
MediaEval 2015 - UNED-UV @ Retrieving Diverse Social Images Task - Poster
MediaEval 2015 - UNED-UV @ Retrieving Diverse Social Images Task - PosterMediaEval 2015 - UNED-UV @ Retrieving Diverse Social Images Task - Poster
MediaEval 2015 - UNED-UV @ Retrieving Diverse Social Images Task - Postermultimediaeval
 

Similaire à Modeling selection pressure in XCS for proportionate and tournament selection (20)

Topic_6
Topic_6Topic_6
Topic_6
 
G. Barcaroli, The use of machine learning in official statistics
G. Barcaroli, The use of machine learning in official statisticsG. Barcaroli, The use of machine learning in official statistics
G. Barcaroli, The use of machine learning in official statistics
 
Cost Optimized Design Technique for Pseudo-Random Numbers in Cellular Automata
Cost Optimized Design Technique for Pseudo-Random Numbers in Cellular AutomataCost Optimized Design Technique for Pseudo-Random Numbers in Cellular Automata
Cost Optimized Design Technique for Pseudo-Random Numbers in Cellular Automata
 
journal paper
journal paperjournal paper
journal paper
 
published in the journal
published in the journalpublished in the journal
published in the journal
 
USING CUCKOO ALGORITHM FOR ESTIMATING TWO GLSD PARAMETERS AND COMPARING IT WI...
USING CUCKOO ALGORITHM FOR ESTIMATING TWO GLSD PARAMETERS AND COMPARING IT WI...USING CUCKOO ALGORITHM FOR ESTIMATING TWO GLSD PARAMETERS AND COMPARING IT WI...
USING CUCKOO ALGORITHM FOR ESTIMATING TWO GLSD PARAMETERS AND COMPARING IT WI...
 
Using Cuckoo Algorithm for Estimating Two GLSD Parameters and Comparing it wi...
Using Cuckoo Algorithm for Estimating Two GLSD Parameters and Comparing it wi...Using Cuckoo Algorithm for Estimating Two GLSD Parameters and Comparing it wi...
Using Cuckoo Algorithm for Estimating Two GLSD Parameters and Comparing it wi...
 
USING CUCKOO ALGORITHM FOR ESTIMATING TWO GLSD PARAMETERS AND COMPARING IT WI...
USING CUCKOO ALGORITHM FOR ESTIMATING TWO GLSD PARAMETERS AND COMPARING IT WI...USING CUCKOO ALGORITHM FOR ESTIMATING TWO GLSD PARAMETERS AND COMPARING IT WI...
USING CUCKOO ALGORITHM FOR ESTIMATING TWO GLSD PARAMETERS AND COMPARING IT WI...
 
A Comparative Analysis of Feature Selection Methods for Clustering DNA Sequences
A Comparative Analysis of Feature Selection Methods for Clustering DNA SequencesA Comparative Analysis of Feature Selection Methods for Clustering DNA Sequences
A Comparative Analysis of Feature Selection Methods for Clustering DNA Sequences
 
Analysis On Classification Techniques In Mammographic Mass Data Set
Analysis On Classification Techniques In Mammographic Mass Data SetAnalysis On Classification Techniques In Mammographic Mass Data Set
Analysis On Classification Techniques In Mammographic Mass Data Set
 
An Automatic Clustering Technique for Optimal Clusters
An Automatic Clustering Technique for Optimal ClustersAn Automatic Clustering Technique for Optimal Clusters
An Automatic Clustering Technique for Optimal Clusters
 
IEEE Fuzzy system Title and Abstract 2016
IEEE Fuzzy system Title and Abstract 2016 IEEE Fuzzy system Title and Abstract 2016
IEEE Fuzzy system Title and Abstract 2016
 
An Improved Iterative Method for Solving General System of Equations via Gene...
An Improved Iterative Method for Solving General System of Equations via Gene...An Improved Iterative Method for Solving General System of Equations via Gene...
An Improved Iterative Method for Solving General System of Equations via Gene...
 
An Improved Iterative Method for Solving General System of Equations via Gene...
An Improved Iterative Method for Solving General System of Equations via Gene...An Improved Iterative Method for Solving General System of Equations via Gene...
An Improved Iterative Method for Solving General System of Equations via Gene...
 
Extensive Survey on Datamining Algoritms for Pattern Extraction
Extensive Survey on Datamining Algoritms for Pattern ExtractionExtensive Survey on Datamining Algoritms for Pattern Extraction
Extensive Survey on Datamining Algoritms for Pattern Extraction
 
SecondaryStructurePredictionReport
SecondaryStructurePredictionReportSecondaryStructurePredictionReport
SecondaryStructurePredictionReport
 
Kinetic bands versus Bollinger Bands
Kinetic bands versus Bollinger  BandsKinetic bands versus Bollinger  Bands
Kinetic bands versus Bollinger Bands
 
Besier (2003)
Besier (2003)Besier (2003)
Besier (2003)
 
A Mathematical Programming Approach for Selection of Variables in Cluster Ana...
A Mathematical Programming Approach for Selection of Variables in Cluster Ana...A Mathematical Programming Approach for Selection of Variables in Cluster Ana...
A Mathematical Programming Approach for Selection of Variables in Cluster Ana...
 
MediaEval 2015 - UNED-UV @ Retrieving Diverse Social Images Task - Poster
MediaEval 2015 - UNED-UV @ Retrieving Diverse Social Images Task - PosterMediaEval 2015 - UNED-UV @ Retrieving Diverse Social Images Task - Poster
MediaEval 2015 - UNED-UV @ Retrieving Diverse Social Images Task - Poster
 

Plus de kknsastry

Genetic Algorithms and Genetic Programming for Multiscale Modeling
Genetic Algorithms and Genetic Programming for Multiscale ModelingGenetic Algorithms and Genetic Programming for Multiscale Modeling
Genetic Algorithms and Genetic Programming for Multiscale Modelingkknsastry
 
Towards billion bit optimization via parallel estimation of distribution algo...
Towards billion bit optimization via parallel estimation of distribution algo...Towards billion bit optimization via parallel estimation of distribution algo...
Towards billion bit optimization via parallel estimation of distribution algo...kknsastry
 
Empirical Analysis of ideal recombination on random decomposable problems
Empirical Analysis of ideal recombination on random decomposable problemsEmpirical Analysis of ideal recombination on random decomposable problems
Empirical Analysis of ideal recombination on random decomposable problemskknsastry
 
Population sizing for entropy-based model buliding In genetic algorithms
Population sizing for entropy-based model buliding In genetic algorithms Population sizing for entropy-based model buliding In genetic algorithms
Population sizing for entropy-based model buliding In genetic algorithms kknsastry
 
Let's get ready to rumble redux: Crossover versus mutation head to head on ex...
Let's get ready to rumble redux: Crossover versus mutation head to head on ex...Let's get ready to rumble redux: Crossover versus mutation head to head on ex...
Let's get ready to rumble redux: Crossover versus mutation head to head on ex...kknsastry
 
Modeling selection pressure in XCS for proportionate and tournament selection
Modeling selection pressure in XCS for proportionate and tournament selectionModeling selection pressure in XCS for proportionate and tournament selection
Modeling selection pressure in XCS for proportionate and tournament selectionkknsastry
 
Modeling XCS in class imbalances: Population sizing and parameter settings
Modeling XCS in class imbalances: Population sizing and parameter settingsModeling XCS in class imbalances: Population sizing and parameter settings
Modeling XCS in class imbalances: Population sizing and parameter settingskknsastry
 
Substructrual surrogates for learning decomposable classification problems: i...
Substructrual surrogates for learning decomposable classification problems: i...Substructrual surrogates for learning decomposable classification problems: i...
Substructrual surrogates for learning decomposable classification problems: i...kknsastry
 
Fast and accurate reaction dynamics via multiobjective genetic algorithm opti...
Fast and accurate reaction dynamics via multiobjective genetic algorithm opti...Fast and accurate reaction dynamics via multiobjective genetic algorithm opti...
Fast and accurate reaction dynamics via multiobjective genetic algorithm opti...kknsastry
 
On Extended Compact Genetic Algorithm
On Extended Compact Genetic AlgorithmOn Extended Compact Genetic Algorithm
On Extended Compact Genetic Algorithmkknsastry
 
Silicon Cluster Optimization Using Extended Compact Genetic Algorithm
Silicon Cluster Optimization Using Extended Compact Genetic AlgorithmSilicon Cluster Optimization Using Extended Compact Genetic Algorithm
Silicon Cluster Optimization Using Extended Compact Genetic Algorithmkknsastry
 
A Practical Schema Theorem for Genetic Algorithm Design and Tuning
A Practical Schema Theorem for Genetic Algorithm Design and TuningA Practical Schema Theorem for Genetic Algorithm Design and Tuning
A Practical Schema Theorem for Genetic Algorithm Design and Tuningkknsastry
 
On the Supply of Building Blocks
On the Supply of Building BlocksOn the Supply of Building Blocks
On the Supply of Building Blockskknsastry
 
Don't Evaluate, Inherit
Don't Evaluate, InheritDon't Evaluate, Inherit
Don't Evaluate, Inheritkknsastry
 
Efficient Cluster Optimization Using A Hybrid Extended Compact Genetic Algori...
Efficient Cluster Optimization Using A Hybrid Extended Compact Genetic Algori...Efficient Cluster Optimization Using A Hybrid Extended Compact Genetic Algori...
Efficient Cluster Optimization Using A Hybrid Extended Compact Genetic Algori...kknsastry
 
Modeling Tournament Selection with Replacement Using Apparent Added Noise
Modeling Tournament Selection with Replacement Using Apparent Added NoiseModeling Tournament Selection with Replacement Using Apparent Added Noise
Modeling Tournament Selection with Replacement Using Apparent Added Noisekknsastry
 
Evaluation Relaxation as an Efficiency-Enhancement Technique: Handling Varian...
Evaluation Relaxation as an Efficiency-Enhancement Technique: Handling Varian...Evaluation Relaxation as an Efficiency-Enhancement Technique: Handling Varian...
Evaluation Relaxation as an Efficiency-Enhancement Technique: Handling Varian...kknsastry
 
Analysis of Mixing in Genetic Algorithms: A Survey
Analysis of Mixing in Genetic Algorithms: A SurveyAnalysis of Mixing in Genetic Algorithms: A Survey
Analysis of Mixing in Genetic Algorithms: A Surveykknsastry
 
How Well Does A Single-Point Crossover Mix Building Blocks with Tight Linkage?
How Well Does A Single-Point Crossover Mix Building Blocks with Tight Linkage?How Well Does A Single-Point Crossover Mix Building Blocks with Tight Linkage?
How Well Does A Single-Point Crossover Mix Building Blocks with Tight Linkage?kknsastry
 
Scalability of Selectorecombinative Genetic Algorithms for Problems with Tigh...
Scalability of Selectorecombinative Genetic Algorithms for Problems with Tigh...Scalability of Selectorecombinative Genetic Algorithms for Problems with Tigh...
Scalability of Selectorecombinative Genetic Algorithms for Problems with Tigh...kknsastry
 

Plus de kknsastry (20)

Genetic Algorithms and Genetic Programming for Multiscale Modeling
Genetic Algorithms and Genetic Programming for Multiscale ModelingGenetic Algorithms and Genetic Programming for Multiscale Modeling
Genetic Algorithms and Genetic Programming for Multiscale Modeling
 
Towards billion bit optimization via parallel estimation of distribution algo...
Towards billion bit optimization via parallel estimation of distribution algo...Towards billion bit optimization via parallel estimation of distribution algo...
Towards billion bit optimization via parallel estimation of distribution algo...
 
Empirical Analysis of ideal recombination on random decomposable problems
Empirical Analysis of ideal recombination on random decomposable problemsEmpirical Analysis of ideal recombination on random decomposable problems
Empirical Analysis of ideal recombination on random decomposable problems
 
Population sizing for entropy-based model buliding In genetic algorithms
Population sizing for entropy-based model buliding In genetic algorithms Population sizing for entropy-based model buliding In genetic algorithms
Population sizing for entropy-based model buliding In genetic algorithms
 
Let's get ready to rumble redux: Crossover versus mutation head to head on ex...
Let's get ready to rumble redux: Crossover versus mutation head to head on ex...Let's get ready to rumble redux: Crossover versus mutation head to head on ex...
Let's get ready to rumble redux: Crossover versus mutation head to head on ex...
 
Modeling selection pressure in XCS for proportionate and tournament selection
Modeling selection pressure in XCS for proportionate and tournament selectionModeling selection pressure in XCS for proportionate and tournament selection
Modeling selection pressure in XCS for proportionate and tournament selection
 
Modeling XCS in class imbalances: Population sizing and parameter settings
Modeling XCS in class imbalances: Population sizing and parameter settingsModeling XCS in class imbalances: Population sizing and parameter settings
Modeling XCS in class imbalances: Population sizing and parameter settings
 
Substructrual surrogates for learning decomposable classification problems: i...
Substructrual surrogates for learning decomposable classification problems: i...Substructrual surrogates for learning decomposable classification problems: i...
Substructrual surrogates for learning decomposable classification problems: i...
 
Fast and accurate reaction dynamics via multiobjective genetic algorithm opti...
Fast and accurate reaction dynamics via multiobjective genetic algorithm opti...Fast and accurate reaction dynamics via multiobjective genetic algorithm opti...
Fast and accurate reaction dynamics via multiobjective genetic algorithm opti...
 
On Extended Compact Genetic Algorithm
On Extended Compact Genetic AlgorithmOn Extended Compact Genetic Algorithm
On Extended Compact Genetic Algorithm
 
Silicon Cluster Optimization Using Extended Compact Genetic Algorithm
Silicon Cluster Optimization Using Extended Compact Genetic AlgorithmSilicon Cluster Optimization Using Extended Compact Genetic Algorithm
Silicon Cluster Optimization Using Extended Compact Genetic Algorithm
 
A Practical Schema Theorem for Genetic Algorithm Design and Tuning
A Practical Schema Theorem for Genetic Algorithm Design and TuningA Practical Schema Theorem for Genetic Algorithm Design and Tuning
A Practical Schema Theorem for Genetic Algorithm Design and Tuning
 
On the Supply of Building Blocks
On the Supply of Building BlocksOn the Supply of Building Blocks
On the Supply of Building Blocks
 
Don't Evaluate, Inherit
Don't Evaluate, InheritDon't Evaluate, Inherit
Don't Evaluate, Inherit
 
Efficient Cluster Optimization Using A Hybrid Extended Compact Genetic Algori...
Efficient Cluster Optimization Using A Hybrid Extended Compact Genetic Algori...Efficient Cluster Optimization Using A Hybrid Extended Compact Genetic Algori...
Efficient Cluster Optimization Using A Hybrid Extended Compact Genetic Algori...
 
Modeling Tournament Selection with Replacement Using Apparent Added Noise
Modeling Tournament Selection with Replacement Using Apparent Added NoiseModeling Tournament Selection with Replacement Using Apparent Added Noise
Modeling Tournament Selection with Replacement Using Apparent Added Noise
 
Evaluation Relaxation as an Efficiency-Enhancement Technique: Handling Varian...
Evaluation Relaxation as an Efficiency-Enhancement Technique: Handling Varian...Evaluation Relaxation as an Efficiency-Enhancement Technique: Handling Varian...
Evaluation Relaxation as an Efficiency-Enhancement Technique: Handling Varian...
 
Analysis of Mixing in Genetic Algorithms: A Survey
Analysis of Mixing in Genetic Algorithms: A SurveyAnalysis of Mixing in Genetic Algorithms: A Survey
Analysis of Mixing in Genetic Algorithms: A Survey
 
How Well Does A Single-Point Crossover Mix Building Blocks with Tight Linkage?
How Well Does A Single-Point Crossover Mix Building Blocks with Tight Linkage?How Well Does A Single-Point Crossover Mix Building Blocks with Tight Linkage?
How Well Does A Single-Point Crossover Mix Building Blocks with Tight Linkage?
 
Scalability of Selectorecombinative Genetic Algorithms for Problems with Tigh...
Scalability of Selectorecombinative Genetic Algorithms for Problems with Tigh...Scalability of Selectorecombinative Genetic Algorithms for Problems with Tigh...
Scalability of Selectorecombinative Genetic Algorithms for Problems with Tigh...
 

Dernier

Hyperautomation and AI/ML: A Strategy for Digital Transformation Success.pdf
Hyperautomation and AI/ML: A Strategy for Digital Transformation Success.pdfHyperautomation and AI/ML: A Strategy for Digital Transformation Success.pdf
Hyperautomation and AI/ML: A Strategy for Digital Transformation Success.pdfPrecisely
 
"Debugging python applications inside k8s environment", Andrii Soldatenko
"Debugging python applications inside k8s environment", Andrii Soldatenko"Debugging python applications inside k8s environment", Andrii Soldatenko
"Debugging python applications inside k8s environment", Andrii SoldatenkoFwdays
 
Transcript: New from BookNet Canada for 2024: BNC CataList - Tech Forum 2024
Transcript: New from BookNet Canada for 2024: BNC CataList - Tech Forum 2024Transcript: New from BookNet Canada for 2024: BNC CataList - Tech Forum 2024
Transcript: New from BookNet Canada for 2024: BNC CataList - Tech Forum 2024BookNet Canada
 
DSPy a system for AI to Write Prompts and Do Fine Tuning
DSPy a system for AI to Write Prompts and Do Fine TuningDSPy a system for AI to Write Prompts and Do Fine Tuning
DSPy a system for AI to Write Prompts and Do Fine TuningLars Bell
 
DevoxxFR 2024 Reproducible Builds with Apache Maven
DevoxxFR 2024 Reproducible Builds with Apache MavenDevoxxFR 2024 Reproducible Builds with Apache Maven
DevoxxFR 2024 Reproducible Builds with Apache MavenHervé Boutemy
 
Vertex AI Gemini Prompt Engineering Tips
Vertex AI Gemini Prompt Engineering TipsVertex AI Gemini Prompt Engineering Tips
Vertex AI Gemini Prompt Engineering TipsMiki Katsuragi
 
Artificial intelligence in cctv survelliance.pptx
Artificial intelligence in cctv survelliance.pptxArtificial intelligence in cctv survelliance.pptx
Artificial intelligence in cctv survelliance.pptxhariprasad279825
 
What's New in Teams Calling, Meetings and Devices March 2024
What's New in Teams Calling, Meetings and Devices March 2024What's New in Teams Calling, Meetings and Devices March 2024
What's New in Teams Calling, Meetings and Devices March 2024Stephanie Beckett
 
Merck Moving Beyond Passwords: FIDO Paris Seminar.pptx
Merck Moving Beyond Passwords: FIDO Paris Seminar.pptxMerck Moving Beyond Passwords: FIDO Paris Seminar.pptx
Merck Moving Beyond Passwords: FIDO Paris Seminar.pptxLoriGlavin3
 
Nell’iperspazio con Rocket: il Framework Web di Rust!
Nell’iperspazio con Rocket: il Framework Web di Rust!Nell’iperspazio con Rocket: il Framework Web di Rust!
Nell’iperspazio con Rocket: il Framework Web di Rust!Commit University
 
Developer Data Modeling Mistakes: From Postgres to NoSQL
Developer Data Modeling Mistakes: From Postgres to NoSQLDeveloper Data Modeling Mistakes: From Postgres to NoSQL
Developer Data Modeling Mistakes: From Postgres to NoSQLScyllaDB
 
Commit 2024 - Secret Management made easy
Commit 2024 - Secret Management made easyCommit 2024 - Secret Management made easy
Commit 2024 - Secret Management made easyAlfredo García Lavilla
 
The Ultimate Guide to Choosing WordPress Pros and Cons
The Ultimate Guide to Choosing WordPress Pros and ConsThe Ultimate Guide to Choosing WordPress Pros and Cons
The Ultimate Guide to Choosing WordPress Pros and ConsPixlogix Infotech
 
How to write a Business Continuity Plan
How to write a Business Continuity PlanHow to write a Business Continuity Plan
How to write a Business Continuity PlanDatabarracks
 
Scanning the Internet for External Cloud Exposures via SSL Certs
Scanning the Internet for External Cloud Exposures via SSL CertsScanning the Internet for External Cloud Exposures via SSL Certs
Scanning the Internet for External Cloud Exposures via SSL CertsRizwan Syed
 
TrustArc Webinar - How to Build Consumer Trust Through Data Privacy
TrustArc Webinar - How to Build Consumer Trust Through Data PrivacyTrustArc Webinar - How to Build Consumer Trust Through Data Privacy
TrustArc Webinar - How to Build Consumer Trust Through Data PrivacyTrustArc
 
Tampa BSides - Chef's Tour of Microsoft Security Adoption Framework (SAF)
Tampa BSides - Chef's Tour of Microsoft Security Adoption Framework (SAF)Tampa BSides - Chef's Tour of Microsoft Security Adoption Framework (SAF)
Tampa BSides - Chef's Tour of Microsoft Security Adoption Framework (SAF)Mark Simos
 
Dev Dives: Streamline document processing with UiPath Studio Web
Dev Dives: Streamline document processing with UiPath Studio WebDev Dives: Streamline document processing with UiPath Studio Web
Dev Dives: Streamline document processing with UiPath Studio WebUiPathCommunity
 

Dernier (20)

DMCC Future of Trade Web3 - Special Edition
DMCC Future of Trade Web3 - Special EditionDMCC Future of Trade Web3 - Special Edition
DMCC Future of Trade Web3 - Special Edition
 
Hyperautomation and AI/ML: A Strategy for Digital Transformation Success.pdf
Hyperautomation and AI/ML: A Strategy for Digital Transformation Success.pdfHyperautomation and AI/ML: A Strategy for Digital Transformation Success.pdf
Hyperautomation and AI/ML: A Strategy for Digital Transformation Success.pdf
 
"Debugging python applications inside k8s environment", Andrii Soldatenko
"Debugging python applications inside k8s environment", Andrii Soldatenko"Debugging python applications inside k8s environment", Andrii Soldatenko
"Debugging python applications inside k8s environment", Andrii Soldatenko
 
Transcript: New from BookNet Canada for 2024: BNC CataList - Tech Forum 2024
Transcript: New from BookNet Canada for 2024: BNC CataList - Tech Forum 2024Transcript: New from BookNet Canada for 2024: BNC CataList - Tech Forum 2024
Transcript: New from BookNet Canada for 2024: BNC CataList - Tech Forum 2024
 
DSPy a system for AI to Write Prompts and Do Fine Tuning
DSPy a system for AI to Write Prompts and Do Fine TuningDSPy a system for AI to Write Prompts and Do Fine Tuning
DSPy a system for AI to Write Prompts and Do Fine Tuning
 
DevoxxFR 2024 Reproducible Builds with Apache Maven
DevoxxFR 2024 Reproducible Builds with Apache MavenDevoxxFR 2024 Reproducible Builds with Apache Maven
DevoxxFR 2024 Reproducible Builds with Apache Maven
 
Vertex AI Gemini Prompt Engineering Tips
Vertex AI Gemini Prompt Engineering TipsVertex AI Gemini Prompt Engineering Tips
Vertex AI Gemini Prompt Engineering Tips
 
Artificial intelligence in cctv survelliance.pptx
Artificial intelligence in cctv survelliance.pptxArtificial intelligence in cctv survelliance.pptx
Artificial intelligence in cctv survelliance.pptx
 
What's New in Teams Calling, Meetings and Devices March 2024
What's New in Teams Calling, Meetings and Devices March 2024What's New in Teams Calling, Meetings and Devices March 2024
What's New in Teams Calling, Meetings and Devices March 2024
 
Merck Moving Beyond Passwords: FIDO Paris Seminar.pptx
Merck Moving Beyond Passwords: FIDO Paris Seminar.pptxMerck Moving Beyond Passwords: FIDO Paris Seminar.pptx
Merck Moving Beyond Passwords: FIDO Paris Seminar.pptx
 
Nell’iperspazio con Rocket: il Framework Web di Rust!
Nell’iperspazio con Rocket: il Framework Web di Rust!Nell’iperspazio con Rocket: il Framework Web di Rust!
Nell’iperspazio con Rocket: il Framework Web di Rust!
 
Developer Data Modeling Mistakes: From Postgres to NoSQL
Developer Data Modeling Mistakes: From Postgres to NoSQLDeveloper Data Modeling Mistakes: From Postgres to NoSQL
Developer Data Modeling Mistakes: From Postgres to NoSQL
 
Commit 2024 - Secret Management made easy
Commit 2024 - Secret Management made easyCommit 2024 - Secret Management made easy
Commit 2024 - Secret Management made easy
 
E-Vehicle_Hacking_by_Parul Sharma_null_owasp.pptx
E-Vehicle_Hacking_by_Parul Sharma_null_owasp.pptxE-Vehicle_Hacking_by_Parul Sharma_null_owasp.pptx
E-Vehicle_Hacking_by_Parul Sharma_null_owasp.pptx
 
The Ultimate Guide to Choosing WordPress Pros and Cons
The Ultimate Guide to Choosing WordPress Pros and ConsThe Ultimate Guide to Choosing WordPress Pros and Cons
The Ultimate Guide to Choosing WordPress Pros and Cons
 
How to write a Business Continuity Plan
How to write a Business Continuity PlanHow to write a Business Continuity Plan
How to write a Business Continuity Plan
 
Scanning the Internet for External Cloud Exposures via SSL Certs
Scanning the Internet for External Cloud Exposures via SSL CertsScanning the Internet for External Cloud Exposures via SSL Certs
Scanning the Internet for External Cloud Exposures via SSL Certs
 
TrustArc Webinar - How to Build Consumer Trust Through Data Privacy
TrustArc Webinar - How to Build Consumer Trust Through Data PrivacyTrustArc Webinar - How to Build Consumer Trust Through Data Privacy
TrustArc Webinar - How to Build Consumer Trust Through Data Privacy
 
Tampa BSides - Chef's Tour of Microsoft Security Adoption Framework (SAF)
Tampa BSides - Chef's Tour of Microsoft Security Adoption Framework (SAF)Tampa BSides - Chef's Tour of Microsoft Security Adoption Framework (SAF)
Tampa BSides - Chef's Tour of Microsoft Security Adoption Framework (SAF)
 
Dev Dives: Streamline document processing with UiPath Studio Web
Dev Dives: Streamline document processing with UiPath Studio WebDev Dives: Streamline document processing with UiPath Studio Web
Dev Dives: Streamline document processing with UiPath Studio Web
 

Modeling selection pressure in XCS for proportionate and tournament selection

  • 1. Modeling Selection Pressure in XCS for Proportionate and Tournament Selection Albert Orriols-Puig, Kumara Sastry, Pier Luca Lanzi, David E. Goldberg, and Ester Bernad´-Mansilla o IlliGAL Report No. 2007004 February 2007 Illinois Genetic Algorithms Laboratory University of Illinois at Urbana-Champaign 117 Transportation Building 104 S. Mathews Avenue Urbana, IL 61801 Office: (217) 333-2346 Fax: (217) 244-5705
  • 2. Modeling Selection Pressure in XCS for Proportionate and Tournament Selection Albert Orriols-Puig1,2 , Kumara Sastry1 , Pier Luca Lanzi1,3 , David E. Goldberg1 , and Ester Bernad´-Mansilla2 o 1 Illinois Genetic Algorithm Laboratory (IlliGAL) Department of Industrial and Enterprise Systems Engineering University of Illinois at Urbana-Champaign Urbana, IL 61801 2 Group of Research in Intelligent Systems Computer Engineering Department Enginyeria i Arquitectura La Salle — Ramon Llull University Quatre Camins, 2. 08022, Barcelona, Catalonia, Spain. 3 Artificial Intelligence and Robotics Laboratory (AIRLab) Dip. di Elettronica e Informazione Politecnico di Milano P.za L. da Vinci 32, I-20133, Milano, Italy aorriols@salle.url.edu, ksastry@uiuc.edu, lanzi@elet.polimi.it, deg@uiuc.edu, esterb@salle.url.edu February 11, 2007 Abstract In this paper, we derive models of the selection pressure in XCS for proportionate (roulette wheel) selection and tournament selection. We show that these models can explain the empirical results that have been previously presented in the literature. We validate the models on simple problems showing that, (i) when the model assumptions hold, the theory perfectly matches the empirical evidence; (ii) when the model assumptions do not hold, the theory can still provide qualitative explanations of the experimental results. 1 Introduction Learning Classifier Systems are complex, fascinating machines introduced more than 30 years ago by John H. Holland, the father of genetic algorithms (Holland, J.H., 1975). They combine different paradigms (genetic algorithms for search and reinforcement learning for estimation) which are applied to a general-purpose rule-based representation to solve problems online. Because they combine different paradigms, they are also daunting to study. In fact, the analysis of how a learning classifier system works requires knowledge about how the genetic and the reinforcement components 1
  • 3. work and, most important, about how such components interact on the underlying representation. As a consequence, few theoretical models have been developed (e.g., (Horn, Goldberg, & Deb, 1994; Bull, 2001)) and learning classifier systems are more often studied empirically. Recently, facetwise modeling (Goldberg, 2002) has been successfully applied to develop bits and pieces of a theory of XCS (Wilson, 1995), the most influential learning classifier system of the last decade. Butz et al. (Butz, Kovacs, Lanzi, & Wilson, 2004) modeled different generalization pressures in XCS so as to provided the theoretical foundation of Wilson’s generalization hypothe- sis (Wilson, 1998); they also derived population bounds that ensure effective genetic search in XCS. Later, Butz et al. (Butz, Goldberg, & Lanzi, 2004) applied the same approach to derive a bound for the learning time of XCS until maximally accurate classifiers are found. More recently, Butz et al. (Butz, Goldberg, Lanzi, & Sastry, 2004) presented a Markov chain analysis of niche support in XCS which resulted in another population size bound to ensure effective problem substainance. In this paper, we propose a step futher toward the understanding of XCS (Wilson, 1995) and present a model of selection pressure under proportionate (roulette wheel) selection (Wilson, 1995) and tournament selection (Butz, Sastry, & Goldberg, 2005). These selection schemes have been empirically compared by Butz et al. (Butz, Goldberg, & Tharakunnel, 2003; Butz, Sastry, & Gold- berg, 2005) and later by Kharbat et al. (Kharbat, Bull, & Odeh, 2005) leading to different claims regarding the superiority of one selection scheme versus the other. In genetic algorithms, these se- lection schemes have been exhaustively studied through the analysis of takeover time (see (Goldberg & Deb, 1990; Goldberg, 2002) and references therein). In this paper, we follow the same approach as (Goldberg & Deb, 1990; Goldberg, 2002) and develop theoretical models of selection pressure in XCS for proportionate and tournament selection. Specifically, we perform a takeover time analysis to estimate the time from an initial proportion of best individuals until the population is converged or substantially converged to the best. We start from the typical assumption made in takeover time analysis (Goldberg & Deb, 1990): XCS has converged to an optimal solution, which in XCS typically consists of a set of non-overlapping niches. We write differential equations that describe the change in proportion of the best classifier in one niche for roulette wheel and tournament selec- tion. Initially, we focus on classifier accuracy, later we extend the model taking into account also classifier generality. We solve the equations and derive a closed form solution of takeover time in XCS for the two selection schemes (Section 3). In Section 4, we use these equations to determine the conditions under which proportionate and tournament selection (i) produce the same initial growth of the best classifiers in the niche, or (ii) result in the same takeover time. In Section 5, we introduce two artificial test problems which we use in Section 6 to validate the models showing that, when the assumptions of non-overlapping niches hold, the models perfectly match the empir- ical evidence while they accurately approximate the empirical results, when such an assumption is violated. Finally, in Section 7, we extend the models to include classifier generality and show that, again, the models fit empirical evidence when the model assumptions hold. 2 The XCS Classifier System We briefly describe XCS giving all the details that are relevant to this work. We refer the reader to (Wilson, 1995; Butz & Wilson, 2002) for more detailed descriptions. Knowledge Representation. In XCS, classifiers consist of a condition, an action, and four main parameters: (i) the prediction p, which estimates the payoff that the system expects when the classifier is used; (ii) the prediction error , which estimates the error affecting the prediction p; (iii) the fitness F , which estimates the accuracy of the payoff prediction given by p; and (iv) the numerosity num, which indicates how many copies of classifiers with the same condition and the 2
  • 4. same action are present in the population. Performance Component. At time t, XCS builds a match set [M] containing the classifiers in the population [P] whose condition matches the current sensory input st ; if [M] contains less than θnma actions, covering takes place and creates a new classifier that matches s t and has a random action. For each possible action a in [M], XCS computes the system prediction P (s t , a) which estimates the payoff that XCS expects if action a is performed in st . The system prediction P (st , a) is computed as the fitness weighted average of the predictions of classifiers in [M] which advocate action a. Then, XCS selects an action to perform; the classifiers in [M] which advocate the selected action form the current action set [A]. The selected action a t is performed, and a scalar reward R is returned to XCS.1 Parameter Updates. The incoming reward R is used to update the parameters of the classifiers in [A]. First, the classifier prediction pk is updated as, pk ← pk + β(R − pk ). Next, the error k is updated as, k ← k + β(|R − p| − k ). To update the classifier fitness F , the classifier accuracy κ is first computed as, 1 if ε < ε0 κ= (1) α(ε/ε0 )−ν otherwise the accuracy κ is used to compute the relative accuracy κ as, κ = κ/ [A] κi . Finally, the classifier fitness F is updated towards the classifier’s relative accuracy κ as, F ← F + β(κ − F ). Genetic Algorithm. On regular basis (dependent on the parameter θga ), the genetic algorithm is applied to classifiers in [A]. It selects two classifiers, copies them, and with probability χ performs crossover on the copies; then, with probability µ it mutates each allele. The resulting offspring classifiers are inserted into the population and two classifiers are deleted to keep the population size constant. Two selection mechanisms have been introduced so far for XCS: proportionate, roulette wheel, selection (Wilson, 1995) and tournament selection (Butz, Sastry, & Goldberg, 2005). Roulette wheel selects a classifier with a probability proportional to its fitness. Tournament randomly chooses the τ percent of the classifiers in the action set and among these it selects the classifier with higher “microclassifier fitness” fk computed as fk = Fk /nk (Butz, Sastry, & Goldberg, 2005; Butz, 2003). 3 Modeling Takeover Time The analysis of takeover time in XCS poses two main challenges. First, while in genetic algorithms the fitness of an individual is usually constant, in XCS classifier fitness changes over time based on the other classifiers that appear in the same evolutionary niche. Second, while in genetic algorithms the selection and the replacement of individuals are usually performed over the whole population, in XCS selection is niche based, while deletion is population based. To model takeover time (Goldberg & Deb, 1990), we have to assume that XCS has already converged to an optimal solution, which in XCS consists of non overlapping niches (Wilson, 1995). Accordingly, we can focus on one niche without taking into account possible interactions among overlapping niches. We consider a simplified scenario in which a niche contains two classifiers, cl 1 and cl 2 ; classifier cl k has fitness Fk , prediction error k , numerosity nk , and microclassifier fitness fk = Fk /nk . In this initial phase, we focus on classifier accuracy and hypothesize that cl 1 be the 1 In this paper we focus on XCS viewed as a pure classifier, i.e., applied to single-step problems. A complete description is given elsewhere (Wilson, 1995; Butz & Wilson, 2002). 3
  • 5. “best” classifier in the niche, because is the most accurate, i.e., κ1 ≥κ2 , while we assume that cl 1 and cl 2 are equally general and thus they have the same reproductive opportunities (this assumption will be relaxed later in Section 7). Finally, we assume that deletion selects classifiers randomly from the same niche. Although this assumption may appear rather strong, if the niches are activated uniformly this assumption will have little effect as the empirical validation of the model will show (Section 6). 3.1 Roulette Wheel Selection Under Roulette Wheel Selection (RWS), the selection probability of a classifier depends on the ratio of its fitness Fi over the fitness of all classifiers in the action set. Without loss of generality, we assume that classifier fitness is a simple average of classifier’s relative accuracies and compute the fitness of classifiers cl 1 and cl 2 as, κ 1 n1 1 F1 = = κ 1 n1 + κ 2 n2 1 + ρnr κ 2 n2 ρnr F2 = = κ 1 n1 + κ 2 n2 1 + ρnr where nr = n2 /n1 and ρ is the ratio between the accuracy of cl 2 and the accuracy of cl 1 (ρ = κ1 /κ2 ). The probability Ps of selecting the best classifier cl 1 in the niche is computed as, F1 1 Ps = = F1 + F 2 1 + ρnr Once selected, a new classifier is created and inserted in the population while one classifier is randomly deleted from the niche with probability Pdel (cl j ) = nj /n with n = n1 + n2 . We can now model the evolution of the numerosity of the best classifier cl 1 at time t, n1,t , which will (i) increase in the next generation if cl 1 is selected by the genetic algorithm and another classifier is selected for deletion; (ii) decrease if cl 1 is not selected by the genetic algorithm but cl 1 is selected for deletion; (iii) remain the same, in all the other cases. More formally, 1 n1   n1,t + 1 1+ρnr 1 − n     1 1 − 1+ρnr n1 n1,t − 1 n1,t+1 = n    n1,t otherwise   where n is the niche size. This model is relaxed by assuming that only one classifier can be deleted when sampling the niche it belongs. Grouping the equations above, we obtain, n1,t 1 n1,t+1 = n1,t + − 1 + ρnr n which can be rewritten in terms of the proportion Pt of classifiers cl 1 in the niche (i.e., Pt = n1,t /n). Using the equality nr = (1 − Pt )/Pt we derive, 1 1 1 Pt+1 = Pt + · − Pt 1−Pt n 1+ρ P n t assuming Pt+1 − Pt ≈ dp/dt we have, 1 Pt (1 − ρ) − Pt2 (1 − ρ) dp ≈ Pt+1 − Pt = (2) dt n Pt (1 − ρ) + ρ 4
  • 6. that is, Pt (1 − ρ) + ρ 1−ρ dp = dt (3) Pt (1 − Pt ) n which can be solved by integrating each side of the equation, between P0 , the initial proportion of cl 1 , and the final proportion P of cl 1 up to which cl 1 has taken over, P Pt (1 − ρ) + ρ 1−ρ t(1 − ρ) dp = dt = (4) Pt (1 − Pt ) N N P0 The left integral can be solved as follows: P P Pt (1 − ρ) + ρ ρ(1 − Pt ) + Pt t(1 − ρ) dp = dp = (5) Pt (1 − Pt ) Pt (1 − Pt ) n P0 P0 P P ρ 1 t(1 − ρ) dp + dp = (6) P0 P t P0 (1 − Pt ) n P 1−P t(1 − ρ) ρ ln − ln = (7) P0 1 − P0 n from which we derive the takeover time of cl 1 in roulette wheel selection, N P 1 − P0 t∗ = ρ ln + ln (8) rws 1−ρ P0 1−P The takeover time t∗ under the assumption that the two classifiers are equally general depends rws (i) on the ratio ρ between the accuracy of cl 2 and the accuracy of cl 1 , as well as, (ii) on the initial proportion of cl 1 in the population. A higher ρ implies an increase in the takeover time. When ρ = 1 (i.e., cl 1 and cl 2 are equally accurate), t∗ tends to infinity, that is, both cl 1 and cl 2 will rws remain in the population. When ρ is smaller, the takeover time decreases. For a ρ close to zero, 1−P0 t∗ can be approximated by t∗ ρ→0 ≈ n ln 1−P . The takeover time also depends on the initial rws proportion P0 of cl 1 in the population. A lower P0 increases the term inside the brackets, and so it increases the takeover time. In contrast, an higher P0 results in a lower takeover time. 3.2 Tournament Selection To model takeover time for tournament selection in XCS we assume a fixed tournament size of s, instead of the typical variable tournament size (Butz, 2003). The underline assumption of the takeover time analysis is that the system already converged to an optimal solution made of non overlapping niches. Thus, there is basically no difference between a fixed tournament size and a variable one. Tournament selection randomly chooses s classifiers in the action set and selects the one with higher fitness. As before, we assume that cl 1 is the best classifier in the niche, which in terms of tournament selection translates into requiring that f1 > f2 , where fi is the fitness of the microclassifiers associated to cl i . In this case, the numerosity n1 of cl 1 will (i) increase if cl 1 participates in the tournament and another classifier is selected to be deleted; (ii) decrease if cl 1 does not participate in the tournament but is selected by the deletion operator; (iii) remain the same, otherwise. More formally, s  1 − 1 − n1 1 − n1  n1,t + 1 n n   s  1 − n1 n1 n1,t − 1 n1,t+1 = n n   n1,t otherwise   5
  • 7. By grouping the above equations we derive the expected numerosity of cl 1 , n1 s n1 n1 s n1 nt+1 = nt + 1 − 1 − 1− − 1− n n n n which we rewrite in terms of the proportion P of cl 1 in the niche (i.e., Pt = n1,t /n) as, 1 (1 − Pt ) 1 − (1 − Pt )s−1 Pt+1 = Pt + (9) n dp Assuming ≈ Pt+1 − Pt , we derive, dt dp 1 (1 − Pt )[1 − (1 − Pt )s−1 ] , ≈ Pt+1 − Pt = (10) dt n that is, (1 − Pt )s−2 dt 1 = dp + dp 1 − (1 − Pt )s−1 n 1 − Pt Integrating each side of the equation we obtain, P P (1 − Pt )s−2 dt 1 = dp + dp 1 − (1 − Pt )s−1 n 1 − Pt P0 P0 i.e., 1 − (1 − P )s−1 t 1 − P0 1 = ln + ln 1 − (1 − P0 )s−1 n 1−P s−1 so that the takeover time of cl 1 for tournament selection is, 1 − (1 − P )s−1 1 − P0 1 t∗ S = n ln + ln (11) T 1 − (1 − P0 )s−1 1−P s−1 Given our assumptions, takeover time for tournament selection depends on the initial proportion of the best classifier P0 and the tournament size s. Both logarithms on the right hand side take positive values if P > P0 , indicating that the best classifier will always take over the population regardless of its initial proportion in the population. When P < P0 , both logarithms result in negative values, and so does the takeover time. 4 Comparison We now compare the takeover time for roulette wheel selection and tournament selection and we study the salient differences between the models. For this purpose, we compute the values of s and ρ for which, (i) the two selection schemes have the same initial increase of the proportion of the best classifier, and for which (ii) the two selection schemes have the same takeover time. This analysis results in two expressions that permit to compare the behavior of roulette wheel selection and tournament selection in different scenarios. First, we analyze the relation between the ratio of classifier accuracies ρ and the selection pressure s in tournament selection to obtain the same initial increase in the proportion of the best classifier with both selection schemes. Taking the equations 2 and 10, and replacing P t by P0 we get that the initial increase of the best classifier in each selection scheme is: 1 − ρ P0 (1 − P0 ) ∆RW S = n (1 − ρ)P0 + ρ 1 (1 − P0 )[1 − (1 − P0 )s−1 ] ∆T S = n 6
  • 8. By requiring ∆RW S = ∆T S , we obtain, 1 − ρ P0 (1 − P0 ) 1 − P0 [1 − (1 − P0 )s−1 ], = n (1 − ρ)P0 + ρ n that is, Pt (1 − ρ) = 1 − (1 − Pt )s−1 , (1 − ρ)Pt + ρ ln ρ − ln [(1 − ρ)P0 + ρ] s=1+ (12) ln(1 − P0 ) This equation indicates that, in tournament selection, the tournament size s which regulates the selection pressure has to increase as the ratio of accuracies ρ decreases to have the same initial increase of the best classifier in the population as roulette wheel selection. For example, for ρ = 0.01 and P0 = 0.01, tournament selection requires s = 70 to produce the same initial increase of the best classifier as roulette wheel selection. On the other hand, low values of s result in the same effect as roulette wheel selection with high values of ρ. Equation 12 indicates that, even with a small tournament size, tournament selection produces a stronger pressure towards the best classifier in scenarios in which slightly inaccurate but initially highly numerous classifiers are competing against highly accurate classifiers. On the other hand, when the competition involves highly inaccurate classifiers, a larger tournament size s is required to obtain the same selection pressure provided by roulette wheel selection. We now analyze the conditions under which both selection schemes result in the same takeover time. For this purpose, we equate t∗ S in Equation 8 with t∗ S in Equation 11, RW T t∗ S = t ∗ S (13) RW T P ∗ )s−1 P∗ n 1 − P0 1 − P0 1 1 − (1 − ρ ln + ln = n ln + ln (14) 1 − (1 − P0 )s−1 1−ρ P0 1 − P∗ 1 − P∗ s−1 Which can be rewriten as follows: 1 − (1 − P ∗ )s−1 P ∗ (1 − P0 ) ρ 1 ln = ln . 1 − (1 − P0 )s−1 1−ρ P0 (1 − P ∗ ) s−1 By approximating (1 − x)s−1 by its first order Taylor series at the point 0, that is, (1 − x)s−1 = 1 + (s − 1)x, and by futher simplifications, we derive, 1 − (1 − P ∗ )s−1 P∗ 1 1 ln = ln (15) 1 − (1 − P0 )s−1 s−1 s−1 P0 Reorganizing, we obtain the following relation: ln(P ∗ ) − ln(P0 ) 1−ρ s=1+ (16) ρ ln[P ∗ (1 − P0 )] − ln[P0 (1 − P ∗ )] Given an initial proportion of the best classifier, the equation is guided by the term 1−ρ . As the ρ accuracy-ratio ρ decreases, s needs to increase polynomially. On the other hand, higher values of ρ require a low tournament size s. Thus, Equation 16 reaches the same conclusions of Equation 12: tournament selection is better than roulette wheel in scenarios where highly accurate classifiers compete with slightly inaccurate ones. 7
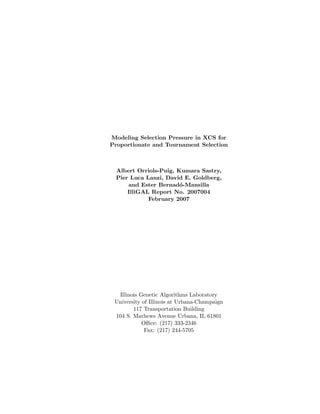
  • 9. 5 Test Problems To validate the models of takeover time for roulette wheel and proportionate selection, we designed two test problems. The single-niche problem fully agrees with the model assumption. It consists of a niche with a highly accurate classifier cl 1 and a less accurate classifier cl 2 . The covering is off and the population is initialized with N · P0 copies of cl 1 and N · (1 − P0 ) copies of cl 2 , where N is the population size. The prediction error 1 of the best classifier cl 1 is always set to zero while the prediction error 2 of cl 2 is set as, ρν 2= 0 (17) α where ρ is the ratio between the accuracy of cl 2 and the accuracy of cl 1 (i.e., ρ = κ2 /κ1 ; Section 3). The multiple-niche problem consists of a set of m niches each one containing one maximally accurate classifier and one classifier that belongs to all niches. The population contains P 0 · N copies of maximally accurate classifiers (equally distributed in the m niches) and (1 − m · P 0 ) · N copies of the classifier that appears in all the niches. The parameters of classifiers are updated as in the case of the single niche in the previous section, permitting to vary the ratio of accuracies ρ, and so, validating the model under different circumstances. This test problem violates two model assumptions. First, the size of the different niches differ from the population size since the problem consists of more than one niche. While in the model we assumed that the deletion would always select a classifier in the same niche, in this case deletion can select any classifier from the population. Second, the niches are overlapping since there is a classifier that belongs to all the niches. This also means that the sum of all niche sizes will be greater than the population size, i.e., m 1 (ni,1 + ni,2 ) > N , where ni,1 is the numerosity of the maximally accurate classifier in niche i and ni,1 is the numerosity of the less accurate classifier in the niche i. 6 Experimental Validation We validated the takeover time models using the single-niche problem and the multiple-niche problem. Our results show a full agreement between the model and the experiments in the single- niche problem, when all the model assumptions hold. They also show that the theory correctly predicts the practical results in problems where the initial assumptions do not hold, if either the accuracy-ratio is low enough in roulette wheel selection or the tournament size is high enough in tournament selection. Single-Niche. At first, we applied XCS on the single-niche problem and analyzed the proportion of the best classifier cl 1 under roulette wheel selection and tournament selection. Figure 1 compares the proportion of the best classifier in the niche as predicted by our model (reported as lines) and the empirical data (reported as dots) for roulette wheel selection and tournament selection with s = {2, 3, 9} when ρ = 0.01. The empirical data are averages over 50 runs. Figure 1 shows a perfect match between the theory and the empirical results. It also shows that, as predicted by the models and discussed in Section 4, roulette wheel produces a faster increase in the proportion of the best classifier for ρ = 0.01. To obtain a similar increase with tournament selection we need a higher tournament size: in fact, the second best increase in the proportion of the best classifier is provided by tournament selection with s = 9. Finally, as indicated by the theory, the time to achieve a certain proportion of the best classifier in tournament selection increases as the selection pressure decreases. We performed another set of experiments and compared the proportion of the best classifier in the niche for an accuracy ratio ρ of 0.5 and 0.9. Figure 2 compares the proportion of cl 1 as 8
  • 10. Takeover time for ρ = 0.01 1 0.9 0.8 0.7 Proportion of the Best Classifier Empirical RWS 0.6 Model RWS Empirical TS s=2 Model TS s=2 0.5 Empirical TS s=3 Model TS s=3 Empirical TS s=9 0.4 Model TS s=9 0.3 0.2 0.1 0 0 2000 4000 6000 8000 10000 12000 14000 16000 Activation Time of the Niche Figure 1: Empirical and theoretical takeover time when ρ = 0.01 for roulette wheel selection and tournament selection with s=2, s=3 and s=9. predicted by our model (reported as lines) and the empirical data (reported as dots) for (a) ρ = 0.5 and (b) ρ = 0.9; the empirical data are averages over 50 runs. The results show a good match between the theory and the empirical results. As predicted by the model, tournament selection is not influenced by the increase of ρ: the increase in the proportion of cl 1 for ρ = 0.5 (Figure 2a) is basically the same as the increase obtained when ρ = 0.9 (Figure 2b). Thus, coherently to what empirically shown in (Butz, Sastry, & Goldberg, 2005), tournament selection demonstrates its robustness in maintaining and increasing the proportion of the best classifier even when there is a small difference between the fitness of the most accurate classifier (cl 1 ) and the fitness of the less accurate one (cl 2 ). In contrast, roulette wheel selection is highly influenced by the accuracy ratio ρ: as the ratio approaches 1, i.e., the accuracy of the two classifiers become very similar, the increase in the proportion of the best classifier becomes smaller and smaller. In fact, when ρ = 0.90, after 16000 activations of the niche the best classifier cl 1 has taken over only the 5% of the niche. Multiple-niche. In the next set of experiments, we validated our model of takeover time on the multiple-niche problem, where the assumptions about non-overlapping niches and about deletion being performed in the niche are violated. For this purpose, we ran XCS on the multiple-niche problem with two niches (m = 2); each niche contains one maximum accurate classifier and there is one, less accurate, overlapping classifier that participates in both niches. Figure 3a compares the proportion of the best classifier in the niche for roulette wheel selection for an accuracy ratio ρ of 0.01 and 0.20. The plots indicate that, for small values of the accuracy ratio ρ, our model (reported as lines) slightly underestimates the empirical takeover time (reported as dots). As the accuracy ratio ρ increases, the model tends to overestimate the empirical data (Figure 3b). This behavior can be easily explained. The lower the accuracy ratio (Figure 3a), the higher the pressure toward the highly accurate classifiers, and consequently, the faster the takeover time. When ρ is 0.20 and 0.30, the difference between the model and the empirical results is visible only at the beginning, while it basically disappears as the number of activations increases. For higher values of ρ, the overgeneral, less accurate, cl 2 has more reproductive opportunities in both niches it participates. These results indicate that (i) the model for roulette wheel selection is accurate in general scenarios if the ratio of accuracies is small (i.e., when there is a large proportion of accurate classifiers in the niche); (ii) in situations where there is a small proportion of the best classifier in one niche competing with other slightly inaccurate and overgeneral classifiers (above 9
  • 11. Takeover time for ρ = 0.50 Takeover time for ρ = 0.90 1 1 0.9 0.9 0.8 0.8 Empirical RWS Model RWS 0.7 0.7 Proportion of the Best Classifier Proportion of the Best Classifier Empirical TS s=2 Model TS s=2 Empirical RWS Empirical TS s=3 0.6 0.6 Model RWS Model TS s=3 Empirical TS s=2 Empirical TS s=9 Model TS s=2 0.5 0.5 Model TS s=9 Empirical TS s=3 Model TS s=3 Empirical TS s=9 0.4 0.4 Model TS s=9 0.3 0.3 0.2 0.2 0.1 0.1 0 0 0 2000 4000 6000 8000 10000 12000 14000 16000 0 2000 4000 6000 8000 10000 12000 14000 16000 Activation Time of the Niche Activation Time of the Niche (a) (b) Figure 2: Empirical and theoretical takeover time for roulette wheel selection and tournament selection with s=2, s=3 and s=9 when (a) ρ = 0.50 and (b) ρ = 0.90. a certain threshold of ρ), the overgeneral classifier may take over the population removing all the copies of the best classifier. It is interesting to note that, as the number of niches increases from m = 2 to m = 16, the agreement between the theory and the experiments gently degrades (see appendix A for more results). Figure 4a compares the proportion of the best classifier as predicted by our model and as empirically determined in tournament selection with s = 9. As in roulette wheel selection for a small ρ, the results for tournament selection show that the empirical takeover time is slightly faster than the one predicted by the theory. Again, this behavior is due to the presence of the overgeneral classifier in both niches, causing a higher pressure toward its deletion. Increasing the tournament size s produces little variations in either the empirical results or the theoretical values, and so the conclusions extracted for s = 9 can be extended for a higher s. On the other hand, decreasing s causes the empirical values to go closer to the theoretical values, since the pressure toward the deletion of the overgeneral classifier decreases. Figure 4b reports the proportion of one of the maximum accurate classifiers for s ∈ {2, 3}. The results show that the theory accurately predicts the empirical values for s = 3, but for s = 2 the difference between the model and the data is large. In this case, a small tournament size combined with the presence of the overgeneral classifier in both niches produces a strong selection pressure toward the overgeneral classifier that delays the takeover time. The results in the multi-niche problem confirm what empirically shown in (Butz, Sastry, & Goldberg, 2005): tournament selection is more robust than roulette wheel selection. Under perfect conditions both schemes perform similarly, which is coherent to what shown in (Kharbat, Bull, & Odeh, 2005). However, the takeover time of the best classifier is delayed in roulette wheel selection for an higher accuracy ratio ρ. The empirical results indicate that, with roulette wheel selection, the best classifier was eventually removed from the population when ρ ≥ 0.5. On the other hand, tournament selection demonstrated theoretically and practically to be more robust, since it does not depend on the individual fitness of each classifier. In all the experiments with tournament selection, the best classifier could take over the niche, and only for the extreme case (i.e., for s = 2) 10
  • 12. Takeover time in RWS for Overlapping Niches and δ={0.01,0.20} Takeover time in RWS for Overlapping Niches and ρ={0.30,0.40,0.50} 1 1 0.9 0.9 0.8 0.8 Proportion of the Best Classifier Proportion of the Best Classifier Empirical RWS δ=0.01 Empirical RWS ρ=0.30 0.7 0.7 Model RWS δ=0.01 Model RWS ρ=0.30 Empirical RWS δ=0.20 Empirical RWS ρ=0.40 Model RWS δ=0.20 Model RWS ρ=0.40 0.6 0.6 0.5 0.5 0.4 0.4 0.3 0.3 0.2 0.2 0.1 0.1 0 2000 4000 6000 8000 10000 12000 14000 16000 0 2000 4000 6000 8000 10000 12000 14000 16000 Activation Time of the Niche Activation Time of the Niche (a) (b) Figure 3: Takeover time for roulette wheel selection when (a) ρ = {0.01, 0.20} and (b) ρ ∈ {0.30, 0.40}. the experiments considerably disagreed with the theory. 7 Modeling Generality Finally, we extend our model of takeover time with classifier generality. As before, we model the proportion of the best classifier cl 1 in one niche, however, in this case cl 1 is not only the maximally accurate classifier in the niche, but also the maximally general with respect to niche; thus cl 1 is now the best classifier in the most typical XCS sense (Wilson, 1998). We focus on one niche and assume that cl 1 , being the maximally general and maximally accurate classifier for the niche, appears in the niche with probability 1 so that cl 2 appears in the niche with a relative probability ρm . Similarly to what we previously did in Section 3, we can model the numerosity of the classifier cl 1 at time t, n1,t as follows. The numerosity n1,t of cl 1 in the next generation will (i) increase when both cl 1 and cl 2 appear in the niche and cl 1 is selected by the genetic algorithm while cl 2 is selected for deletion; (ii) increase when only cl 1 appears in the niche and another classifier is deleted; (iii) decrease only if both cl 1 and cl 2 are in the niche, cl 1 is not selected by the genetic algorithm but it is selected for deletion. Otherwise, the numerosity of cl 1 will remain the same. More formally,  1 1 − n1 + (1 − ρm ) 1 − n1 n1,t + 1 ρm 1+ρn n n r   1 n1 n1,t+1 = n1,t − 1 ρm 1 − 1+ρnr n  n1,t otherwise  As done before, we can group these equations to obtain, n1,t n1,t 1 n1,t+1 = n1,t + ρm − + (1 − ρm ) 1 − 1 + ρnr n n 11
  • 13. Takeover time in TS s=9 for Overlapping Niches Takeover time in TS s={2,3} for Overlapping Niches 1 1 0.9 0.9 0.8 0.8 Proportion of the Best Classifier Proportion of the Best Classifier Empirical TS s=9 Model TS s=9 0.7 0.7 Empirical TS s=2 0.6 0.6 Model TS s=2 Empirical TS s=3 0.5 0.5 Model TS s=3 0.4 0.4 0.3 0.3 0.2 0.2 0.1 0.1 0 2000 4000 6000 8000 10000 12000 14000 16000 0 2000 4000 6000 8000 10000 12000 14000 16000 Activation Time of the Niche Activation Time of the Niche (a) (b) Figure 4: Takeover time for tournament selection when (a) s = 9, (b) s ∈ {2, 3}. we rewrite n1,t in terms of the proportion Pt of cl 1 in the niche (Pt = n1,t /n with nr = (1 − Pt )/Pt ) and obtain, 1 1 − Pt Pt+1 = Pt + · [(1 − ρ)Pt + (1 − ρm ))ρ] n ρ + (1 − ρ)Pt Assuming Pt+1 − Pt ≈ dp/dt, dp 1 1 − Pt ≈ Pt+1 − Pt = · [(1 − ρ)Pt + (1 − ρm ))ρ] dt n rho + (1 − ρ)Pt which can be simplified as follows: ρ + (1 − ρ)P 1 dP = dt (1 − P ) [(1 − ρ)P + ρ(1 − ρm )] n Integrating the above equation with initial conditions t = 0, Pt = P0 , we get the takeover time as: n 1 − P0 t∗ rws = ln + 1 − ρρm 1−P (1 − ρ)P + ρ(1 − ρm ) + ρρm ln (18) (1 − ρ)P0 + ρ(1 − ρm ) which depends on the ratio of accuracies ρ, the initial proportion of the best classifier P 0 and the generality of the inaccurate classifier, represented by ρm . In the previous model, cl 1 would not take over the niche when it was as accurate as cl 2 (Section 3). In this case, cl 1 will take over the population if it is either more accurate or more general than cl 2 . Otherwise, if cl1 and cl2 are equally accurate and general, both will persist in the population (t∗ S → ∞), coherently with RW the previous model. Low values of ρm suppose quicker takeover times than high values of ρm . For ρm = 1, i.e., the classifiers cl1 and cl2 are equally general, Equation 18 is equivalent to Equation 8. 12
  • 14. Similarly, we extend the model of takeover time for tournament selection taking classifier gen- erality into account. In this case, the numerosity n1,t of cl 1 at time t is,  n1,t + 1 ρm 1 − 1 − n1 s · n   · 1 − n1 + (1 − ρm ) 1 − n1   n n n1,t+1 = n1,t − 1 ρm 1 − n1 s n1 n n    n otherwise. 1,t Grouping these equations, we obtain: n1 s n1 n1 n1 s n1 nt+1 = nt + ρm 1 − 1 − 1− + (1 − ρm ) 1 − − ρm 1 − , (19) n n n n n As we did before, we can group these equations and we can rewrite n 1,t+1 in terms of Pt as, 1 (1 − Pt ) 1 − ρm (1 − Pt )s−1 Pt+1 = Pt + n dp which, by assuming ≈ Pt+1 − Pt : dt dp 1 (1 − Pt )[1 − ρm (1 − Pt )s−1 ] ≈ Pt+1 − Pt = (20) dt n dt 1 = dp (21) (1 − Pt )[1 − ρm (1 − Pt )s−1 ] n ρm (1 − Pt )s−2 dt 1 = dp + dp (22) 1 − ρm (1 − Pt )s−1 n 1 − Pt Integrating each side of the expression we obtain: P P ρm (1 − Pt )s−2 dt 1 = dp + dp (23) 1 − ρm (1 − Pt )s−1 n 1 − Pt P0 P0 1 − ρm (1 − P )s−1 t 1 − P0 1 = ln + ln (24) 1 − ρm (1 − P0 )s−1 n 1−P s−1 Thus, the takeover time of the classifier cl1 in tournament selection is: 1 − ρm (1 − P )s−1 1 − P0 1 t∗ S = n ln + ln (25) T 1 − ρm (1 − P0 )s−1 1−P s−1 Takeover time for tournament selection now depends on the tournament size s, the initial proportion of the best classifier P0 , and also on the generality of the inaccurate classifier ρm . For low ρm or high s, the value of the second logarithm in the right term of the equation diminishes so that the takeover time mainly depends logarithmically on P0 . High values of ρm imply slower takeover times; for ρm = 1, this model equates to Equation 11. We validated the new models of takeover time for roulette wheel selection and tournament selection on the single-niche problem for a matching ratio ρm of 0.1 and 0.9. The experimental design is essentially the same one used in the previous experiments (Section 6), but in this case the less accurate and less general classifier cl 2 appears in the niche with probability ρm . Figure 5 compares the proportion of the best classifier cl 1 in the niche as predicted by the theory and empirically determined. Both the plots for roulette wheel selection (Figure 5) and tournament selection (Figure 6) show a perfect match between the theory (reported as lines) and the empirical data (reported as dots). 13
  • 15. Takeover time for ρ = 0.10 Takeover time for ρ = 0.90 m m 1 1 0.9 0.9 0.8 0.8 Proportion of the Best Classifier Proportion of the Best Classifier 0.7 0.7 Empirical RWS ρ=0.10 0.6 0.6 Model RWS ρ=0.10 Empirical RWS ρ=0.30 0.5 0.5 Model RWS ρ=0.30 Empirical RWS ρ=0.10 Empirical RWS ρ=0.50 Model RWS ρ=0.10 0.4 0.4 Model RWS ρ=0.50 Empirical RWS ρ=0.30 Empirical RWS ρ=0.70 Model RWS ρ=0.30 Model RWS ρ=0.70 0.3 0.3 Empirical RWS ρ=0.50 Empirical RWS ρ=0.90 Model RWS ρ=0.50 Model RWS ρ=0.90 0.2 0.2 Empirical RWS ρ=0.70 Model RWS ρ=0.70 Empirical RWS ρ=0.90 0.1 0.1 Model RWS ρ=0.90 0 0 0 1000 2000 3000 4000 5000 6000 7000 8000 0 0.5 1 1.5 2 2.5 3 Activation Time of the Niche Activation Time of the Niche 4 x 10 (a) (b) Figure 5: Takeover time for roulette wheel selection when (a) ρm is 0.1 and (b) ρm is 0.9. 8 Conclusions We have derived theoretical models for the selection pressure in XCS under roulette wheel and tour- nament selection. We have shown that our models are accurate in very simplified scenarios, when the models’ assumptions hold, and they can qualitatively explain the behavior of the two selection mechanisms in more complex scenarios, when the models’ assumptions do not hold. Overall, our models confirm what empirically shown in (Butz, Sastry, & Goldberg, 2005): tournament selection is more robust than roulette wheel selection. Under perfect conditions both schemes perform sim- ilarly, which is coherent to what shown in (Kharbat, Bull, & Odeh, 2005). However, the selection pressure is weaker in roulette wheel selection when the classifiers in the niche have similar accura- cies. On the other hand, tournament selection turns out to be more robust both theoretically and practically, since it does not depend on the individual fitness of each classifier. Acknowledgements This work was sponsored by Enginyeria i Arquitectura La Salle, Ramon Llull University, as well as the support of Ministerio de Ciencia y Tecnolog´ under project TIN2005-08386-C05-04, and ıa Generalitat de Catalunya under Grants 2005FI-00252 and 2005SGR-00302. This work was also sponsored by the Air Force Office of Scientific Research, Air Force Materiel Command, USAF, under grant FA9550-06-1-0096, the National Science Foundation under grant DMR-03-25939 at the Materials Computation Center. The U.S. Government is authorized to reproduce and distribute reprints for government purposes notwithstanding any copyright notation thereon. The views and conclusions contained herein are those of the authors and should not be interpreted as necessarily representing the official policies or endorsements, either expressed or implied, of the Air Force Office of Scientific Research, the National Science Foundation, or the U.S. Government. 14
  • 16. Takeover time for ρ = 0.10 Takeover time for ρ = 0.90 m m 1 1 0.9 0.9 0.8 0.8 Proportion of the Best Classifier Proportion of the Best Classifier 0.7 0.7 0.6 0.6 0.5 0.5 0.4 0.4 Empirical TS s=2 Empirical TS s=2 Model TS s=2 Model TS s=2 Empirical TS s=3 Empirical TS s=3 0.3 0.3 Model TS s=3 Model TS s=3 Empirical TS s=10 Empirical TS s=10 0.2 0.2 Model TS s=10 Model TS s=10 Empirical TS s=70 Empirical TS s=70 Model TS s=70 Model TS s=70 0.1 0.1 0 0 0 1000 2000 3000 4000 5000 6000 7000 8000 9000 10000 0 1000 2000 3000 4000 5000 6000 7000 8000 9000 10000 Activation Time of the Niche Activation Time of the Niche (b) Figure 6: Takeover time for tournament selection when (a) ρm is 0.1 and (b) ρm is 0.9. References Bull, L. (2001). Simple markov models of the genetic algorithm in classifier systems: Accuracy- based fitness. In Lanzi, P. L., Stolzmann, W., & Wilson, S. W. (Eds.), Advances in Learning Classifier Systems: Proceedings of the Third International Workshop, LNAI 1996 (pp. 21–28). Berlin Heidelberg: Springer-Verlag. Butz, M., Goldberg, D. E., & Tharakunnel, K. K. (2003). Analysis and improvement of fitness exploitation in xcs: Bounding models, tournament selection, and bilateral accuracy. Evolu- tionary Computation, 11 (3), 239–277. Butz, M., Goldberg, D. G., & Lanzi, P. L. (2004, 26-30 June). Bounding learning time in xcs. In Genetic and Evolutionary Computation – GECCO-2004, LNCS (pp. 739–750). Seattle, WA, USA: Springer-Verlag. Butz, M., Goldberg, D. G., Lanzi, P. L., & Sastry, K. (2004, November). Bounding the population size to ensure niche support in xcs (Technical Report 2004033). Illinois Genetic Algorithms Laboratory – University of Illinois at Urbana-Champaign. Butz, M. V. (2003). Documentation of XCS+TS c-code 1.2 (Technical Report 2003023). Illinois Genetic Algorithm Laboratory (IlliGAL), University of Illinois at Urbana-Champaign. Butz, M. V., Kovacs, T., Lanzi, P. L., & Wilson, S. W. (2004, February). Toward a theory of generalization and learning in xcs. IEEE Transaction on Evolutionary Computation, 8 (1), 28–46. Butz, M. V., Sastry, K., & Goldberg, D. E. (2005). Strong, stable, and reliable fitness pressure in XCS due to tournament selection. Genetic Programming and Evolvable Machines, 6 , 53–77. Butz, M. V., & Wilson, S. W. (2002). An algorithmic description of XCS. Journal of Soft Com- puting, 6 (3–4), 144–153. Goldberg, D. E. (2002). The design of innovation: Lessons from and for competent genetic algorithms. Kluwer Academic Publishers. Goldberg, D. E., & Deb, K. (1990). A comparative analysis of selection schemes used in genetic algorithms. In Rawlins, G. J. E. (Ed.), FOGA (pp. 69–93). Morgan Kaufmann. 15
  • 17. Holland, J.H. (1975). Adaptation in Natural and Artificial Systems. The University of Michigan Press. Horn, J., Goldberg, D. E., & Deb, K. (1994). Implicit niching in a learning classifier system: Nature’s way. Evolutionary Computation, 2 (1), 37–66. Kharbat, F., Bull, L., & Odeh, M. (2005, 2-5 September). Revisiting genetic selection in the xcs learning classifier system. In Congress on Evolutionary Computation, Volume 3 (pp. 2061– 2068). Edinburgh, UK: IEEE. Wilson, S. W. (1995). Classifier Fitness Based on Accuracy. Evolutionary Computation, 3 (2), 149–175. http://prediction-dynamics.com/. Wilson, S. W. (1998). Generalization in the XCS classifier system. In Genetic Programming 1998: Proceedings of the Third Annual Conference (pp. 665–674). Morgan Kaufmann. A Experimental Validation on the 16-Niche Problem Finally, we aim at analyzing if the agreement between the theory and the empirical observations degrade if the number of overlapping niches increases. For this purpose, we ran XCS on the multiple-niche problem fixing the number of niches to m=16. That is, the problem consisted of 16 niches, one maximum accurate classifier per niche, and one less accurate, overlapping classifier that participates in all the 16 niches. Figure 7(a) and 7(b) compare the proportion of the best classifier in the niche for roulette wheel selection for ρ={0.01,0.20,0.30,0.40}. The plots show that, for small values of the accuracy ratio ρ, the empirical takeover time (reported as dots) is slightly slower than the one predicted by our model (reported as lines). For higher values of ρ, the difference between the model and the empirical results is more pronounced. So, we find a similar behavior to the multiple- niche problem with two niches. But now, increasing the number of niches also delays the takeover time, and the agreement between the model and the empirical results degrades faster as ρ increases. This difference can be easily explained. As m increases, the ovegeneral classifier participates in a higher proportion of action sets than any of the m best classifiers. Thus, the overgeneral classifier will receive an increasing proportion of reproductive events with respect to the best classifiers as m increases. Lower values of ρ produce a strong pressure toward accurate classifiers, and so, even increasing the number of niches, the model nicely approximates the empirical results. Figure 8(a) and 8(b) compare the proportion of the best classifier in the niche for tournament selection for s={2,3,9}. For s=9, the theory accurately predics the empirical results. Increasing the tournament size produces very little variations. For s=3, theory and practical results slightly differ at the beginning of the run, but this difference disappears as the number of activations increases. For s=2, the difference is large; that small tournament size combined with the presence of the overgeneral classifier in all niches produces a strong selection pressure toward the overgeneral classifier. As happened in roulette wheel selection, augmenting the number of overlapping niches increases the selection pressure toward the overgeneral classifier, since the proportion of the action sets that the overgeneral participates in with respect to the best classifier increases with the number of niches. For higher values of s, i.e., s=9, the strong selection pressure toward accurate classifiers can counterbalance this effect. 16
  • 18. Takeover time in RWS for 16 Niches with Overlapping Classifiers and ρ={0.01,0.20} Takeover time in RWS for 16 Niches with Overlapping Classifiers and ρ={0.30,0.40,0.50} 1 1 0.9 0.9 0.8 0.8 Proportion of the Best Classifier Proportion of the Best Classifier Empirical RWS ρ=0.01 Empirical RWS ρ=0.30 0.7 0.7 Model RWS ρ=0.01 Model RWS ρ=0.30 Empirical RWS ρ=0.20 Empirical RWS ρ=0.40 0.6 0.6 Model RWS ρ=0.20 Model RWS ρ=0.40 0.5 0.5 0.4 0.4 0.3 0.3 0.2 0.2 0.1 0.1 0 0 0 2000 4000 6000 8000 10000 12000 14000 16000 0 0.5 1 1.5 2 2.5 3 3.5 4 Activation Time of the Niche Activation Time of the Niche 4 x 10 (a) (b) Figure 7: Takeover time for roulette wheel selection when (a) ρ = {0.01, 0.20} and (b) ρ ∈ {0.30, 0.40} in the 16-niche problem. Takeover time in TS s=9 for 16 Niches with Overlapping Classifiers Takeover time in TS s={2,3} for 16 Niches with Overlapping Classifiers 1 1 0.9 0.9 0.8 0.8 Empirical TS s=2 Proportion of the Best Classifier Proportion of the Best Classifier Model TS s=2 Empirical TS s=9 0.7 0.7 Empirical TS s=3 Model TS s=9 Model TS s=3 0.6 0.6 0.5 0.5 0.4 0.4 0.3 0.3 0.2 0.2 0.1 0.1 0 0 0 2000 4000 6000 8000 10000 12000 14000 16000 0 0.5 1 1.5 2 2.5 3 3.5 4 4.5 5 Activation Time of the Niche Activation Time of the Niche 4 x 10 (a) (b) Figure 8: Takeover time for tournament selection when (a) s=9 and (b) s={2,3} 17