1. 2010 Mid-Term Elections:
Implications for Commercial Real Estate
cassidyturley.com | 1
US Total Public Debt Outstanding
Since World War II, the US House of Representatives has changed political parties
seven times. Last week’s mid-term elections turned the shift of political power for the
next two years in favor of the Republican Party in the House. With a divided Congress
and opposing political parties controlling the Executive and Legislative branches, there
are numerous implications for commercial real estate. Cassidy Turley Research provides
a brief outlook on the mid-term elections in relation to federal debt, legislation, US
employment, and the commercial real estate markets.
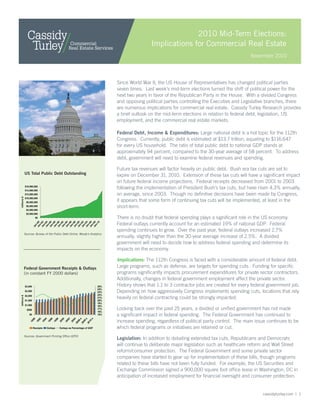
Federal Debt, Income & Expenditures: Large national debt is a hot topic for the 112th
Congress. Currently, public debt is estimated at $13.7 trillion, equating to $116,647
for every US household. The ratio of total public debt to national GDP stands at
approximately 94 percent, compared to the 30-year average of 58 percent. To address
debt, government will need to examine federal revenues and spending.
Future tax revenues will factor heavily on public debt. Bush era tax cuts are set to
expire on December 31, 2010. Extension of these tax cuts will have a significant impact
on future federal income projections. Federal receipts decreased from 2001 to 2003
following the implementation of President Bush’s tax cuts, but have risen 4.3% annually,
on average, since 2003. Though no definitive decisions have been made by Congress,
it appears that some form of continuing tax cuts will be implemented, at least in the
short-term.
There is no doubt that federal spending plays a significant role in the US economy.
Federal outlays currently account for an estimated 19% of national GDP. Federal
spending continues to grow. Over the past year, federal outlays increased 2.7%
annually, slightly higher than the 30-year average increase of 2.5%. A divided
government will need to decide how to address federal spending and determine its
impacts on the economy.
Implications: The 112th Congress is faced with a considerable amount of federal debt.
Large programs, such as defense, are targets for spending cuts. Funding for specific
programs significantly impacts procurement expenditures for private sector contractors.
Additionally, changes in federal government employment affect the private sector.
History shows that 1.1 to 3 contractor jobs are created for every federal government job.
Depending on how aggressively Congress implements spending cuts, locations that rely
heavily on federal contracting could be strongly impacted.
Looking back over the past 25 years, a divided or unified government has not made
a significant impact in federal spending. The Federal Government has continued to
increase spending, regardless of political party control. The main issue continues to be
which federal programs or initiatives are retained or cut.
Legislation: In addition to debating extended tax cuts, Republicans and Democrats
will continue to deliberate major legislation such as healthcare reform and Wall Street
reform/consumer protection. The Federal Government and some private sector
companies have started to gear up for implementation of these bills, though programs
related to these bills have not been fully funded. For example, the US Securities and
Exchange Commission signed a 900,000 square foot office lease in Washington, DC in
anticipation of increased employment for financial oversight and consumer protection.
November 2010
$0
$2,000,000
$4,000,000
$6,000,000
$8,000,000
$10,000,000
$12,000,000
$14,000,000
$16,000,000
Jan-80Jan-82Jan-84Jan-86Jan-88Jan-90Jan-92Jan-94Jan-96Jan-98Jan-00Jan-02Jan-04Jan-06Jan-08Jan-10
billions$
Federal Government Receipts & Outlays
(in constant FY 2000 dollars)
$0
$500
$1,000
$1,500
$2,000
$2,500
$3,000
1990
1992
1994
1996
1998
2000
2002
2004
2006
e
2008
e
2010
e
billions$
15%
16%
17%
18%
19%
20%
21%
22%
23%
24%
25%
Receipts Outlays Outlays as Percentage of GDP
Sources: Bureau of the Public Debt Online, Moody’s Analytics
Sources: Government Printing Office (GPO)
2. 2010 Mid-Term Elections:
Implications for Commercial Real Estate
cassidyturley.com | 2
National Office Using Employment (SA)
November 2010
Implications: The outcomes of issues such as these will affect both public and
private sector hiring and thus demand for commercial real estate. Implementation
of healthcare and financial reform could affect the medical, IT, accounting, and legal
sectors, driving demand for office and medical space and data processing centers.
Additionally, changes in income and capital gains taxes could affect when and how
commercial property is acquired and sold.
Employment: The national employment outlook remains mixed. Though still plagued
by a record-high 9.6% unemployment rate, US non-farm employment improved in
October 2010 by adding 829,000 jobs on a seasonally-adjusted basis compared to
a year ago. After reaching a low point in 3Q 2009, national office-using employment
(mainly the Professional & Business Services and Financial Activities sectors) is
projected to improve, adding an estimated 700,000 to 800,000 jobs annually over the
next five years. However, there is the likelihood that national office employment will
continue to decline for the next two to four quarters if the economy is slow to recover.
Implications: Decisions made by a split government regarding additional financial
stimulus and public spending will impact employment projections. Chances are many
major decisions will not happen in the near-term with a divided government. As a result,
this may only delay decisions by some companies to hire new employees and acquire
additional space.
A “lame duck” government may also hinder improvement of consumer and business
confidence. Business and consumer confidence have demonstrated to be highly
correlated with employment and office space demand. Prolonged levels of low
confidence will only delay a full recovery in the commercial real estate markets.
Nonetheless, national office-using employment will add an estimated 3.7 million jobs
over the next five years. This equates to 550 million to 925 million square feet of
demand for existing or additional office space.
Disclaimer
This report and other research materials may be found on our website at www.cassidyturley.com. This is a
research document of Cassidy Turley in Washington, DC. Questions related to information herein should be
directed to the Research Department at 202-463-2100. Information contained herein has been obtained from
sources deemed reliable and no representation is made as to the accuracy thereof. Cassidy Turley is a leading
commercial real estate services provider with over 2,800 professionals in 60 offi ces nationwide. The fi rm
completed transactions valued over $13 billion in 2009, manages over 420 million square feet on behalf of
private, institutional and corporate clients and supports over 25,000 domestic corporate services locations.
15
17
19
21
23
25
27
29
2000Q
12001Q
12002Q
12003Q
12004Q
12005Q
12006Q
12007Q
12008Q
12009Q
12010Q
12011Q
12012Q
12013Q
12014Q
12015Q
1
MillionsEmployed
15
17
19
21
23
25
27
29
2000Q
12001Q
12002Q
12003Q
12004Q
12005Q
12006Q
12007Q
12008Q
12009Q
12010Q
12011Q
12012Q
12013Q
12014Q
12015Q
1
MillionsEmployed
Source: Bureau of Labor Statistics, Moody’s Analytics
Divided Government Doesn’t Matter
Change in Total Federal Outlays
0.0%
1.0%
2.0%
3.0%
4.0%
5.0%
6.0%
7.0%
8.0%
9.0%
10.0%
11.0%
12.0%
1984
1986
1988
1990
1992
1994
1996
1998
2000
2002
2004
2006
2008
YearoverYearChange
Republican
Controlled
House
Democrat
Controlled
House
Reagan Bush I Bush IIClinton Obama
Shaded Bar =
Opposite Party
President0.0%
1.0%
2.0%
3.0%
4.0%
5.0%
6.0%
7.0%
8.0%
9.0%
10.0%
11.0%
12.0%
1984
1986
1988
1990
1992
1994
1996
1998
2000
2002
2004
2006
2008
YearoverYearChange
Republican
Controlled
House
Democrat
Controlled
House
Reagan Bush I Bush IIClinton Obama
Shaded Bar =
Opposite Party
President
Sources: Government Printing Office (GPO), Cassidy Turley